Experimental Evaluation of Algorithmic Effort
Estimation Models using Projects Clustering
Farzaneh Famoori1 , Vahid Khatibi Bardsiri2, Shima Javadian Moghaddam3, Fakhrosadat Fanian4
Received (2016-05-07) Accepted (2016-08-10)
Abstract — One of the most important aspects of software project management is the estimation of cost and time required for running information system. Therefore, software managers try to carry estimation based on behavior, properties, and project restrictions. Software cost estimation refers to the process of development requirement prediction of software system. Various kinds of
effort estimation patterns have been presented
in recent years, which are focused on intelligent techniques. This study made use of clustering
approach for estimating required effort in software projects. The effort estimation is carried out
through SWR (StepWise Regression) and MLR (Multiple Linear Regressions) regression models
as well as CART (Classification And Regression
Tree) method. The performance of these methods is experimentally evaluated using real software projects. Moreover, clustering of projects is applied to the estimation process. As indicated by the results of this study, the combination of clustering method and algorithmic estimation techniques can improve the accuracy of estimates.
Index Terms — Kmeans clustering, regression, MLR, SWR, CART
I. INTRODUCTION
O
ne of the main objectives of softwareengineering is increasing the reliability of cost estimation of projects facing with limitation in time and cost. Therefore, software engineering tries to make estimation based on problem’s limitations, properties, and conduct. Software cost estimation refers to the process of development requirement prediction of software system. It is
most specifically true about nowadays’ software
projects in which software is becoming a very expensive part. For this, software cost estimation has become highly important for all producers and customers. This estimation enables managers to identify requirements, time, and budget, and to carry customers’ projects according to actual cost. Accurate selection of metrics and approaches is one of the most important issues in software cost estimation. Generally, in data collections, regarding software cost estimation,
there are different traits and properties called
cost drivers. These cost drivers are dependent on developers’ production and engineering process. Much attempt has been put forth to identify the relationship between data collection cost drivers and projects’ size, time, and actuality [1, 2].
It is better for researchers to identify similarities among one data collection through applying
different approaches including regression and studying the influence of each of these properties on effort. Clustering is another approach for data
management and control in which data with
similar properties are categorized into different
sets [3, 4].
All approaches of regression and clustering somehow try to present suitable collections of
metrics and properties having the most influence
1- Department of Computer Engineering, Islamic Azad University, Kerman Branch, Kerman, Iran.
2- Department of Computer Engineering, Kerman Branch. Islamic Azad University, Kerman, Iran.
3- Department of Computer Engineering, Kerman Branch, Islamic Azad University, Kerman, Iran.
16 Journal of Advances in Computer Engineering and Technology, 2(3) 2016
on effort. Therefore, developers can have the best
and the most accurate estimation of future software production. In the following sections, this study continues as follows Section 2 elaborates on the literature. Assessment framework and research methodology are presented in section 3. The proposed method is then introduced in section4. Section 5 presents results and discussion, and
finally, section 6 makes the conclusion of the
research.
II. REVIEW OF THE LITERATURE
Software cost estimation is the beginning process of software development. Inaccurate estimation is one of the root causes of software project failure. In order to prevent this failure, various estimation methods have been proposed most of which are divided into algorithm and non-algorithm methods [5]. Regardless of the methods’ nature, we study methods through two approaches including 1- approaches applying regression for software cost estimation, and 2- approaches applying clustering for software cost estimation.
The simplest form of regression is linear regression built for modeling the value of a quantitative variable dependent on its relationship with one or more predictor. Regression estimates the output value for each given input value based on some preliminary views [6]. Linear regression
and its different kinds have always been under
researchers’ attention. Regression is applicable in
different fields [7,8 ]. For example, Adriane et.al
[9] studied the inconsistency problem of linear regression model resulting in underestimation of actual cost. They proposed two approaches for solving this problem including models estimating model’s mean and applying Marcouf Mount Carlo’ chai for direct presentation of accurate solution. Rong et.al [10] presented a machine learning process based on size reduction for regression issues so that it carries clustering for one set of training data, then take a new feature from each cluster, and reduces problem size for regression issues. Linear methods of segmenting the input space into discrete spaces by linear borders are examples of segmentation by regression MLR, Logistic regression, etc. These techniques are useful for tasks in which classes are scattered linearly [11]. Many other methods have also enjoyed application of regression issues synthetically. Among others, Mehdi et.al [12]
presented a new combination of neural networks through MLR regression based on which model’s
efficiency and accuracy are much more increased.
In second approach, clustering is a general survey for organizing preliminary data into some subsets by applying various techniques. There
are different methods for clustering. For instance,
clustering was used in [13] for software cost estimation. For this, they tried to identify similar sets among software cost properties and estimate
effort through fussy clustering process applying properties set in a specific group. In [14], the influence of outliers on assessing data influential
on the quality of software and software project management is studied. In this method, outliers are
identified in software data sets through Kmeans
clustering approach. [15] Made use of Quad tree based on Kmeans algorithm. Quad tree is applied for pursuing two goals including identifying preliminary centers of clusters in Kmeans algorithm and predicting software module drawbacks. [16] Presented a model according to genetic algorithm and its combination with Cocomo model on data clustering. This model transfers optimal properties of neural networks,
learning ability, and classification for new project
cost estimation through Cocomo model and clustering selecting the best parameters. Another study, [17], made use of Kmeans clustering for identifying classes with the capability of increasing software maintenance in designing levels. [18] presented a testing and producing method for estimating all available data used in Kmeans algorithm. This method made use of a synthesis of Bees algorithm and clusters with valid data for automatic estimation of all clusters.
Clustering is used in various tasks with different
objectives. For example, in [19], two clustering methods of Cmeans and Kmeans are applied for analyzing remote oriented communications of data. In the present study, we made use of a synthesis of regression methods and Kmeans clustering for more accurate estimation that is explained in the following section.
III. RESEARCH METHODOLOGIES
This study analyzes and discusses the results regarding quantity aspects of applying machine learning methods for running models of software
effort estimation. The selected methods of
regression, CART regression, and clustering method explained in this section. Additionally, data preprocessing and selection criteria of estimation accuracy assessment are explained in this section.
1. MLR (Multiple Linear regression)
Researchers are mostly involved with separating, classifying, and categorizing of those
cases whose efficiency is mostly dependent
on the howness of application of functions for certain problems. MLR linear regression is one of these methods and functions built for modeling the value of a quantitative variable dependent on its linear relationship with one or more predictor. Linear regression models assume that there is a linear relationship (straight line) between dependent variable and each predictor. This relationship is stated through the following formula
yi = b0 + b1xi1 + … + bpxip + ei (1)
which: yi is the ith value of dependent quantitative variable, p is the number of
predictors, bj is jth coefficient value, j= p, …, 0,
Xij is the ith value of jth predictor, and ej is the
observed error in ith case mostly used in different
issues of business, medicine, biology, etc [20].
2. SWR (Stepwise Regression)
Another method is stepwise regression. It is
mostly used to show the influence of different
independent variables on dependent variable. In other words, it is used to see which variable,
among others, has the most and best influence
on dependent variable, what is the share of
each variable, and finally what is the level of predictability of each specified variable? For this,
all independent variables are entered into analysis,
and the one with indistinguishable influence on
dependent variable is removed from the analysis. It is carried through two approaches of Forwad Selection and Backward Elimination. In forward selection, all properties are gradually entered into
the deal and removed if they show no influence.
In backward elimination, the procedure is carried reversely [21].
3. CART
Other strong approaches, in this regard, are decision tree algorithms mostly applied for
multistep decision-making processes.
The main strategy of multistep decision-making process is to divide complex decisions into some simpler ones and reach the required decision through combination of simple decisions. Decision tree is a subset of hierarchical decision-making process. Various algorithms have been proposed for creating decision tree including CART having important roles in all aspects of data mining and considered as one of the most important means in this regard. In this method,
sorted in tree, samples are classified from tree
root node to tree leaf nodes. Each attribute of the sample is then tested by each of the internal tree node. Each branch coming out of the node is the corresponding value for that feature. Each leaf node is attributed to one category. Each sample is categorized starting from tree root node, then
testing the specified feature, and moving across
the corresponding branch with the feature value given in sample. It is repeated for each sub-tree whose root is a new node [22].
4. Kmeans clustering
One of the most important methods of data management and control is clustering data with similar attributes in a set of data. Clustering
is applied in various fields including pattern identification, machine learning, data mining,
information recovery, and biological informatics. K-means clustering is one of the most applicable clustering approaches. Its main objective is to minimize the lack of similarity among all members of a cluster from other corresponding clusters [23, 24, 25, 30]. Kmeans clustering depends on the number of clusters and the manner
of identification of the distance between clusters.
Selecting suitable clusters is one of the most important issues in clustering. Suitable cluster
is defined as 1- density: available samples of a
cluster should be similar to each other as much as possible. Data variance is the common criterion for identifying the level of data density, and 2-
separation: samples belonging to different clusters
18 Journal of Advances in Computer Engineering and Technology, 2(3) 2016
all data of one cluster assuming that the distance of each cluster from itself is zero. Therefore, the combination of both criteria is required. In order to assess separation scale, distance functions are used. They include Euclidian function and Manhattan distance function. This study makes use of Euclidian distance function.
5. Data Normalization
Data of each input are mapped to a range of 0 and 1. Linear normalization of data to the range (0-1) is carried through the following equation:
Vnorm = (V-Xmin)/(Xmax - Xmin) (2)
In which, V is the value of X variable that is the goal of the normalization, and Xmin and Xmax are respectively the least and the most value among data.
6. Leave-One-Out
Data are set into n (equal to the primary datasets) parts so that, each time, test set includes only one data record. This mode enjoys the advantage of using most possible data for training. Additionally, the test sets have no
mutual sharing and effectively cover all data sets.
The main drawback of this mode is that it should
be repeated n time, and it is not cost effective. In
addition, since each dataset owns only one data record, the estimated accuracy variance is high.
7. The criteria of estimation accuracy evaluation
Many evaluation criteria have so far been introduced. The most commonly used evaluation criterion running according to the error level of
algorithms is MRE indicating the cost difference
estimated by algorithms with the actual cost, Mean of MRE abbreviated as MMRE that is showing the estimation error mean for all study samples (training and test), and PRED (x) indicating the percent of samples whose estimation error is less or equal to X.
MRE (Mean Relative Error)
In some cases, MRE is applied as a criterion for algorithm accuracy evaluation for identifying
the difference between estimated cost and actual
cost of the selective software project. It is estimated through the following equation [26].
𝑀𝑀𝑀𝑀𝑀𝑀𝑀𝑀𝑀𝑀𝑀𝑀 = |𝐴𝐴𝐴𝐴𝐴𝐴𝐴𝐴𝐴𝐴𝐴𝐴𝐴𝐴𝐴𝐴𝐴𝐴𝐴𝐴𝐴𝐴𝐴𝐴 𝑀𝑀𝑀𝑀𝐸𝐸𝐸𝐸𝐸𝐸𝐸𝐸𝐸𝐸𝐸𝐸𝐸𝐸𝐸𝐸𝐴𝐴𝐴𝐴 − 𝑀𝑀𝑀𝑀𝐸𝐸𝐸𝐸𝐴𝐴𝐴𝐴𝐸𝐸𝐸𝐸𝐸𝐸𝐸𝐸𝐴𝐴𝐴𝐴𝐴𝐴𝐴𝐴𝐸𝐸𝐸𝐸𝐸𝐸𝐸𝐸 𝑀𝑀𝑀𝑀𝐸𝐸𝐸𝐸𝐸𝐸𝐸𝐸𝐸𝐸𝐸𝐸𝐸𝐸𝐸𝐸𝐴𝐴𝐴𝐴𝐴𝐴𝐴𝐴𝐴𝐴𝐴𝐴𝐴𝐴𝐴𝐴𝐴𝐴𝐴𝐴𝐴𝐴𝐴𝐴𝐴𝐴𝐴𝐴 𝑀𝑀𝑀𝑀𝐸𝐸𝐸𝐸𝐸𝐸𝐸𝐸𝐸𝐸𝐸𝐸𝐸𝐸𝐸𝐸𝐴𝐴𝐴𝐴 | (3)
In which, Actual Effort is the actual effort of project samples in data Estimated Effort is the effort estimated by study algorithm.
MMRE (Mean Magnitude Relative Error)
In some other studies, the difference of the
cost estimated by study algorithm with the actual cost for all MMRE study samples is considered as the evaluation criterion of algorithm accuracy [27]. The following equation states it as
𝑀𝑀𝑀𝑀𝑀𝑀𝑀𝑀𝑀𝑀𝑀𝑀𝑀𝑀𝑀𝑀=𝑛𝑛𝑛𝑛 �1 |𝑀𝑀𝑀𝑀𝐸𝐸𝐸𝐸𝐸𝐸𝐸𝐸𝐸𝐸𝐸𝐸𝐸𝐸𝐸𝐸𝐸𝐸𝐸𝐸𝐸𝐸𝐸𝐸𝐸𝐸𝐸𝐸𝐸𝐸𝐸𝐸(𝐸𝐸𝐸𝐸)𝐴𝐴𝐴𝐴𝐴𝐴𝐴𝐴𝐸𝐸𝐸𝐸𝐴𝐴𝐴𝐴𝐸𝐸𝐸𝐸𝐴𝐴𝐴𝐴(𝐸𝐸𝐸𝐸)− 𝐴𝐴𝐴𝐴𝐴𝐴𝐴𝐴𝐸𝐸𝐸𝐸𝐴𝐴𝐴𝐴𝐸𝐸𝐸𝐸𝐴𝐴𝐴𝐴(𝐸𝐸𝐸𝐸)| (4)
In which, n is the number of evaluation
projects, Estimated is the cost identified by evaluation algorithm, Actual is the actual effort
or cost.
Therefore, less MMRE, less algorithm estimation error, and it is an indication of a better accuracy.
PRED (Percentage Relative Error Deviation)
In order to evaluate algorithm accuracy, some studies make use of PRED (x) i.e. the probability of the estimated error for all evaluation samples is less or equal to x [28]. This probability is estimated through the following equation
PRED(x) = k/n (5) In which, x is the level of difference that
is in most of the studies 1.25. k is the number
of samples so that the difference of the cost
estimated by evaluation algorithm with the actual cost is less or equal to X. n is the total number of evaluation samples
IV. THE PROPOSED METHOD
As mentioned before, software project features are mostly complex, nonlinear, and unrecognizable due to their inconsistent and uncertain nature of software projects. Non-algorithm methods of datasets are used for estimation in most of the software projects. In these datasets, there are many irrelevant and opposite projects referred to it as irrelevant data in data mining discussions. Machine learning methods create a training model for themselves through available data and starts estimation procedure accordingly. Therefore, the existence
of irrelevant data influences estimation quality
leading to inaccurate and unreliable estimations. In order to increase the estimation accuracy of
software development effort, this paper is going
to resolve this problem through clustering of three projects. In order to increase the accuracy
of effort estimation of software development, the synthesis of clustering approach and different
regression approaches is used. In fact, clustering is one of the common techniques applied in data mining. K-means, one of the most common algorithms of clustering, is mostly welcomed due to its easy implementation and fast function. A clustering is considered the best when the total homogeneity between the center of the cluster and that of all cluster’s members is maximized while the total homogeneity among centers of clusters is
minimized. The clustering with different clusters
is applied on data. Accompanied by some trial and error, clustering is optimal with three clusters presenting better results.
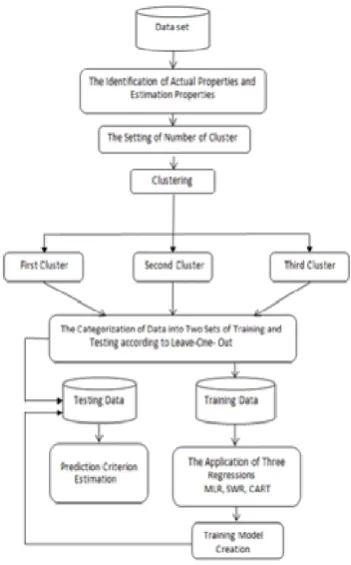
In order to prepare data, first goal properties and other properties are separately specified.
Clusters are then set for k-means clustering. They are next categorized into two groups of training and testing sets. Then, in training stage, the machine is trained through training data, SWR and MLR regression models, and CART
decision tree. Effort is then estimated through this models and training stage is finished. Applying
testing data and CART, SWR, and MLR models,
efforts are then estimated. Next, the difference
between testing data estimation and the actual
effort is estimated and presented as MRE.
Leave-One-Out evaluation approach is used for better performance i.e. one observation is taken out per each cluster observation, trained with other
observation of training cluster, and finally tested
with that taken observation. This process is run
for each cluster, and finally the mean out of MRE
and according to Leave-One-Out is estimated.
MRE median is identified, and number of MRE
less than 0.25 is enumerated and presented as PRED. All stages of the present study are
illustrated in fig. 1.
Fig. 1. The procedural stages of the paper
V. TESTS AND RESULTS
1.All data
Being under the influence of qualitative and
quantitative factors, software cost estimation is a complex process. Researchers make a complex of these qualitative and quantitative factors
resulted from different projects as a dataset. They
then estimate new software development cost according to those factors. Various datasets have been applied for software cost estimation two of which are explained as follows. Both dataset are in the public domain, enabling researchers to
available our findings.
Desharnais Dataset
Journal of Advances in Computer Engineering and Technology, 2(3) 2016 20
language [29].
The dependent variable is software
development effort measured by time for each one
[29]. The following Table I illustrates dependent variable’s properties.
Maxwell dataset
This dataset consists of 62 software projects from the biggest international banks in Finland. This dataset includes 25 independent variables determined through software properties including application and size. The dependent variable is
software development effort determined through
the time of carried task by software providers from technical properties to the submission time [29].
These stages are carried on datasets taken from www.promise.site.uottawa.ac published in 2004 regarding in Table II.
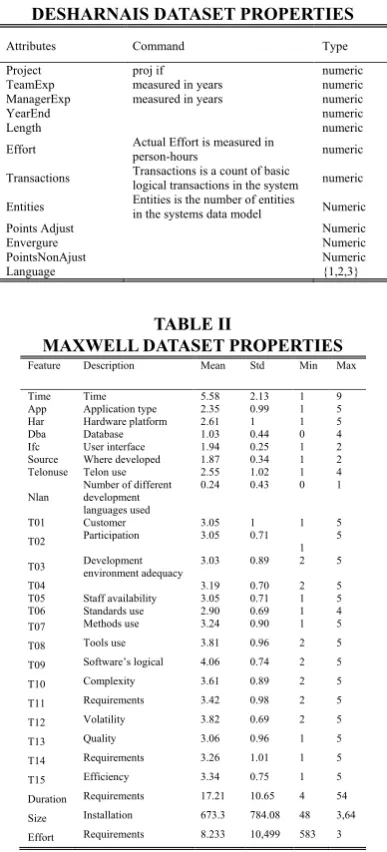
TABLE I
DESHARNAIS DATASET PROPERTIES
Attributes Command Type
Project proj if numeric
TeamExp measured in years numeric
ManagerExp measured in years numeric
YearEnd numeric
Length numeric
Effort Actual Effort is measured in person-hours numeric
Transactions Transactions is a count of basic logical transactions in the system numeric Entities Entities is the number of entities in the systems data model Numeric
Points Adjust Numeric
Envergure Numeric
PointsNonAjust Numeric
Language {1,2,3}
TABLE II
MAXWELL DATASET PROPERTIES
Feature Description Mean Std Min Max
Time Time 5.58 2.13 1 9
App Application type 2.35 0.99 1 5
Har Hardware platform 2.61 1 1 5
Dba Database 1.03 0.44 0 4
Ifc User interface 1.94 0.25 1 2
Source Where developed 1.87 0.34 1 2
Telonuse Telon use 2.55 1.02 1 4
Nlan Number of different development languages used
0.24 0.43 0 1
T01 Customer 3.05 1 1 5
T02 Participation 3.05 0.71 1 5 T03 Development environment adequacy 3.03 0.89 2 5
T04 3.19 0.70 2 5
T05 Staff availability 3.05 0.71 1 5
T06 Standards use 2.90 0.69 1 4
T07 Methods use 3.24 0.90 1 5
T08 Tools use 3.81 0.96 2 5
T09 Software’s logical 4.06 0.74 2 5
T10 Complexity 3.61 0.89 2 5
T11 Requirements 3.42 0.98 2 5
T12 Volatility 3.82 0.69 2 5
T13 Quality 3.06 0.96 1 5
T14 Requirements 3.26 1.01 1 5
T15 Efficiency 3.34 0.75 1 5
Duration Requirements 17.21 10.65 4 54
Size Installation 673.3 784.08 48 3,64
Effort Requirements 8.233 10,499 583 3
2. Results
The obtained results of the present study are evaluated through two approaches of clustering and non-clustering (with and without clustering
approaches). Results are first stated then
compared together.
In non-clustering approach, data are categorized into two groups of training and
testing. The model is first created through
training data and then evaluated through testing data. Data, in this stage, are randomly divided into two sets of training and testing through Leave-One-Out approach. MLR, MLR with intercepts, and CART tree regressions are then carried on data. In clustering approach, data are
first divided into three optimal clusters through
kmean in which the last column (dependent column) is not considered in clustering. The procedure run for the previous mode is next run on each cluster, and the results are evaluated with MRE and PRED criteria. This procedure is run on two datasets of Maxwell and Desharnais whose results are illustrated through Table III, IV, V and VI, respectively. Table III and IV illustrate the results of each cluster separately. The results obtained from evaluation criteria including MRE and PRED are presented separately for each regression. In addition, the results of each three clusters are presented separately through Tables III and IV for Maxwell and DESHARNAIS datasets, respectively. The number of samples is not the same in clusters. As indicated by the results, the value of MRE in CART regression is less than the other regressions, and the value of PRED in CART regression is more than the others.
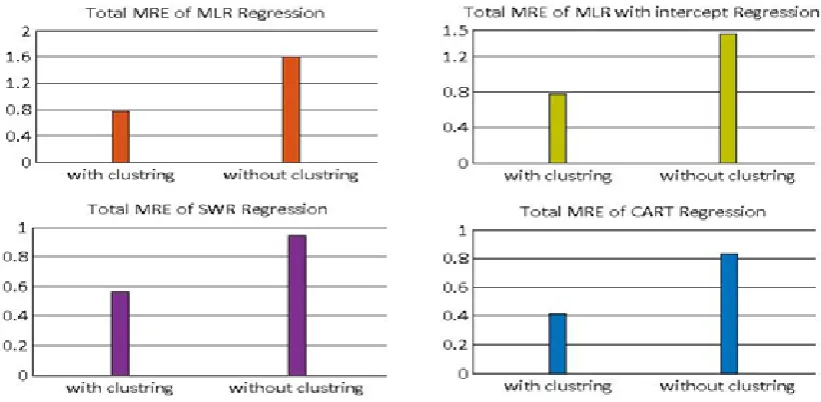
Total results of both clustering and non-clustering modes are presented in Table V for Maxwell dataset and in Table VI for DESHARNAIS dataset. In these tables, the mean of MRE i.e. the general mean of MRE in three clusters, the median of MRE, and the PRED of all three clusters in clustering mode are presented. Additionally, the mean of MRE, the median of MRE, and the PRED for each regression in non-clustering mode are presented separately. As indicated by the results, the value of MRE, MMRE, and PRED is less in clustering mode than non-clustering mode.
This study made use of Bar figure for a better
presentation of the results and better comparison
of regression performance. The bar figure of
in Fig. 2, and PRED criterion on Maxwell dataset is shown in Fig. 3. MRE and PRED of four regressions of MLR, MLR with intercept, SWR, and CART in both clustering and non-clustering
modes are presented separately. Each figure consists of one index so that the first index is for
clustering mode and the second one is for non-clustering mode.
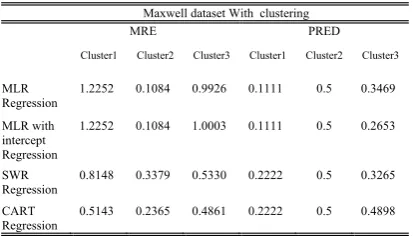
TABLE III
THE RESULTS OF MRE AND PRED FOR EACH CLUSTER ON MAXWELL DATASET
Maxwell dataset With clustering
MRE PRED
Cluster1 Cluster2 Cluster3 Cluster1 Cluster2 Cluster3
MLR
Regression 1.2252 0.1084 0.9926 0.1111 0.5 0.3469
MLR with intercept Regression
1.2252 0.1084 1.0003 0.1111 0.5 0.2653
SWR
Regression 0.8148 0.3379 0.5330 0.2222 0.5 0.3265
CART
Regression 0.5143 0.2365 0.4861 0.2222 0.5 0.4898
TABLE IV
THE RESULTS OF MRE AND PRED FOR EACH CLUSTER ON DESHARNAIS DATASET
Desharnais dataset With clustering
MRE PRED
Cluster1 Cluster2 Cluster3 Cluster1 Cluster2 Cluster3
MLR
Regression 0.5302 0.3019 0.0970 0.2619 0.3929 0.2857 MLR with
intercept Regression
0.4776 0.3473 0.0970 0.3571 0.2500 0.2857
SWR
Regression 0.5235 0.4288 0.2078 0.3333 0.3929 0.1429 CART
Regression 0.6177 0.2252 0.1711 0.3810 0.3571 0.2857
As indicated by the results of the figure
comparison, the value of MRE in clustering mode is less than the non-clustering mode. The value of MRE in CART regression is less than other regressions. Moreover, the value of PRED in clustering mode is more than the non-clustering mode, and it is more in CART regression than other regressions.
Additionally, the bar figure of MRE error
mean on Desharnais dataset and PRED criterion on Desharnais dataset are respectively shown in Fig.4 and 5. MRE and PRED criteria for four regressions of MRE, MRE with intercept, SWR, and CART are also separately presented for clustering and non-clustering modes. As indicated by the results, the value of MRE in clustering mode is less than non-clustering mode. The value of MRE in MLR with intercept regression is less than other regressions. Moreover, the value of PRED in clustering mode is more than non-clustering mode, and it is more in CART regression than other regressions.
TABLE V
THE RESULTS OF CLUSTERING AND NON-CLUSTERING MODE ON MAXWELL DATASET Total Results on Maxwell dataset
With clustering without clustering
Total Mean MRE Total Median MRE Total Mean PRED Mean MRE Median MRE Mean PRED
MLR Regression
0.7754 0.3985 0.3193 1.6019 0.5744 0.1935
MLR with intercept
Regression 0.7780 0.4197 0.2921 1.4600 0.6281 0.2742
SWR Regression
0.5619 0.3436 0.3496 0.9410 0.5935 0.1452
CART Regression
Journal of Advances in Computer Engineering and Technology, 2(3) 2016 22
TABLE VI
THE RESULTS OF CLUSTERING AND NON-CLUSTERING MODE ON DESHARNAIS DATASET Total Results on Desharnais dataset
With clustering without clustering
Total Mean MRE Total Median MRE Total Mean PRED Mean MRE Median MRE Mean PRED
MLR Regression 0.3097 0.1806 0.3135 1 1 0
MLR with intercept
Regression 0.3073 0.2138 0.2976 1.2087 0.5821 0.2338
SWR Regression 0.3867 0.1543 0.2897 1.2087 0.5821 0.2338
CART Regression 0.3380 0.1452 0.3413 1.2087 0.5821 0.2338
Fig. 2. MRE error mean on Maxwell dataset
Fig. 4. mean of MRE error on Desharnais dataset
Fig. 5. PRED criterion on Desharnais dataset Next, the general comparison of two datasets
in clustering mode is run so that MRE and PRED criteria for all regression are separately presented
in Fig.6 to 9, respectively. In each figure, four indices are illustrated so that the first index
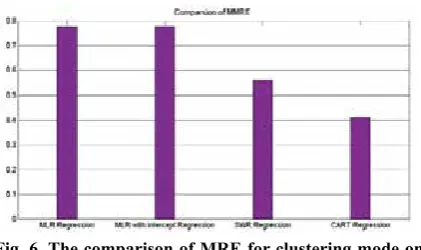
is for MLR regression, the second index is for MLR with intercept regression, the third index is for SWR regression, and the fourth index is for CART tree. The results indicated that Maxwell dataset performance gets better relative to other regressions when data are trained and tested with CART regression. In Desharnais dataset, MRE criterion performs better in MLR with intercept regression than other regressions, and PRED criterion functions in CART regression better than other regressions.
Comparing two modes, the results indicate that the error level decreases applying clustering
mode. In fact, clustering makes similar data to be set in the same cluster. Generally, in two modes of clustering and non-clustering, CART regression performs better than other regressions presenting more accurate results.
Journal of Advances in Computer Engineering and Technology, 2(3) 2016 24
Fig. 7. The comparison of PRED criteria for clustering mode on Maxwell dataset
Fig. 8 . The comparison of MRE for clustering mode on Desharnais dataset
Fig. 9 . The comparison of PRED criteria for clustering mode on Desharnais dataset
VI. CONCLUSION
Given the uncertain and inconsistent nature of estimation as well as the aim of increasing estimation accuracy, applying machine-learning
methods in estimating software cost and effort is
gradually attracting attention. Machine learning methods create a training method through available data of dataset and perform estimation procedure accordingly. Clearly, the existence of
irrelevant data influences the training quality of
algorithms resulting in inaccurate and unreliable estimations. For this, this paper tries to resolve this problem applying project clustering. The present paper makes use of this approach synthesized with regression approaches due to easy implementation and fast functioning of clustering for increasing the accuracy of estimation. This approach performed well with three clusters and through trial and error. Therefore, in tests, instead of considering all data in training set, the available data in each cluster are considered as training set. Four regression methods of MLR, MLR with intercept, SWR, and CART are applied. For this, the accuracy of model with clustering and through CART regression is higher than that of without clustering. Therefore, clustering can be extensively applied in software estimation procedures.
However, since this approach is effective in clustering but not in projects with unspecified
numbers of clusters, it cannot be feasibly applied.
REFERENCE
[1] Angelis, L., Stamelos, I., Morisio, M., 2001, Building a software cost estimation model based on categorical data. Proceedings of the International Software Metrics Symposium, pp.4 – 15.
[2] Sommerville, I., 2006, Software Engineering: (Update) (8th Edition) (International Computer Science), Addison-Wesley Longman Publishing Co., Inc. Boston, MA, USA.
[3] Yang, F., Sun, T. and Zhang, Ch., 2009, “An efficient
hybrid data clustering method based on K-harmonic means and Particle Swarm Optimization”, Expert Systems with Applications, pp. 9847–9852.
[4] Hamerly, G. and Elkan, Ch., 2002,”Alternatives
to the k-means algorithm that find better clusterings”,
Proceedings of the international conference on Information and knowledge management, pp.600-607.
[5] Liu, Q., Chu, X., Xiao, J. and Zhu, H., 2014, “Optimizing Non-orthogonal Space Distance Using PSO in Software Cost Estimation”, Proceedings of the Annual Computer Software and Applications Conference, pp. 21 – 26.
[6] Rawlings, J. O., Pantula, S. G., Dickey, D. A., 1998, “ Applied Regression Analysis: A Research Tool”, Springer-Verlag New York.
[7] Han, J., Kamber, M. and Pei, J., 2011, “ Data Mining: Concepts and Techniques, Third Edition (The Morgan Kaufmann Series in Data Management Systems)”, Elsevier Inc.
[8] Hand, D. J., Smyth, P. and Mannila, H., 2001, “Principles of data mining”,MIT Press Cambridge, MA, USA.
[9] Raftery, A. E., Madigan, D., Hoeting, J. A., 1997, “Bayesian Model Averaging for Linear Regression Models”, Journal of the American Statistical Association, pp. 179-191.
[10] Xu, R. F. and Lee, Sh. J., 2015, “Dimensionality reduction by feature clustering for regression problems”, Information Sciences, pp. 42–57.
[11] Satapathy, S. Ch., Murthy, J. V. R., Prasad Reddy, P.V.G.D., Misra, B.B., Dash, P.K., and Panda, G., 2009, “ Particle swarm optimized multiple regression linear model
for data classification”, Applied Soft Computing, pp. 470–
476.
[12] Khashei, M., Hamadani, A. Z. and Bijari, M., 2012,
“A novel hybrid classification model of artificial neural
networks and multiple linear regression models”, Expert Systems with Applications, pp. 2606–2620.
[13] Aroba, J., Cuadrado-Gallego, J., JSicilia, M. Á., Ramos, I. and García-Barriocanal, E., 2008, “Segmented software cost estimation models based on fuzzy clustering”, Journal of Systems and Software, pp. 1944–1950.
[14] Yoon, K. A., Kwon, Oh. S. and Bae, D.H., 2007, “An Approach to Outlier Detection of Software Measurement Data using the K-means Clustering Method”, Proceedings of the International Symposium on Empirical Software Engineering and Measurement, ,pp. 443 – 445.
[15] Bishnu, P.S. and Bhattacherjee, V., 2012, “Software Fault Prediction Using Quad Tree-Based K-Means Clustering Algorithm”, IEEE Transactions Knowledge and Data Engineering, pp. 1146 – 1150.
[16] Rajput, P. K., Sikka, G. and Aarti, 2014, “CGANN-Clustered Genetic Algorithm with Neural Network for Software Cost Estimation”, Proceedings of the International Conference on Advances in Engineering and Technology (ICAET’), pp. 268- 272.
[17] Malviya, A. K. and Yadav, V. K., 2012, “Maintenance activities in object oriented software systems using K-means clustering technique: A review”, Proceedings of the International Conference on Software Engineering (CONSEG), pp. 1 – 5.
[18] Mahmuddin, M. and Yusof, Y., 2010, “Automatic estimation total number of cluster using a hybrid test-and-generate and K-means algorithm”, Proceedings of the International Conference on Computer Applications and Industrial Electronics (ICCAIE), pp. 593 – 596.
[19] Velmurugan, T., 2014, “Performance based analysis between k-Means and Fuzzy C-Means clustering algorithms for connection oriented telecommunication data”, Applied Soft Computing, pp. 134–146.
[20] Fisher, R. A., 1936, “The Use of Multiple Measurements in Taxonomic Problems”, Annals of Eugenics, pp.179-188.
[21] Papatheocharous, E., Papadopoulos, H. and Andreou, AS., 2010, “Feature subset selection for software cost modeling and estimation”, Software Engineering, pp. 1-22.
[22] Kotsiantis, S. B., 2013, “ Decision trees: a recent
overview”,Artificial Intelligence Review, pp. 261-283.
[23] Hodge, V. and Austin, J., 2004, “A Survey of
Outlier Detection Methodologies”, Artificial Intelligence
Review, pp.85 – 126.
[24] Hartigan, J. A. and Wong, M. A., 1979, “Algorithm AS 136: A K-Means Clustering Algorithm”. Journal of the Royal Statistical Society, pp. 100–108.
[25] Kanungo, T., Mount, D. M., Netanyahu, N. S., Piatko, C. D., Silverman, R. and Wu, A. Y., 2002, “An
efficient k-means clustering algorithm: Analysis and
implementation” IEEE Transactions on Pattern Analysis and Machine Intelligence, pp. 881–892.
[26] Kaushik, A., 2012, “COCOMO Estimates Using Neural Networks,” International Journal of Intelligent Systems and Applications (IJISA), pp. 22–28.
[27] Hamza, H., Kamel, A. and Shams, K., 2013,
“Software Effort Estimation using Artificial Neural
Networks: A Survey of the Current Practices,” Proceedings of the International Conference on Information Technology: New Generations (ITNG), pp. 731 - 733.
[28] Sehra, S. K., Brar, Y. S. and Kaur, N., 2011, “SOFT COMPUTING TECHNIQUES FOR SOFTWARE PROJECT EFFORT ESTIMATION,” international Journal of Advanced Computer and Mathematical Sciences, pp. 160–167.
Journal of Advances in Computer Engineering and Technology, 2(3) 2016 26
Ensemble Models for Software Development Effort
Estimation,” Hindawi Publishing Corporation Mathematical Problems in Engineering, pp.1-21.