2.5
time series and its relation with cardiovascular mortality rate using R
software
Payman Kaseb1, Ramin Nabizadeh2, Kazem Nadafi2, Kamyar Yaghmaeian3
1 Department of Environmental Health Engineering, School of Public Health, Tehran University of Medical Sciences, Tehran, Iran
2 Center for Air Pollution Research (CAPR), Institute for Environmental Research (IER) AND Department of Environmental Health Engineering, School of Public Health, Tehran University of Medical Sciences, Tehran, Iran 3 Center for Water Quality Research, Institute of Environmental Research (IER) AND Department of Environmental Health Engineering, School of Public Health, Tehran University of Medical Sciences, Tehran, Iran
Abstract
Among the numerous air pollutants, the strongest proof for adverse health effects has been reported for particulate matter (PM). The aim of this study was the exploration of short-term associations of air pollution with mortalities due to cardiovascular diseases (CVD) in Tehran, Iran, based on hospital and census data from 2007 to 2013. This descriptive and analytical research was conducted in 2015. Daily and hourly pollutant concentration was obtained from Tehran Metropolitan Municipality. Mortality rate records were obtained from the Ministry of Health, Central Municipal Cemetery, and Forensic Organization. In this study, data were analyzed using R software. Zoo, Time series, Stats, ts model, and Splines software packages were installed on R platform in order to outline the trend of different variables. The results showed that accidental mortality did not follow a particular trend and non-accidental mortality followed a descending or ascending trend. However, mortality pattern showed a decreasing trend from 2011 until the end of 2012. From the beginning of 2013, mortality pattern showed increasing trend. Moreover, the direct correlation of mortality rate and PM2.5 concentration can be observed in a yearly and weekly time scale. Proof of a determined effect of airborne particles on mortality was found with PM2.5. In addition, it was found that mortality rate shows a strong seasonal pattern, with a peak in winter and a minimum in fall. The peak the mortality rate in winter is most probably due to the spread of infectious diseases such as influenza as well as temperature-related phenomena in cold weather areas.
KEYWORDS: Air Pollution, Mortality, PM2.5, R software
Date of submission: 15 May 2015, Date of acceptance: 24 Jul 2015
Citation: Kaseb P, Nabizadeh R, Nadafi K, Yaghmaeian K. Exploratory analysis of PM2.5 variation
trend of Tehran, Iran, in various time series and its relation with cardiovascular mortality rate using R software. J Adv Environ Health Res 2015; 3(4): 276-83.
Introduction
1During the previous 50 years, air pollution and its impact on individuals’ health and the environment have been a global concern. The negative health effects of air pollution consist of a broad range of acute and chronic health
effects causing increased hospital
Corresponding Author:
Ramin Nabizadeh
Email: [email protected]
admissions,1 increased emergency room
visits,2 and, most importantly, increased
mortality.3 The World Health Organization
(WHO) estimated that ambient (outdoor) air pollution in both cities and rural areas caused 3.7 million premature deaths worldwide in
2012.4 Epidemiological studies have revealed
short-term and long-term associations between the levels of ambient air pollutants,
and respiratory and cardiovascular
mortalities in different parts of the world.3
Previous studies regarding air pollution have
focused mostly on nitrogen dioxide (NO2),
particulate matter (PM) with an aerodynamic diameter of less than 10 mm (PM10), sulfur dioxide (SO2), or ozone (O3).4 Among the
numerous air pollutants, the strongest proof for adverse health effects has been reported
for PM.5 Several studies have shown that
short-term exposure to PM was associated with increased risk of mortality and
morbidity.6,7 The sources and constituents of
the PM mixture are well-known to vary throughout the year. Therefore, besides the different exposure patterns of the population in different seasons, it is believed that the short-term relations between particulate air pollution and daily mortality can also change
from season to season.8 PM with an
aerodynamic diameter of less than 2.5 mm
(PM2.5) has become the focus in recent
research's due to its small size and capability to penetrate deep into the respiratory tract.9
Inflammation, endothelial dysfunction, and autonomic nervous system injuries in rats
due to PM2.5 exposure have been reported in
a recent study.10 A committee of the
American Heart Association in a review in 2004 expressed concern of a causal association between PM and harmful
cardiovascular effects.9 However, other
adverse effects of PM2.5 exposure have been
reported in recent studies. For example, Santos et al. stated that exposure to PM could increase the risk of ventricular tachycardia for aging people with coronary artery disease
(CAD).11 Nevertheless, Xu et al. reported that
cardiac autonomic function of elderly patients with heart disease can result from
ambient PM2.5 exposure, and subjects with
hypertension seemed to be more susceptible to the autonomic dysfunction caused by PM2.5.12 Tehran, as the most overcrowded city
in Iran, has experienced serious air quality problems in the recent years. Today, traffic, industrial processes, domestic heating, long-range transportation of pollutants and motor vehicle are the most significant emission sources in Tehran. With regard to the
aforementioned pollution source, high levels of air pollution-related diseases are expected in Tehran. In Iran a number of studies have been conducted on air pollution related
diseases.13,14 Conversely, the association
between PM2.5 and cardiovascular
morbidities has not been surveyed locally and in Iran. This study was conducted with the aim to explore short-term associations of air pollution with morbidities and mortalities caused by cardiovascular diseases (CVDs) in Tehran based on hospital and census data from 2007 to 2013.
Materials and Methods
Tehran (capital of Iran) is the largest city and urban area of Iran, the 2nd-largest city in Western Asia with an area of 686.3 km². Tehran County borders Shemiranat County to the north, Damavand County to the east, Eslamshahr, Pakdasht, and Rey counties to the south, and Karaj and Shahriar counties to the west. The city of Tehran has 22 municipal districts, each with its own administrative center. Tehran features a semi-arid climate with continental climate characteristics and a mediterranean climate precipitation pattern. Average temperatures in Tehran are between 35 and 40 °C. Most of the light annual precipitation occurs from late autumn until
mid-spring.15 Meteorological factors have
significant effect on air pollution. Wind carries air pollutants away from their source, causing them to disperse. Generally, in higher wind speed, more pollutants are distributed and their concentrations are lowered. However, high wind speed can also
transport dust from long range distances.16
This descriptive and analytical research was conducted in 2015. Daily and hourly pollutant concentration was obtained from the 34 air quality stations of Tehran Metropolitan Municipality. The air quality indicator in our study was PM with aerodynamic diameter of less than 2.5 µm (PM2.5). Mortality rate records of 2007-2013
Organization. Meteorological and demographic information of 22 districts of
Tehran were obtained from the
Meteorological office in Tehran. Deaths from all CVDs were considered.
The locations of air quality monitoring stations are shown in figure 1. A lack of uniformity was observed in the distribution of contaminants in different areas of Tehran, and thus, there was a possibility of data misinterpretation. Therefore, trimmed mean of pollutant concentration in the range of 10% was used instead of daily means of the concentrations calculated from the hourly data of pollutant. Trimmed mean is a reliable
averaging method in which the hsehgih and
tsegih reported data is discarded, and then, the average is taken from the remaining uniform data.17
After editing of incorrect and irrelevant data, all cases of mortality were classified based on age, sex, place of residence, and cause of death. In order to remove
confounding factors and achieve correct results, all cases of death of 65 years of age or younger were selected. Given that the main objective of this research was the assessment of the relation of air pollution with mortality rate, it was necessary to
discard deaths caused by accidents,cancers,
and chronic CVD.
To evaluate the impact of air pollution on human health, epidemiological studies practice statistical approaches which are suitable tools for interpreting data. Time series studies are often used to determine statistical relations of ambient concentrations of pollutants and other environmental factors with mortality. The most favored statistical method over the past two decades has been
Poisson regression with air pollution
variables included as linear predictors and monitoring for time-varying confounders which are feasibly related both to mortality and air pollution.18
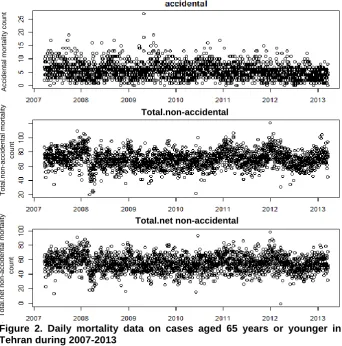
Figure 2. Daily mortality data on cases aged 65 years or younger in Tehran during 2007-2013
In this study, data were analyzed using R software (version 3.2, R Core Team). Zoo, time series, stats, ts model, and Splines software packages were installed on R platform in order to outline the trends of different variables. Moreover, the plot of the autocorrelation function (ACF) of the residuals was examined. To estimate linear
trends of short-term effects of PM2.5 on
mortality, statistical tools developed by Peng
et al.19 were adapted to estimate time-varying
relative rates.20
Results and Discussion
The mortality data for cases aged 65 or younger is presented in figure 2. As shown in figure 2, accidental mortality did not follow a particular trend. By excluding accidental mortality, non-accidental mortality followed a descending or ascending trend. In addition, figure 2 shows that net non-accidental
mortality has the same pattern as non-accidental mortality.
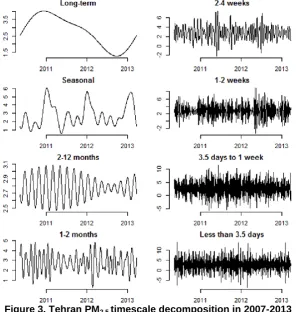
Figure 3 shows PM2.5 time series
decomposition from 2007 to 2013. It appears that daily concentration of PM2.5 has had a
descending trend from 2011 to 2012. At the
end of 2012, daily concentration of PM2.5
showed an increasing trend. It can also be observed in figure 3 that the evident seasonal
pattern in PM2.5 concentration showed a peak
in winter.
Environmental regulations proposed to protect human health are based on a foundation of scientific proof that arises
from toxicological, clinical, and
Figure 3. Tehran PM2.5 timescale decomposition in 2007-2013
This paper presents evidence on the
short-term effects of PM2.5 on mortality during
2007-2013, when several air quality regulations were implemented. Specifically, changes in the risk of exposure to airborne particles were assessed over a period of substantial alterations in the sources and decline in ambient concentrations of airborne particles. For this purpose, almost all
available data on PM2.5 and mortality were
used. As a result, proof of a determined effect of airborne particles on mortality was found
with PM2.5. In a study conducted by Shahi et
al., effects of air pollution on cardiovascular and respiratory causes of emergency admission were evaluated.22 The results of
their study showed thatcarbon monoxide
(CO) level was an independent risk factor of CVD while the increased level of PM2.5 and
O3 led to increased rate of admissions to the
emergency department due to respiratory causes.22
Figure 4 shows time series mortality rates among individuals of less than 65 years of
age. As seen in figure 4, the mortality pattern shows a decreasing trend from 2011 until the end of 2012. From the beginning of 2013, mortality pattern shows an increasing trend.
Mortality rate showed a strong seasonal pattern with a peak in winter and a minimum in fall. However, a lower amount of PM2.5
was observed in winter. Thus, the peak in winter mortality is most probably due to the spread of infectious diseases, such as influenza, as well as temperature-related phenomena in cold weather areas. Higher
amount of PM2.5 during fall can be related to
car traffic since the schools open in the fall. According to our study, the risk of mortality due to air pollution can occur up to 50 days (50 days lag) after exposures especially lag 0. Goudarzi et al. studied the relationship between air pollution exposure and chronic obstructive pulmonary disease (COPD) in Ahvaz, Iran, in 2012.23 The results of their
study showed that the annual average PM10
concentration in 2012 was 727 µg/m3.
correlation was observed between hospital
visits due to COPD and PM10 emission in
Ahvaz. In addition, they found that approximately 6.2% of hospital admissions
due to COPD occurred when PM10
concentration was higher than 30 µg/m3.
Figure 4. Tehran mortality timescale
decomposition among individuals of less than 65 years of age in 2007-2013
Figure 5(a) shows a correlogram for the mortality data on Tehran. The correlogram can be computed in R using the ACF function in the stats package. The result shows a peak in lag 0. In other words, the plot shows the quick effect of PM2.5 on mortality rate in the
first day.
Nevertheless, a mild effect was observed
in lag 5, 8, 15, and 21.Figure 4(b) shows the
correlogram of the residuals after removing some of the seasonality of mortality data. The results showed that the effect of PM2.5 on
mortality was observed specifically in lag 0. Cardiovascular mortality was associated
especially with daily mean PM2.5.
Furthermore, PM2.5 was not significantly
associated with total non-accidental
mortality. Based on ACF analysis, the results
of the present study showed that PM2.5
impacted mortality rate. In other cases, we
have not seen any evident effect. This suggests that other seasonal diseases have a significant effect on mortality. Capraz et al. studied the association between air pollution
and mortality in Istanbul, Turkey.3 Their
findings showed that the risk of mortality due to air pollution can occur up to 10 days (10 days lag) after exposure. Moreover, their results showed that cardiovascular mortality was related to daily mean SO2, followed by
NO2 and PM10.3
Figure 5. Autocorrelation functions for
mortality data on Tehran for (a) raw data and (b) residuals after removing seasonality
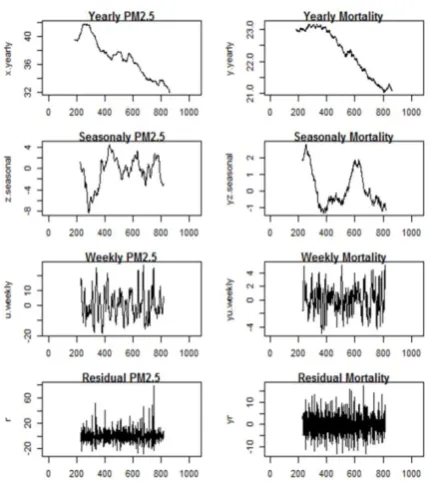
Simultaneous changes in mortality rate and PM2.5 concentration in annual, seasonal,
and weekly time scale are shown in figure 6. As figure 6 shows, direct correlation between
mortality rate and PM2.5 concentration can be
observed in the annual and weekly time scale. Valid correlation was not found in the seasonal time scale. In a study conducted by Lu et al., it was found that associations between air pollution and mortality were more distinct in the warm season than in the
cool season.24 They concluded that the
mortality in china.25 They found that for a 10
µg/m3 increase in pollution concentration, a
1.6%-2.3% additional increase in mortality related to PM, NO2, and SO2 was observed
among individuals aged 65 years or older compared with younger individuals.
Figure 6. Timescale decomposition for PM2.5
and mortality data in Tehran during 2007-2013
Conclusion
Our results showed that short-term exposure
to outdoor air pollution (PM2.5) was
associated with CVD in Tehran between 2007 and 2013. High percentages of observed health effect (CVDs) were linked with high
concentrations of PM2.5. Therefore,
application of methods to reduce PM2.5
concentration plus suitable health and environmental monitoring are recommended. In the present study, it was also found that day-to-day variations in cardiovascular mortality are associated with ambient
concentrations of PM2.5. According to the
results of this study, the risk of mortality due to air pollution can be observed up to 50 days (50 days lag) after the exposure.
Conflict of Interests
Authors have no conflict of interests.
Acknowledgements
This study was funded by the Vice Chancellery for Research of Tehran University of Medical Sciences, Iran.
References
1. European Centre for Environment and Health. Quantification of the health effects of exposure to air pollution. Proceedings of the WHO Working Group; 2000 Nov 20-22; Bilthoven, Netherlands. 2. Buka I, Koranteng S, Osornio-Vargas AR. The
effects of air pollution on the health of children. Paediatr Child Health 2006; 11(8): 513-6.
3. Capraz O, Efe B, Deniz A. Study on the association between air pollution and mortality in stanbul, 2007-2012. Atmos Pollut Res 2016; 7(1): 147-54. 4. Tam WWS, Wong TW, Wong AHS. Association
between air pollution and daily mortality and hospital admission due to ischaemic heart diseases in Hong Kong. Atmos Environ 2015; 120: 360-8. 5. Pope CA 3rd, Dockery DW. Health effects of fine
particulate air pollution: lines that connect. J Air Waste Manag Assoc 2006; 56(6): 709-42.
6. Brook RD, Rajagopalan S, Pope CA 3rd, Brook JR, Bhatnagar A, Diez-Roux AV, et al. Particulate matter air pollution and cardiovascular disease: An update to the scientific statement from the American Heart Association. Circulation 2010; 121(21): 2331-78.
7. Kloog I, Ridgway B, Koutrakis P, Coull BA, Schwartz JD. Long-and short-term exposure to PM2.5 and mortality: using novel exposure models. Epidemiology 2013; 24(4): 555-61.
8. Chen R, Peng RD, Meng X, Zhou Z, Chen B, Kan H. Seasonal variation in the acute effect of particulate air pollution on mortality in the China Air Pollution and Health Effects Study (CAPES). Sci Total Environ 2013; 450-451: 259-65.
9. Cao J, Xu H, Xu Q, Chen B, Kan H. Fine particulate matter constituents and cardiopulmonary mortality in a heavily polluted Chinese city. Environ Health Perspect 2012; 120(3): 373-8. 10. Wang G, Zhen L, Lu P, Jiang R, Song W. Effects
of ozone and fine particulate matter (PM2.5) on rat cardiac autonomic nervous system and systemic inflammation. Wei Sheng Yan Jiu 2013; 42(4): 554-60.
11. Santos UP, Terra-Filho M, Lin CA, Pereira LA, Vieira TC, Saldiva PH, et al. Cardiac arrhythmia emergency room visits and environmental air pollution in Sao Paulo, Brazil. J Epidemiol Community Health 2008; 62(3): 267-72.
rate variability of elderly people with heart disease in Beijing, China. Biomed Environ Sci 2013; 26(8): 629-37.
13. Gholizadeh MH, Farajzadeh M, Darand M. the correlation between air pollution and human mortality in Tehran. Hakim Res J 2009; 12(2): 65-71. [In Persian].
14. Mousavi F, Jahed A, Rajab A, Nikuo Sokhantabar AK, Kashi G, Tabatabaee R. Survey of air pollution effect on variation of glycosylated hemoglobin a1c (hba1c) level in diabetic patients in Tehran. Iran J Health Environ 2013; 6(1): 123-32. [In Persian]. 15. Tehran Municipality. Atlas of Tehran [Online].
[cited 2016]; Available from: URL: http://atlas.tehran.ir/Default.aspx?tabid=40
16. Ramos DP, Quijano S, Orrego D, Becerra MA. Dependence analysis using multiple linear regresion and principal component regression in air pollutants and meteorological parameters: case study. QUID: Investigacion, Ciencia y Tecnologia 2014; (23): 13-20.
17. Hellerstein JM. Quantitative data cleaning for large databases [Online]. [cited 2008 Feb 28]; Available from: URL:
http://db.cs.berkeley.edu/jmh/papers/cleaning-unece.pdf
18. Anderson HR. Air pollution and mortality: A history. Atmos Environ 2009; 43(1): 142-52. 19. Peng RD, Dominici F, Pastor-Barriuso R, Zeger
SL, Samet JM. Seasonal analyses of air pollution
and mortality in 100 US cities. Am J Epidemiol 2005; 161(6): 585-94.
20. Chiogna M, Gaetan C. Dynamic generalized linear models with application to environmental epidemiology. J R Stat Soc Ser C Appl Stat 2002; 51(4): 453-68.
21. Dominici F, Peng RD, Zeger SL, White RH, Samet JM. Particulate air pollution and mortality in the United States: did the risks change from 1987 to 2000? Am J Epidemiol 2007; 166(8): 880-8. 22. Shahi AM, Omraninava A, Goli M,
Soheilarezoomand HR, Mirzaei N. The Effects of Air Pollution on Cardiovascular and Respiratory Causes of Emergency Admission. Emerg (Tehran) 2014; 2(3): 107-14.
23. Goudarzi G, Geravandi S, Mohammadi MJ, Salmanzadeh S, Vosoughi M, Sahebalzamani M. The relationship between air pollution exposure and chronic obstructive pulmonary disease in Ahvaz, Iran. Chron Dis J 2015; 3(1): 14-20.
24. Lu F, Zhou L, Xu Y, Zheng T, Guo Y, Wellenius GA, et al. Short-term effects of air pollution on daily mortality and years of life lost in Nanjing, China. Sci Total Environ 2015; 536: 123-9.