International Journal of Recent Academic Research (ISSN: 2582-158X)
Vol. 01, Issue 09, pp.543-548, December, 2019 Available online at http://www.journalijrar.com
RESEARCH ARTICLE
THE LOCATION OF BLACK PEOPLE AND WHITE PEOPLE IN THE CITY: AN APPROACH TO
CITY PLANNING
*Guilherme Augusto Soares da Motta
Universidade Federal de Uberlândia-UFU, Brazil
ARTICLE INFO ABSTRACT
This paper demonstrates the importance of considering racial segregation issues in the urban territory as opposed to the socio-spatial segregation approach, which considers only income and ignores that the poorest are generally black and brown (pardos - of mixed origins) in the cities of Brazil. We also approach the segregation perspective in the city of Johannesburg in order to consider the problem as a South-global issue and as occurring in countries with great social differentiation in their society. For this, we use data such as the Brazilian (2010) and South African (2011) censuses, an approach that considers the author's experience in both countries, and the elaboration of maps and tables to demonstrate the collected data. This article is not intended to create urban guidelines, but rather to raise discussion of racial issues for urban planning in order to contribute to the search for fairer, more inclusive, equal and equitable cities.
Key Words: Racial segregation, Urban planning. Global-south, Brazil, South-Africa.
Copyright © 2019, Guilherme Augusto Soares da Motta. This is an open access article distributed under the Creative Commons Attribution License, which
permits unrestricted use, distribution, and reproduction in any medium, provided the original work is properly cited.
INTRODUCTION
We usually observe the processes of socio-spatial segregation of cities according to an income approach, where income classes are located within the urban territory. This approach is widely discussed when we study the processes of socio-spatial segregation in very unequal cities, especially in Latin America and Africa. However, we must consider that the processes, despite the difference in scale, are also present in countries in the global north, and have characteristics that are accentuated in more unequal countries. In observing that in the area of urban planning in Brazil, the approaches consider segregation processes mainly from the income point of view, we saw the need to raise the discussion that the poor are usually black and brown. This demonstrates that the search for more inclusive, equal and equitable cities should consider racial issues and the reduction of race-related inequalities, not just income. It is in this same sense that other studies should consider gender inequality in the process of democratization of cities, a focus that will not be addressed in this article. This article uses observation data through the author's experience in Brazil and South Africa, document data, analysis of articles published by scholars of the themes in both countries and in leading academic and scientific journals, as well as specific bibliography to access information related to the proposed theme. Census data from IBGE and the South African Statistical Institute were also used and their spatialization using maps, mainly through the Google Maps tool and Google Earth.
Racial Inequality in Brazil: Historically, we recognize that
Brazil is a country of great social inequality. However, we should thing about what the similarities and differences between Brazil and South Africa are, when talking about social inequality relating to black, white and other races.
Much is said about social inequalities in Brazil and racial inequalities in South Africa, however, little is said about the territorializing of this process in Brazilian cities, especially in contemporary times. In Brazil, in studies of urbanism in Brazil, when dealing with socio-spatial segregation we generally address income classes and their distribution in the territory without normally considering the races and their distribution.
This shows that Kilsztajn et al. (2005) states that there is
confusion in regarding Brazil as a racial democracy, since prejudice appears invisibly and does not show permanent or apparent tensions or conflicts. The authors point out that affirmative action policies have been advanced in Brazil and have been implemented late in the country with the objective of compensating the African descendant population for the obstacles in the affirmation of their citizenship, which are not only equal legal rights, but also equal access opportunities to education and employment. It is evident about the income inequalities observed between blacks and whites in Brazil that:
“the further one is from the end of the slave system, the less the
explanatory power of slavery and the social origin of blacks as a cause of their current social subordination; and greater the
explanatory power of contemporary racism and
discrimination.” (KILSZTAJN et al., 2005) We see with
concern when Brazilian President-elect Jair Bolsonaro (2019-2022) stated in an interview with the TV show “Roda Vida” (07/30/2018) that he will propose to the National Congress to reduce the percentage of public university quotas reserved for blacks and that he has no debt owed to the country regarding the history of Afro-descendent Brazilians. When we see that the new political leader of the country, who should be fighting for more equity and social justice, declares that it is against university quotas, we see that it is necessary to demonstrate that the consequences of this social injustice are present in the territory and that the opportunities between whites and blacks in Brazil are not fair. Beyond the facts, therefore, it is justified Article History:
Received 10th September 2019,
Received in revised form 28th October 2019,
Accepted 04th November 2019, Published online
30th December 2019.
*Corresponding Author:
the appearing of a political current that has grown in the country in recent times and proposes to go back to rights that seek to reduce social inequalities and injustices in Brazil. The Portrait of Race Inequalities in Brazil considers information about women, men, blacks and whites. To this end, it presents indicators from IBGE's National Household Sample Survey (PNAD) on different fields of social life. According to these data, for 2015, 46.3% of the white population was in the poverty situation and was considered extremely poor, poor or vulnerable, while 70% of the black population was in the same poverty situation. This represents that only 30% of the black population, against 53.7% of the white population was in the non-poor situation. Also, according to PNAD (2016), the illiteracy rate is more than double among blacks and browns (approximately 9.9%) than among whites (4.2%). Regarding higher education, 22.9% of whites aged 25 and over have completed higher education, compared to 9.3% of blacks. Another triggering fact that should be exposed is the percentage distribution of the employed population aged 16 and overby gender, color/race and income range in the main job (PNDE/IBGE, 2015):
Table 1. Percentage distribution of employed population 16 years of age and over by gender, color/race, and income range in main job
Whites Blacks
Until 1 MW 22,9 40,5
More than 1 to 3 MW 52,8 49,3
More than 3 to 5 MW 11,7 6,1
More than 5 to 8 MW 7,2 2,8
More than 8 MW 5,3 1,3
Total 100,0 100,0
Source: IPEA (2015), adjusted by the author
According to the data in the table above, the employed white population of 16 years of age and over in the range of over 5 minimum wages (MW) corresponds to 12.5% of total whites, while in this same income bracket category only fit 4.1% of blacks. Considering that in 2009 (IBGE) 51.1% of the Brazilian population declared themselves black or brown and that 48.2% declared themselves white, this means that of the total Brazilian population, 6.03% correspond to whites, which of the employed population of 16 years of age and over have a main job income range of more than 5 minimum wages and only 2.10% correspond to blacks with the same income range. This shows that the percentage among the richest corresponding to blacks is one third compared to whites. Although these differences have narrowed over the years, according to IBGE itself, the income differences between blacks and whites in Brazil are still evident today. Using these data,it becomes clearer how to spatialize the white and black population in the territory, understanding that the upper income class neighborhoods are predominantly white neighborhoods, while the lower income class neighborhoods are predominantly black. The IBGE/IPEA (2011) data show an increase in black participation in the upper deciles of income distribution. Among the richest 10% the participation of the black population, although much lower than the white, rose from about 15% in 1995 to about 24% in 2009. Nevertheless, the racial distribution of wealth is undisputed, and the black population remains underrepresented among the richest and overrepresented among the poorest: in 2009, in the first tenth of the distribution (the poorest 10% of the population), blacks accounted for 72%. It is also worth mentioning the following data (IPEA, 2016): the black homicide rate was two and a half times higher than that of non-black people and the homicide rate of black women was 71% compared to non-black women.
In the period from 2016 to 2017, the black homicide rate increased by 23.1% while that of non-black men fell by 6.8%. In South Africa, until 1994, an institutionalized process of racial segregation called apartheid was in place. Ferreira et al (2011) demonstrated through official data from the South African government (1978) that in the middle of the Apartheid era there were 19 million blacks against 4.5 million white inhabitants. That is, 81% of the South African population was black while the white population was 19%. Territorially, the authors state that blacks occupied 13% of the territory, while whites occupied 87%. In terms of income inequality and access to education and health, the authors demonstrated that during the regime less than 20 percent of national GDP was distributed to blacks and 75 percent to whites. There was one doctor for every 44,000 blacks and one doctor for every 400 whites. The child mortality rate among blacks was 20% in the urban area and 40% in the rural area, and for whites it fell to 2.7%. Education spending on blacks was $ 45 per capita, and for whites it rose to $ 696. Following the end of apartheid in 1994, various policies were adopted to redress the inequalities inherited by the process. Currently, the country is witnessing a significant change, with the growth of the black middle class and its insertion in the upper income segments and the dispersion of this population into territories previously occupied exclusively by whites. Based on the data presented, we must demonstrate the existence of a non-institutionalized process of racial segregation in Brazil. With this, we intend to foster discussions on the theme of territorializing of the process of racial segregation in the field of architecture, urbanism and urban planning, demonstrating the importance of studies of public policies for urban planning that specify the racial problem in the country, and not only the noticeable vicissitudes of socio-spatial segregation by income.
The place of whites and blacks in the territory: Previous
city, data that should only appear more clearly in the next census in 2020. Similarly, we chose the city of Johannesburg- South Africa because the author has spent his doctoral research period in the city and the local census provides data from a high-income gated community, making the data more real without mixing them with other neighborhoods, which could dilute and demonstrate false results. Thus, in Johannesburg, the Dainfern State community, north of the city, was chosen to
represent a predominantly upper-class neighborhood.
Furthermore, we will compare these data with the region of the Integração district, in Uberlandia-MG, considered one of the city's lowest income regions, and with a township in Johannesburg called Diepsloot, located near the Dainfern Estate, also to the north.
A historical process of racial segregation in
Uberlândia-MG: The study of socio-spacial segregation1 should involve
the location of certain income classes in the urban territorial space specific of the city of Uberlândia-MG. For Sposito and Góes (2013), the concept of segregation was initially developed as residential segregation and its origin was associated with the idea that residential use of urban space would result from a process of competition between citizens, which would cause internal homogeneity in the area, in socioeconomic and cultural context. Later, this concept changed to include the relationship between this process, the social classes under capitalism, and the urban land income. In addition, for the authors, the segregation process refers to the residential use of urban space and is adopted by them from the concept of socio-spatial segregation, also used in this dissertation, which does not imply that the process is in fact relative to residential. This perspective, in addition to offering elements for thinking about segregation as a time-space process and not just as a fact, makes it possible to treat it on multiple scales (from the residential area to the city), and in multiple dimensions (highlighting the relationship between the city and the urban, between the objective and the subjective), (...). Adopting this way of understanding segregation, we must distinguish it from differentiation, since for us segregation results from the radicalization and deepening of multiple forms of distinction, segmentation, inequality and, therefore, without reciprocal always be true. There are numerous forms of differentiation that do not effectively represent segregation (SPOSITO and GÓES, 2013). We must also consider the concept of self-segregation, adapted to the practices regarding segregation of the ruling class, according to the authors. The two concepts, segregation and self-segregation, would be specificities of the same process, where segregation is the majority that establishes the total or relative separation of the minority, which is subject to this condition for reasons of different orders and where self-segregation is the group with the best conditions, which decides for isolation in relation to the whole city. Both processes result, therefore, from the deepening of differences (in the cultural, ethnic, religious, political sense) and inequalities (in the socioeconomic sense), as much as they widen it, until reaching levels of radicalism that imply the non-recognition of the equitable right of all to the city, on a large scale - that of society - and the indifference and intolerance towards the other in the microscale - those of
1The definition of the word Segregation, according to an online dictionary
available at http://www.dicionariodoaurelio.com/segregation, defines as segregation meaning the act or effect of segregation and “unequal or unfair treatment of a person or group, and based on prejudices of some kind, notably gender, religious, ethnic, etc”. (Aurélio Online Dictionary, viewed on 30/04/2015)
everyday social and interpersonal relationships (SPOSITO and GÓES, 2013). For Villaça (2001), urban land prices and the social and spatial division of labor reflect a concept of segregation that divides the city into center and periphery. In this context, a historical analysis is important to understand the formation of the city of Uberlândia and the emergence of its periphery and segregation process, especially social, given to certain groups of people, in our case the income classes and their location in space. As we will also observe throughout this paper, segregation in intraurban space can happen voluntarily or involuntarily. According to Villaça (2001), voluntary segregation occurs when the citizen, on his own initiative, seeks to live with other people in his income class.
This is notably observed in the constitution of subdivisions and gated communities, where the higher income classes segregate, especially in the Southern Sector of Uberlândia. Involuntary segregation according to the author occurs when the population is forced by various forces to live in a sector or to stop living in a sector or neighborhood of the city. An example of this form of segregation is the implementation of subdivisions within the PMCMV, where the housing program itself imposes the location of its neighborhoods to this generally middle- and low-income class in urban space. Villaça (2001) also highlights that this segregation process is dialectical, where the segregation of some causes at the same time and by the same process the segregation of others. In this way, we can approximate the author's concepts of voluntary and involuntary segregation with those of Sposito and Góes (2013). In order to understand the process of socio-spatial segregation in the city of Uberlândia-MG, it would not be possible to start this analysis without discussing the process that occurred from the late nineteenth century and located blacks in the territory of Patrimônio da Abadia, currently located in the southern sector of the city. Villaça (2001) states that there are segregations of the most varied natures in the Brazilian metropolises and are mainly of classes, ethnicities or nationalities. The first two types are observed in the city of Uberlândia, in the creation of the Patrimônio Quarter (1899). This neighborhood emerged beyond the original nucleus of the city, after the physical barrier established by Ribeirão São Pedro in a region that is
difficult to reach and located near the municipal
slaughterhouse, inhabited by poor black people. According to Villaça (2001), these physical and social characteristics also portray the best-known segregation pattern of the Brazilian metropolis, which is that of the center x periphery. We could observe for the first time in Uberlândiawith the advent of the constitution of Patrimomio the segregation of the low income class located in the unequipped and distant periphery, in opposition to the original center of the city, occupied by the higher income classes, which had most urban services, public and private.
Currently, data from IBGE (2010) show that the distribution of population by race in Uberlândia-MG is as follows:
Table 2. Population distribution by race in Uberlândia
Color - Race Percentage
White 55,8%
Black 8,4%
Brown 34,5%
Asian 1,1%
Indigenous 0,2%
Total 100%
According to the Uberlândia table above, we can see that the black and brown population correspond to 42.9% of the total population and the white population 55.8%. In Brazil, the IBGE (2010) showed that the white population corresponded to 47.7% and the brown and black population to 50.7%. We should remember that in Brazil the population declares itself to be of a certain race, and the results are obtained through self-declaration. From IBGE (2010) and through information from 17 census tracts that make up Integração in Uberlândia-MG, we observed that the neighborhood has a population distribution by race according to the table below. The Integration neighborhood, also according to the IBGE (2010), houses mainly low-income population. The table above shows that Bairro Integração has 31.50% of the self-declared population as white, and 67.60% of the self-declared population as black and brown. For the sake of clarity, according to the IBGE (2010), we investigated the color or race declared by the person with the following response options: White (for the person who declared himself white); Black (for the person who declared himself black); Asian (for the person who declared himself asian, of oriental origin: Japanese, Chinese, Korean, etc.); Brown (for the person who declared himself brown); or Indigenous (for the person who has declared himself Indian or Indian). In contrast, the following table shows the population by race in four regions, corresponding to the Jardim Barcelona and Jardim Roma Closed Allotments and the Jardim Karaíba and Morada da Colina Neighborhoods, classified as high-income, all located in the Southern city of Uberlândia-MG. The data from the previous table show that in Jardim Barcelona and Jardim Roma
Closed Allotments, 86.5% of the population was self-declared white and 14.5% black and brown. In Jardim Karaíba and Morada da Colina neighborhoods, the proportion was 90.6% white and 8.6% black and brown. It is very clear that the income factor shown above is reflected in the distribution of population by race and territory, by proving that most of the black and brown population live in places of lower income classes. On the other hand, most of the white population occupies the highest income class places, such as the closed lots and neighborhoods of the Southern Sector of Uberlândia-MG.
Territorialization by race in Johannesburg
The authors (Harrison et al., 2014) justify the importance of
their studies in Johannesburg for two reasons. One deals with its importance in the internal context of South Africa. A second reason why we are interested is to approach our studies in cities and their perspectives from the point of view of the Global South, which recognizes the city “in international urban literature as an exemplar of urbanity in the global South.”
(Harrison et al., 2014). For the authors, the urbanization
processes observed in the city were products of South African inequality during the apartheid era. However, it currently recognizes the links between urban transformations observed in the city and in other cities, especially in the global south. According to the authors' data, since the 1990s, unlike many cities around the world, Johannesburg's population density has increased. However, in relation to other cities, we can consider it as a low population density city.
Source: Secretaria Municipal de PlanejamentoUrbano, adapted by the author.
In this context, it is observed that from the end of apartheid the suburbs that were previously occupied by whites began to add a portion of the new black middle class, however, the townships remain exclusively black. Thus, we see a transformation in these suburbs that has become more equitable since the end of apartheid. According to the South African census (Statistcs South Africa - 2011), the population of Johannesburg was 4.4 million, with 2.20 inhabitants per household. The sense also showed that 90.8% of the population was served by electricity or lighting and that 87.1% was served by sewage networks. The population by race in Johannesburg is divided as follows:
The distribution of population of Johannesburg by income is shown according to the following table:
The Dainfern Estate community in Johannesburg is in the north of the city, and according to the South African census
(Statistics South Africa - 2011) has a population of 6,601 people and an average of 3.07 people per household. According to the census, 61% of the population over 20 has a higher education, 98.8% have piped water inside dwelling, 99.8% have electricity for lighting and 99.9% have toilet flush connected to sewerage. As for local income distribution, the data show that 61.6% have incomes above R307,601 (US$ 20,784), while the city average for this income class is 14.6%, ie more than four times the average of this income class, considering the city of Johannesburg. The neighborhood population by race is represented in Table 07.
On the other hand, the township of Diepsloot has a population of 138,329 inhabitants and an average of 2.20 inhabitants per residence. According to the census, only 2.8% of the population over the age of 20 have higher education, 18.4% have piped water inside dwelling, 61.2% have electricity for Table 3. Population by race in the Integração Integrated Neighborhood, Uberlândia-MG
Total Population White Black Asian Brown Indigenous
TOTAL 11422 3598 1415 83 6308 18
PERCENTAGE 100% 31,5% 12,4% 0,7% 55,2% 0,2%
Source: Census, IBGE (2010)
Table 4.Population by race in the Integração Integrated Neighborhood, Uberlândia-MG
Total Population White Black Asian Brown Indigenous
425 359 7 0 59 0 Jardim Barcelona
229 207 0 0 22 0 Jardim Roma
654 566 7 0 81 0 Total
100% 86,5% 1,0% 0% 13,5% 0% Percentage
1446 1354 16 5 71 0 Jardim Karaíba
2239 1983 29 20 200 7 Morada da Colina
3685 3337 45 25 271 7 Total
100% 90,6% 1,2% 0,6% 7,4% 0,2% Percentage
Source: Census, IBGE (2010)
Table 5. Population distribution by racein Johannesburg
Color - Race Percentage
Black African 76,4%
Coloured 5,6%
Indian/Asian 4,9%
White 12,3%
Other 0,8%
Total 100%
Source: http://www.statssa.gov.za, accessed 10/30/2018, adapted by the author.
Table 6. Population distribution by income in Johannesburg
Income (Rand) Income (US$)* Percentage
Upto R19.600 Upto US$ 1.324 35,0%***
From R19.601 to R76.400 From US$ 1.324,01 to US$ 5.162 31,0%
From R76.401 to R307.600 From US$ 5.162,01 to US$ 20.784 19,6%
From R307.601 to R1.228.800 From US$ 20.784, 01 to US$ 83.030 12,2%
Above R1.228.800 Above US$ 83.030 2,4%
Total 100,2%**
According to the US dollar quotation on November 18, 2019; ** Although the sum of the percentage is totaling 100.2%, we transcribe the values available from the researched source; *** Of this figure, 16.8% of the population has no income.
Source: http://www.statssa.gov.za, adapted by the author.
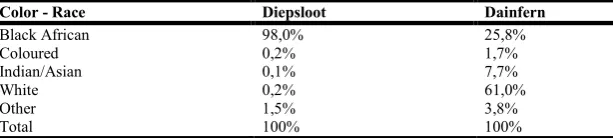
Table 7. Population distribution by race in Diepsloot and Dainfern Estate, Johannesburg
Color - Race Diepsloot Dainfern
Black African 98,0% 25,8%
Coloured 0,2% 1,7%
Indian/Asian 0,1% 7,7%
White 0,2% 61,0%
Other 1,5% 3,8%
Total 100% 100%
lighting and 74.1% have flush toilet connected I am sewerage. As for local income distribution, the data show that 6.9% have incomes above R307, 601 (US$ 20,784), while the city average for this income class is 14.6%. In Dainfern Estate this average is 61.6%, showing that income is lower than the city average and that in Dainfern Estate, income is almost ten times higher than in Diepsloot. The population of the neighborhood by race is distributed according to the table below, compared to Dainfern Estate. Por outro lado, como por exemplo nos mais ricos,em DainfernEstate, a população é composta por brancos na proporção de 61% enquanto os Black African, apesar de 76,4% da população de Johanneburg é presentada por apenas 25,8% dos moradores. For illustration purposes only, another South African township, Alexandra, has 99% of the residents in the Black African group and only 1.3% has incomes over R307,601 ($ 20,784), even lower than the Diepsloot average (6.9%) and of the city of Johannesburg (14.6%). This shows that the poorest are essentially black and inhabit specific areas of the city, with the townships of Diepsloot and Alexandra. On the other hand, the richest in Dainfern Estate is represented by 61% whites while the Black Africans, although 76.4% of Johanneburg's population, represents only 25.8%. residents.
Inclusive Urban Planning: The representativeness of poverty
and inequality is evident in countries such as Brazil and South Africa, which we use in this paper to represent countries of the global south. This work was not intended to create planning policies that institutionalize planning policies to reduce these inequalities. However, when we look at the specific case of Brazil, we would like to draw attention to the need that the planning of Brazilian cities must consider beyond the issues of spatial distribution of income classes in the territory, and create policies that also think about race. The goal isto raise awareness of the fact that cities, to become more democratic about the distribution of population in the territory, have to consider the underrepresentation of blacks among the poorest and their low representation among the richest. History shows us this process over time, and only the policies taken in the
present can reverse this situation in the future if the goal of urban planning is to seek fairer, more inclusive, equal and equitable cities.
Support: This research was supported by the Ministry of
Education of Brazil, Coordination of Improvement of Higher Education Personnel - CAPES, Institutional Program of Scholarships of Sandwich Doctor Abroad - PDSE, Process nº 88881.189706 / 2018-01.
REFERENCES
Brazilian Institute of Geography and Statistics - Instituto
Brasileiro de Geografia e Estatística (IBGE), 2010.
National Household Sample Survey - Pesquisa Nacional por
Amostra de Domicílios (PNAD), IBGE, 2011.
Institute of Applied Economic Research - Instituto de Pesquisa
Econômica Aplicada (IPEA), 2015.
Statistcs South Africa – 2011, in www.statssa.gov.za.
Harrison, P., Gotz, G., Todes, A., Wray, C. Materialities, subjectivities and spatial transformation in Johannesburg.
In: Harrison, P.; Gotz, G.; Todes, A.; Wray, C. Changing
Space, Changing City. Johannesburg after apartheid.
Johannesburg: Wits University Press, 2014. p. 2-39. Kilsztajn, S., Carmo, M. S. N., Sugahara, G. T. L., Lopes, E.
S., Petrohilos, S. S. 2005. Concentração e distribuição do
rendimento por raça no Brasil. Revista de Economia
Contemporânea, V.9, n.2, p-367-384.
Ferreira, A., Lima, M., Castro, T., Araujo, V. 2011. África do
Sul: Perspectivas de desigualdade e pobreza. Trabalho
apresentado para a disciplina Desigualdade e Pobreza. Departamento de Ciências Políticas. Universidade Federal de Minas Gerais.
Sposito, M. E. B. and Goés, E. M. 2013. Espaços Fechados e
Cidades: Insegurança Urbana e Fragmentação Social. São
Paulo: Editora UNESP.
Villaça, Flávio. Espaço intra-urbano no Brasil. São Paulo:
Studio Nobel: FAPESP: Lincoln Institute, 2001.