R E S E A R C H
Open Access
Fidelity monitoring in complex
interventions: a case study of the WISE
intervention
Taren Swindle
1*, James P. Selig
2, Julie M. Rutledge
3, Leanne Whiteside-Mansell
1and Geoff Curran
4Abstract
Background:Researchers face many decisions in developing a measurement tool and protocol for monitoring fidelity to complex interventions. The current study uses data evaluating a nutrition education intervention, Together, We Inspire Smart Eating (WISE), in a preschool setting to explore issues of source, timing, and frequency of fidelity monitoring.
Methods:The overall study from which these data are drawn was a pre/post design with an implementation-focused process evaluation. Between 2013 and 2016, researchers monitored fidelity to evidence-based components of the WISE intervention in 49 classrooms in two Southern states. Data collectors obtained direct assessment of fidelity on a monthly basis in study classrooms. Research staff requested that educators provide indirect assessment on a weekly basis. We used mean comparisons (t-tests), correlations (Pearson’s r), and scatterplots to compare the direct and indirect assessments.
Results:No mean comparisons were statistically different. Correlations of direct and indirect assessments of the same component for the same month ranged between −0.51 (p= 0.01) and 0.54 (p= 0.001). Scatterplots illustrate that negative correlations can be driven by individuals who are over reporting (i.e., self-report bias) and that near zero correlations approximate the ideal situation (i.e., both raters identify high fidelity).
Conclusion: Our findings illustrate that,on average, observed and self-reports may seem consistent despite weak correlations and individual cases of extreme over reporting by those implementing the intervention. The nature of the component to which fidelity is being monitored as well as the timing within the context of the intervention are important factors to consider when selecting the type of assessment and frequency of fidelity monitoring.
Trial registration:NCT03075085Registered 20 February 2017.Trial registration corresponds to the funding that supported the writing of this manuscript, not the data collection. The original study was not a trial and was collected without registration. However, the data reported here provided foundational preliminary data for the trial.
Keywords:Fidelity, Behavioral interventions, Nutrition, Obesity prevention, Implementation science
Background
The success of behavioral interventions depends, in part, on the fidelity with which they are delivered. Fidelity is the
“degree to which an intervention was implemented as de-scribed in the original protocol or as it was intended by the program developers” [1]. Dane and Schneider summarize that fidelity encompasses (1) program adherence, (2) dose of the program delivered, (3) quality of delivery, (4)
participant engagement, and (5) differentiation between crit-ical program features [2]. Assessment of fidelity is crucial because failure of interventions to produce desired change in targeted outcomes (e.g., diet, suicide rates, smoking) may be a result of poor implementation delivery rather than a poorly designed program [3–5]. In preparing to measure fidelity, researchers must decide who will provide fidelity ratings on what aspects of fidelity, at what frequency and at what intervals, with what mode of data collection, and with what standard of fidelity in mind [6]. Researchers must also balance psychometric rigor with pragmatic value [7].
* Correspondence:tswindle@uams.edu
1Department of Family and Preventive Medicine, University of Arkansas for
Medical Sciences, 4301 W. Markham St, #530, Little Rock, AR 72205-7199, USA Full list of author information is available at the end of the article
There are two main approaches to sourcing information on fidelity: direct assessment (i.e., observer report) and indirect assessment (i.e., self-report) [6]. Direct measures include completion of ratings by trained observers of videotape, audiotape, or direct observation. Indirect mea-sures include self-reports using pencil and paper surveys or technology-based submissions [8]. Direct observation methods are considered to be more valid but are more resource-intensive; self-report methods require less re-sources but reflect the implementer’s valuable perceptions. [9] Further, despite the psychometric advantages of direct measures, a 2017 review found that researchers use direct and indirect measures equally as often [10].
Few studies have examined the conditions under which direct and indirect measures of fidelity are most appropriate, and few evaluations provide scientific justi-fication for deciding who provides fidelity information. Further, most available comparisons are limited to stud-ies in the mental health field. In these studstud-ies, the cor-respondence between approaches has varied. In some studies, therapists’ self-reported ratings of fidelity to treatment skills and strategies has demonstrated statisti-cally weak relationships with direct measures of fidelity, [11, 12] with individuals reporting higher fidelity for themselves than observers [13]. However, other studies have found a more nuanced relationship. Correspond-ence between direct and indirect measures has been shown to be stronger for some practices (e.g. practice coverage, client comprehension, homework assignment) than others (e.g., type of exercises completed with client) [14]. Further, despite overestimation of their fidelity, in-direct ratings of fidelity by therapists have at least been consistent across time in their correspondence with dir-ect measures [15]. These studies suggest that indirect measures may still provide useful information in some circumstances for understanding variability in imple-mentation. However, researchers have yet to characterize the circumstance under which indirect measures provide this utility. Further, it is unclear if approaches to fidelity measurement in other fields relate to one another in a similar way. For example, WAVES [16] and High 5 [17] were obesity prevention and nutrition promotion inter-ventions delivered in elementary schools. Both of these behavior change efforts collected direct and indirect measures of fidelity; neither completed or planned com-parisons between the measures. There could be import-ant differences from the field of mental health given the variety of experience, education, and training levels held by those asked to implement nutrition interventions.
Regardless of the source of information, researchers typically struggle to balance at least three elements to get a valid and stable measure of fidelity: (a) resource constraints, (b) the ideal number of fidelity assessments, and (b) the ideal interval for fidelity assessment [18].
Their decisions might differ by intervention and by the implementation setting. However, guidance is largely lacking. Fidelity measures in mental health studies com-paring direct and indirect assessment have ranged widely from one session [11] to every session for a set period of time [15]. Examples of fidelity frequency and intervals for interventions aimed at student behavior change in classrooms range from weekly for 8–10 weeks [19, 20] to once per year [20]. Frequency of collection may also differ across the source of information with self-report being collected more frequently than direct report when both are used within the same study. For example, self-reported fidelity logbooks for each lesson were re-quested in both the WAVES study [16] and Krachtvoer healthy diet intervention [21]; direct observations were conducted three times per year per school and once per classroom per year in these studies, respectively. Choices may reflect the resource-intensive nature of direct obser-vations and illustrate a lack of standard in the field about how much fidelity observation is adequate.
The unique strengths and weaknesses of approaches and schedules for monitoring fidelity deserve further ex-ploration across a broader range of intervention types and implementer characteristics. To progress toward guidelines that inform researchers’ choices about selec-tion of fidelity measurements, an important first step is to replicate the comparisons of direct and indirect mea-sures that exist in the field of mental health. Addition-ally, illustration of how the information captured varies across frequently collected intervals and how approaches to analyzing these data inform conclusions could inform other studies. To this end, our primary objective was to compare direct and indirect measures of fidelity to a nu-trition promotion curriculum among early educators across time. We highlight the use of three distinct de-scriptive analytical approaches and the differential con-clusions that they suggest.
Method Study design
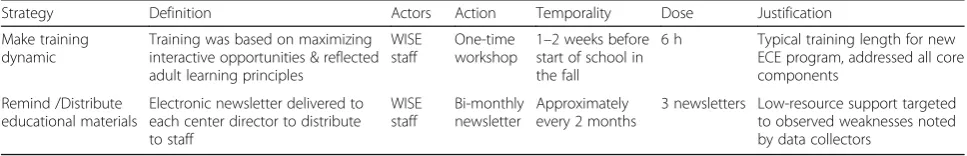
in this study was standard to the field, including a one-time training and bi-monthly reminder newsletters. Table 1 described these strategies in accordance with Proctor and colleagues [24] and Powell et al. [25] recom-mendations and definitions for strategy specification. This study did not focus on testing or comparing implementa-tion strategies.
Intervention
WISE is a classroom-based nutrition promotion interven-tion designed to increase children’s exposure to fruits and vegetables (FV) [26]. WISE is a sensory-based nutrition promotion approach that includes 8-units delivered across the school year through weekly food experiences. These units in chronological order focus on: (1) apples, (2) toma-toes, (3) sweet potatoma-toes, (4) bell peppers, (5) carrots, (6) berries, (7) greens, and (8) green beans. Key components of the intervention (i.e., active ingredients; those with a strong evidence base for impacting child diet) were targeted for fi-delity monitoring during WISE lessons including: hands-on interactions in small groups [27–34], use of an owl mascot (i.e., Windy Wise) to promote the FV [35–40], and role modeling by educators [28,41–44]. Additional detail on the intervention is described elsewhere [26].
Participants
WISE was implemented in 49 classrooms between Fall 2013 and Spring 2016 in three cohorts; 37 classrooms were Head Start; 12 were kindergarten or first grade. Edu-cators in these classrooms who completed fidelity assess-ments were a majority female (98.1%) with a bachelor’s degree or higher (63.6%). Nearly two-thirds were African-American (62.5%), and just under one-third were White (32.1%). Years of experience ranged between 1 and 41 years (mean = 15.81, SD = 10.24).
Measures
For both our direct and indirect assessment of fidelity, we followed the steps outlined by Schoenwald and colleagues [6] for fidelity measurement development: (1) identifying rele-vant components for monitoring (e.g., specificity, necessity, degree of precision), (2) determining who would provide the ratings, (3) obtaining the ratings, and (4) creating a summary score for the ratings. Both measures were designed with
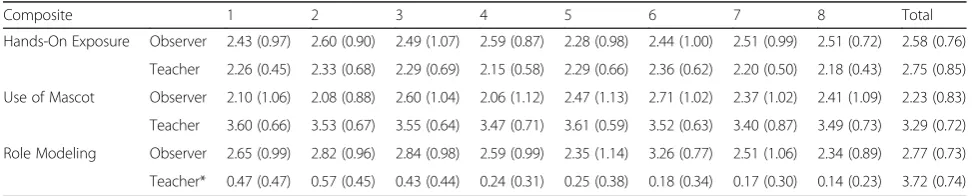
pragmatism in mind [24]. That is, we desired psychometric-ally sound measures that were feasible in the real-world set-ting. Each key component included two items to assess the quality of delivery aspect of fidelity [1]. Researchers mirrored items on the direct and indirect assessments and averaged items to create a composite variable for each component. See Table2for a comparison of the items on the direct and indir-ect measures as well as how fidelity ratings were defined for trained observers. Table 3 provides means and standard deviations for each component by observer.
Direct assessment
On a monthly basis, trained observers completed a direct observation of a food experience to assess fidelity. Investi-gators developed the direct assessment with input from multiple project researchers and refined the assessment through initial pilot testing. This assessment is a one-page, 26-item document completed with pencil and paper. Prior to data collection, observers completed a standardized training consisting of an in-person session with instruc-tion on (a) the intent of each item with provision of exam-ples, (b) distinguishing between fidelity ratings, and (c)
discrete integration into the classroom setting.
Gold-standard observers conducted these trainings. Gold standard observers were two PIs and one RA with greater than 90% inter-rater reliability. After introduction to the forms and instructions, observers coded a video example with the guidance of a gold-standard observer. Next, ob-servers in training coded a second video independently. Thereafter, observers completed pilot field observations with a gold-standard observer. Staff calculated interrater reliability by determining the percentage of items on which observers rated within a narrow margin of error (± 1 on the same end of the rating scale) relative to the gold-standard observer. Before observing classrooms inde-pendently, each observer was required to exhibit interrater reliability of 85% with a gold-standard observer on 2 occa-sions. Observers were assessed for training drift near the mid-point of the intervention year; all remained within standards for interrater agreement. Training is typically between 3 and 4 h. Observers (N= 14) included under-graduate students of sociology and child development, graduate-level students in nutrition and psychology, and professionals from education and public health.
Table 1WISE implementation strategies
Strategy Definition Actors Action Temporality Dose Justification Make training
dynamic
Training was based on maximizing interactive opportunities & reflected adult learning principles
WISE staff
One-time workshop
1–2 weeks before start of school in the fall
6 h Typical training length for new ECE program, addressed all core components
Remind /Distribute educational materials
Electronic newsletter delivered to each center director to distribute to staff
WISE staff
Bi-monthly newsletter
Approximately every 2 months
Indirect assessment
Educators self-reported their use of the key components on a 4-point scale (1 = Not at All, 4 = Very Much) on a one-page, paper and pencil, 27-item survey. As is typical for indirect assessments [6], educators did not receive the detailed training that observers received on the meaning and use of the response rating scale. The re-search team asked educators to complete a self-report fi-delity assessment on a weekly basis. Thus, a maximum of 32 self-report fidelity forms per teacher were possible. Compliance with this request was variable. Educators who provided at least one assessment per month re-ceived a fidelity score for the month. Educators ranged in submitting fidelity forms; some only submitted for two months while others had at least one submission for all eight months (mean(M) = 5.65, standard devia-tion(SD) = 1.99). To create comparable scores across this range of compliance, a monthly average self-report score was created. The variability in completed number of as-sessments suggests varying acceptability of the indirect assessment between teachers.
Data analyses
All data were analyzed using SPSS (Statistical Package for the Social Sciences) Version 22 [45]. First, we plotted the means for each of the composite and item variables across all 8 units for both direct and indirect assessment. These mean plots allow for visual examination of the
difference between direct and indirect ratings, on aver-age. Next, we ran correlations between direct and indir-ect measures for each composite and item variable for each of the 8 units. Correlations represent how well a score for an individual on the indirect measure would correspond to a score on the corresponding item/com-posite on for the direct measure. Finally, we used scat-terplots to illustrate how scores on the direct measure (x-axis) were reflected on scores on the indirect measure (y-axis) for individual cases for each of the composite and item variables across all 8 units. This yielded 9 mean plots, 72 correlations, and 72 scatterplots. The results presented highlight examples of the unique information provided by each type of statistical tool.
Results Means
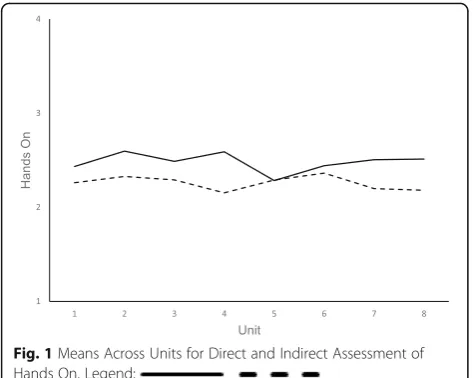
Figure1 presents the mean plot for Hands On Exposure; and Fig.2 presents the mean plot for Use of Mascot.For all fidelity components, means on the indirect measures were higher (i.e., indicating greater fidelity) than means on the direct measures. The only exception was for the Hands On Exposure fidelity component at one time point (unit 6, See Fig.1). Fig.1 demonstrates small differences between the means of direct and indirect assessment of fi-delity. The distance between means was small and stable across the school year/unit. Figure2demonstrates notice-able gaps between direct and indirect assessments but Table 2Fidelity items and definitions by component
Component Item text on direct observation form Item text on indirect form Fidelity defined Use of
Mascot
- Uses Windy WISE in activity
- Leads the class in the“Whooo tried it?” chant
- Windy Wise visited during or after our lesson.
- I felt confident using Windy Wise.
1–No mention or sight of mascot 2–Mentions but does not use 3–1-2 uses of mascot, present during
chant
4–Mascot is integral, used enthusiastically
Role modeling
- Eats the target food.
- Makes positive comments about the target food.
- I made positive comments about the food
- I tried the food.
1–Does not eat/comment
2–Tried with few groups, 1 comment 3–Tried with most groups, 2 to 3 comments 4–Tried with all groups, 4 + comments
Hands-on exposure
- Completes activity in prescribed group size.
- Involves children in lesson prescribed.
- I did the lesson with groups of 3 to 6 children at a time.
- The children participated in this lesson.
1–Whole group, Teacher led 2–Half class, Few children have role 3–Groups of 7–10, Several children
have role
4–Groups of 4–6, All children have role
Table 3Means and standard deviations by source, unit and component
Composite 1 2 3 4 5 6 7 8 Total
Hands-On Exposure Observer 2.43 (0.97) 2.60 (0.90) 2.49 (1.07) 2.59 (0.87) 2.28 (0.98) 2.44 (1.00) 2.51 (0.99) 2.51 (0.72) 2.58 (0.76)
Teacher 2.26 (0.45) 2.33 (0.68) 2.29 (0.69) 2.15 (0.58) 2.29 (0.66) 2.36 (0.62) 2.20 (0.50) 2.18 (0.43) 2.75 (0.85)
Use of Mascot Observer 2.10 (1.06) 2.08 (0.88) 2.60 (1.04) 2.06 (1.12) 2.47 (1.13) 2.71 (1.02) 2.37 (1.02) 2.41 (1.09) 2.23 (0.83)
Teacher 3.60 (0.66) 3.53 (0.67) 3.55 (0.64) 3.47 (0.71) 3.61 (0.59) 3.52 (0.63) 3.40 (0.87) 3.49 (0.73) 3.29 (0.72)
Role Modeling Observer 2.65 (0.99) 2.82 (0.96) 2.84 (0.98) 2.59 (0.99) 2.35 (1.14) 3.26 (0.77) 2.51 (1.06) 2.34 (0.89) 2.77 (0.73)
Teacher* 0.47 (0.47) 0.57 (0.45) 0.43 (0.44) 0.24 (0.31) 0.25 (0.38) 0.18 (0.34) 0.17 (0.30) 0.14 (0.23) 3.72 (0.74)
corresponding dips and peaks in the fidelity reported by each source. The distance between the means decreased across the school year for Use of the Mascot. No means were statistically different.
Correlations
Correlations between direct and indirect assessment of the Role Modeling composite ranged from a minimum of 0.03 (p= 0.87) for unit 7 to a maximum of 0.54 (p= 0.001) at unit 5 (See Table 4). Correlations for Use of Mascot composite ranged between −0.29 (p= 0.12) for unit 3 and 0.48 (p= 0.02) for unit 8. For 2 of 8 units, negative correlations were observed for Use of Mascot; 4 of 8 correlations were significant. Hands On correlations ranged between −0.51 at unit 8 (p= 0.01) and 0.09 at unit 7 (p= 0.68) for the composite variable. The correla-tions were negative for 7 of 8 units and significant for one unit for Hands On. Thus, although the means
appear closer for the Hands On component, correlations between the direct and indirect measures are weaker or more prone to negative direction than for Use of Mascot which had greater differences between the means.
Scatterplots
Figure3represents the scatterplot for the item of Use of Mascot for unit 1. The corresponding correlation is 0.46 (p= 0.02). The mean for the direct assessment was 2.19 (SD = 1.11); the mean for the indirect assessment was 3.61 (SD = .65). Figure 4represents the same scatterplot for unit 8 [Mdirect= 2.25 (SD = 0.97),Mindirect= 3.46 (SD
= 0.76); r= 0.37, p= 0.06]. These plots illustrate positive correlations.
The quadrants of the plots represent distinct scenarios. The lower left and upper right quadrants represent con-sensus between the direct and indirect assessments with those in the lower left agreeing that fidelity is below the mean and those in the upper right agreeing that fidelity is above the mean. The lower right quadrant would re-flect cases for which the direct assessment indicated greater fidelity than the indirect self-report measure. The upper left quadrant reflects cases for which the in-direct measure indicated higher fidelity than the in-direct observational measure.
The plots for using Windy at Time 1 and Time 8 (Figs.3 and4, respectively) illustrate that direct and indirect assess-ments had several cases that did improve in their fidelity across the school year (i.e., move to upper right quadrant). There were also several individuals with a continued gap in the accuracy of their reporting on their fidelity across the school year (i.e., did not move to lower leftor upper right quadrant). However, examination of the means would sug-gest that the two measures grew closer across the year even though the correlation between the measures decreased.
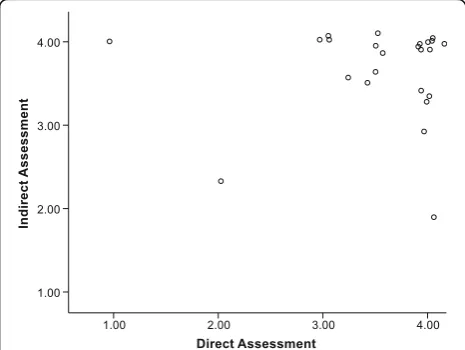
Figure5[Mdirect= 2.88 (SD = 1.11);Mindirect= 3.85 (SD
= 0.28),r=−0.25,p= 0.21] and Fig.6[Mdirect= 3.55 (SD
= 0.73); Mindirect= 3.66 (SD = 0.56), r= 0.06, p= 0.78]
represent the scatterplots for the item indicating appro-priate participation by children at unit 1 and 8, respect-ively (i.e., one item from the Hands On Exposure component). These plots illustrate the case distribution for a negative correlation (unit 1) and near zero correl-ation (unit 8) between direct and indirect assessments. At unit 8, the means were closer than at time 1 even though the correlation decreased. The unit 8 plot also il-lustrates how achieving greater levels of consistent, high fidelity reports across sources (i.e., more cases in upper right quadrant) would result in a near zero correlation between the direct and indirect measures. The shift in cases from the upper left quadrant to the upper right quadrant across the year suggest a true improvement in fidelity which might be attributed to a greater focus of this topic in the newsletters. One case continued to over
Fig. 1Means Across Units for Direct and Indirect Assessment of
Hands On. Legend:
1 2 3 4
1 2 3 4 5 6 7 8
Use of
Mascot
Unit
Fig. 2Means Across Units for Direct and Indirect Assessment of Use
report at unit 8, which could affect the correlation be-tween measures.
Discussion
This case study compares direct and indirect assess-ments of fidelity to a complex intervention for nutrition promotion in educational settings. Our findings illustrate that, on average, observed and self-reports may seem consistent despite weak correlations and individual cases of extreme over reporting by those implementing the intervention. These real world data provide an example to help ground future decisions about the “who, what, and when”of fidelity measurements as well as how these data can be analyzed. Few guidelines are available for community-based interventions in making decisions about fidelity measurement. Improvements in standards for fidelity measurement may contribute to reduced numbers of “Type III errors” in which interventions are deemed ineffective due to poor implementation rather than a true ability to produce the desired effect [46].
Consistency in comparisons between direct and indir-ect assessments in our study differed by the component of fidelity assessed and the time of the school year/inter-vention. On average, educators in our study reported higher scores than did observers, consistent with the finding that there were cases in the upper left quadrant of scatterplots more often than in the bottom right. This
is consistent with previous observation that indirect as-sessments are prone to self-report bias [6]. In our study, evidence of possible self-report bias was more prevalent (as indicated by cases in the upper left of scatterplots) for some practices than others. Differences in results suggests that self-report bias may be content dependent, reflecting not only a desire to represent oneself well but also a true gap in understanding of how the evidence should be enacted. This is consistent with mental health research in which therapists more accurately reported on use of some techniques than others [14, 15]. In our study, educators made greater shifts toward consistency with observer reports across the school year when there was less subjectivity involved in the ratings (e.g., number of children in group vs. used the puppet enthusiastic-ally). Future research should systematically document traits of evidence-based practices across disciplines on which implementers are better able to rate themselves than others (e.g., concrete versus abstract).
Our case study illustrates frequent collection of both direct and indirect assessments of fidelity across study classrooms. This approach provides a unique opportun-ity compared to other nutrition intervention studies that typically select a sub-sample of implementers to be assessed at varying intervals (e.g., one lesson per school, three lessons per term per school, 50% of classrooms
observed), often using either direct or indirect
Table 4Correlations between observer and teacher composites by unit
Unit
1 2 3 4 5 6 7 8
Composite Hands On −0.24 −0.11 −0.07 −0.36 −0.02 0.09 −0.23 −0.51*
Use of Mascot 0.4 0.46* −0.29* 0.18 0.24 −0.08 0.44* 0.48*
Role Model 0.16 0.08 0.43 0.21 0.54* 0.25 0.03 0.23
*p< .05
Fig. 3Scatterplot of direct and indirect assessments for use of
mascot unit 1
Fig. 4Scatterplot of direct and indirect assessments for use of
assessment [16, 17, 20, 47]. In our study, both types of fidelity assessment occurred with every unit of the WISE intervention, which coincided, with every month of the school year. On average, educators demonstrated in-creases in fidelity for some components across time (i.e., involving children as prescribed in hands on activities), decreases to some components across time (i.e., role modeling), and variability likely due to the content of the unit (i.e., higher observed role modeling for berries, less for greens and green beans). In our study, the inter-vention content was confounded with time of year. Therefore, patterns may reflect calendar effects such as fatigue as the school year draws to the end (e.g., Role Modeling) or distractions from other demands around the time of the holidays (e.g., drop in Mascot Use in De-cember). Researchers cannot assume that improvements due to practice effects are uniform or that a single
ob-served measure of fidelity provides an accurate
assessment of the entire intervention period. Decisions about the timing and frequency of fidelity assessment may benefit from aligning resources with the nature of the intervention itself. Researchers should consider con-tent shifts in the intervention (e.g., fruit/vegetable change in WISE) or contextual seasonality effects (e.g., school year) as key variables to inform the measurement schedule. Infrequent or one-time assessment of fidelity may mask the true relations between direct and indirect assessments for some interventions.
This study intentionally illustrated the application of simple analytic techniques that other research teams or leaders in the community (e.g., administrators at schools and hospitals) could use throughout an implementation study with a low burden. Findings illustrate that the type of analysis used to compare direct and indirect assess-ments can lead to different conclusions. In our data, the means of direct and indirect assessments were closest for the component of Hands On exposure even though correlations were often weak and negative. Additionally, the means for Mascot Use appeared to be tracking to-gether, capturing similar peaks and valleys in fidelity across time despite the gap between the overall means. Examination of scatterplots suggested a more problem-atic relationship for several individual cases. Thus, inter-pretation of means and correlations may lead to conclusions that are not true for individuals. Researchers can also appropriately consider this issue by using mixed level models that account for assessments nested in time within the individual and the individual nested within the site [13], although this approach may be less prag-matic for monitoring throughout implementation.
Collecting both direct and indirect assessments of fi-delity at key intervention points may be useful to inform implementation strategies. For example, audit and feed-back is an evaluation of performance for a set period of time that is given to an implementer verbally, on paper, or electronically [24]. The provision of audit and feed-back would differ for a case in the bottom left quadrant (low fidelity by indirect and direct assessment) who is aware he/she is not enacting the practice and an individ-ual in the upper left (high indirect fidelity and low direct fidelity) who is reporting he/she is using the practice when observers report otherwise. Cases in the bottom left may not believe the evidence works or may not be motivated to enact the practice. Cases in the upper left may have a misunderstanding about the meaning of the practice or lack the skill to use it. Providing differential feedback to educators in these two scenarios could result in greater shifts to the upper right quadrant. If resources are limited, interventions could collect direct and indir-ect assessments only until cases are consistently in the upper right quadrant. The joint measurement and com-parison of direct and indirect fidelity assessment is a
Fig. 5Scatterplot of direct and indirect assessments for child
participation unit 1
Fig. 6Scatterplot of direct and indirect assessments for child
promising application for improving feedback to imple-menters given previous research showing that fidelity monitoring supports staff retention when used as part of a supportive consultation process [48]. In mental health interventions, practitioners have reported that feedback on their fidelity is helpful to support their learning and practice [48]. Improving the nuance of this feedback through comparison of direct and indirect assessment may prove even more useful.
The present study has both limitations and strengths. First, the resource-intensive nature of direct fidelity as-sessment limited the size and diversity of our sample to communities in only two locations. This limitation is likely to affect other studies as well [6], and a balance between study size and rigor of evaluation must be considered. Fur-ther, as with most fidelity studies, we developed the fidelity measures to reflect the target intervention. This meant that full validation was neither feasible nor possible. For assessing Use of Mascot, item content was not an exact match between the direct and indirect observations. Fur-ther, teachers did not receive separate training in use of the fidelity instrument, as did the observers. However, the establishment of interrater reliability for the observed measure and adherence to existing guidelines for fidelity measurement development [6] provide support for the value ofour approach. Future work should consider what aspects of fidelity can be standardized to apply across di-verse contexts and interventions. Finally, we did not de-sign this study to capture adaptations to the intervention, conceiving of all departures from our definition of fidelity as equally detrimental and failing to document any poten-tially appropriate shifts. We made this decision because we conceived of targets of fidelity monitoring in our study as the active ingredients necessary for influencing change. However, Wiltsey-Stirman and colleagues have identified a range of potential adaptations applicable to complex be-havioral interventions (e.g., shortening, adding, repeating) and documented that adaptations to psychotherapies were not detrimental in a review of existing studies [49]. Em-bedding measures to codify adaptations is important for a holistic understanding of how an intervention is imple-mented [50–52]. Future researchers should consider in-cluding measures of adaptation into evaluation plans.
A number of strengths balance these limitations. The re-search team collected fidelity frequently in all classrooms, a primary strength of the study. The availability of both direct and indirect assessments across the year allowed us to make comparisons at multiple points in time and across all units of the intervention. In addition, the re-search team designed the fidelity tool to be brief, simple, and specific to the core evidence-based components of WISE. We sought to employ a pragmatic approach which is key to minimizing burden on the implementers and encouraging fidelity monitoring as a routine process [48].
Although use of the tool was variable, teachers did not voice concerns about the one-page assessment.
Researchers have many opportunities for future re-search in fidelity assessment. When making connections between fidelity and health outcomes, it is unclear if an aggregate measure should be used or if multiple indica-tors of fidelity across time would be more appropriate for inclusion in statistical models (i.e., an early, middle, and late fidelity score). Resource limitations may prevent multiple measures of fidelity in which case researchers lack guidance on when to time the assessment [53] or model variability in its distance from measurement of the outcomes. Currently, Beidas and colleagues [54] are conducting a randomized control trial to compare the costs and accuracy of three approaches to self-report fidelity measurement (i.e., behavioral rehearsal, chart-stimulated recall, and self-report) in cognitive behavior therapy interventions. Future studies will need to deter-mine if these findings replicate to other content areas in which the implementers and interventions have different characteristics. For example, future research could com-pare direct and indirect measures after more rigorous training of the implementers on self-assessment or after an initial coaching session comparing an indirect to dir-ect assessment. In our work with WISE specifically, we will seek to determine a minimum level of fidelity that corresponds to significant impacts on various child out-comes. Similarly, we will determine how differently timed fidelity measurements relate to outcomes. Finally, considerations of fidelity measurement source and tim-ing will be important for future studies which seek to test associations between implementation strategies and shifts in fidelity to core components. For example, meas-urement of fidelity relative to delivery and use of imple-mentation supports (e.g., newsletters in this study) may provide insight into impact of implementations strat-egies in particular contexts. Further, quality fidelity mea-sures of both the innovation and the implementation intervention will be essential to tease out which strat-egies contribute to improved implementation [55].
Conclusions
may be sensitive to different intervals of the intervention itself.
Abbreviations
ECE:Early childhood educator; FV: Fruits and vegetables; M: Mean; PI: Principal investigator; RA: Research assistant; SD: Standard deviation; SPSS: Statistical package for the social sciences; WISE: We inspire smart eating
Acknowledgements
We would like to acknowledge our Head Start partners who allowed us to be in their classrooms on a frequent basis for the collection of these data. We also acknowledge Geerish Sadasivan for his assistance with formatting the manuscript.
Funding
This project was supported by Agriculture and Food Research Initiative Competitive Grant no. 2011–68001-30014 from the USDA National Institute of Food and Agriculture (T.S. & L.WM.). This project was also supported by NIH K01 DK110141–02 (T.S.), and the Arkansas Biosciences Institute (T.S) and the Lincoln Health Foundation (J.M.R and T.S.). The content is solely the responsibility of the authors and does not necessarily represent the official views of the funding agencies. NIH K01 DK110141, Arkansas Biosciences Institute, Lincoln Health Foundation.
Availability of data and materials
The datasets used and/or analyzed during the current study will be available from the corresponding author on reasonable request.
Authors’contributions
TS led the conception and design of this study, contributing to obtaining funding, contributed to data analysis and interpretation, and drafted this manuscript; JPS lead data analyses and interpretation; JMR contributed to obtaining funding, collecting data, interpreting analyses, and editing the manuscript; LWM obtained funding for this study, contributed to the design of this study, and edited this manuscript; GC contributed to the conception and design of the study and edited this manuscript. All authors read and approved the final manuscript.
Ethics approval and consent to participate
This protocol was approved by the UAMS Institutional Review Board (IRB 134665). We conducted this study in accordance with all applicable government regulations and University of Arkansas for Medical Sciences research policies and procedures. Consent was collected from all participating educators.
Consent for publication
Not applicable.
Competing interests
Dr. Leanne Whiteside-Mansell, Dr. Taren Swindle, and UAMS have a financial interest in the technology (WISE) discussed in this presentation/publication. These financial interests have been reviewed and approved in accordance with the UAMS conflict of interest policies.
Publisher’s Note
Springer Nature remains neutral with regard to jurisdictional claims in published maps and institutional affiliations.
Author details
1
Department of Family and Preventive Medicine, University of Arkansas for Medical Sciences, 4301 W. Markham St, #530, Little Rock, AR 72205-7199, USA.2College of Public Health, University of Arkansas for Medical Sciences,
220 UAMS Campus Dr, #781, Little Rock, AR 72205, USA.3College of Applied
and Natural Sciences, Louisiana Tech University, 305 Wisteria St, #3167, Ruston, LA 71272, USA.4Department of Pharmacy Practice and Psychiatry,
University of Arkansas for Medical Sciences, 4301 W. Markham St, #522-4, Little Rock, AR 72205-7199, USA.
Received: 21 December 2017 Accepted: 20 June 2018
References
1. Proctor E, Silmere H, Raghavan R, Hovmand P, Aarons G, Bunger A, et al. Outcomes for implementation research: conceptual distinctions, measurement challenges, and research agenda. Adm Policy Ment Heal Ment Heal Serv Res. 2011;38:65–76.
2. Dane AV, Schneider BH. Program integrity in primary and early secondary prevention: are implementation effects out of control? Clin Psychol Rev. 1998;18:23–45.
3. van NF, Singh A. Implementation evaluation of school-based obesity prevention programmes in youth; how, what and why? Heal Nutr. 2015; 18(9):1531.
4. Durlak JA, DuPre EP. Implementation matters: a review of research on the influence of implementation on program outcomes and the factors affecting implementation. Am J Community Psychol. 2008;41:327–50. 5. Horner S, Rew L, Torres R. Enhancing intervention fidelity: a means of
strengthening study impact. J Spec Pediatr. 2006;11(2):80–9.
6. Schoenwald SK, Garland AF, Chapman JE, Frazier SL, Sheidow AJ, Southam-Gerow MA. Toward the effective and efficient measurement of
implementation fidelity. Adm Policy Ment Heal Ment Heal Serv Res. 2011;38: 32–43.
7. Glasgow RE, Riley WT. Pragmatic Measures. Am J Prev Med. 2013;45:237–43. 8. Aarons GA, Green AE, Palinkas LA, Self-Brown S, Whitaker DJ, Lutzker JR, et
al. Dynamic adaptation process to implement an evidence-based child maltreatment intervention. Implement Sci. 2012;7:32.
9. Breitenstein S, Robbins L, Cowell JM. Attention to Fidelity. J Sch Nurs. 2012; 28:407–8.
10. Walton H, Spector A, Tombor I, Michie S. Measures of fidelity of delivery of, and engagement with, complex, face-to-face health behaviour change interventions: a systematic review of measure quality. Br J Health Psychol. 2017;22(4):872–903.
11. Creed TA, Wolk CB, Feinberg B, Evans AC, Beck AT. Beyond the label: relationship between community therapists’self-report of a cognitive behavioral therapy orientation and observed skills. Adm Policy Ment Heal Ment Heal Serv Res. 2016;43:36–43.
12. Hurlburt MS, Garland AF, Nguyen K, Brookman-Frazee L. Child and family therapy process: concordance of therapist and observational perspectives. Adm Policy Ment Heal Ment Heal Serv Res. 2010;37:230–44.
13. Martino S, Ball S, Nich C, Frankforter TL, Carroll KM. Correspondence of motivational enhancement treatment integrity ratings among therapists, supervisors, and observers. Psychother Res. 2009;19:181–93.
14. Ward AM, Regan J, Chorpita BF, Starace N, Rodriguez A, Okamura K, et al. Tracking evidence based practice with youth: validity of the MATCH and standard manual consultation records. J Clin Child Adolesc Psychol. 2013;42:44–55.
15. Hogue A, Dauber S, Lichvar E, Bobek M, Henderson CE. Validity of therapist self-report ratings of fidelity to evidence-based practices for adolescent behavior problems: correspondence between therapists and observers. Admin Pol Ment Health. 2015;42:229–43.
16. Griffin TL, Pallan MJ, Clarke JL, Lancashire ER, Lyon A, Parry JM. Process evaluation design in a cluster randomised controlled childhood obesity prevention trial: the WAVES study. Int J Behav Nutr Phys Act. 2014;11 17. Reynolds K, Franklin F, Leviton L. Methods, results, and lessons learned from
process evaluation of the high 5 school-based nutrition intervention. Health Educ. 2000;27(2):177–86.
18. Sherill J. Pragmatic strategies for assessing psychotherapy. Washington: National Institutes of Mental Health.
19. Gray H, Contento I, Koch P. Linking implementation process to intervention outcomes in a middle school obesity prevention curriculum,‘choice, control and change. Health Educ Res. 2015;30(2):248–61.
20. Martens M, van Assema P, Paulussen T, Schaalma H, Brug J. Krachtvoer: process evaluation of a Dutch programme for lower vocational schools to promote healthful diet. Health Educ Res. 2006;21:695–704.
21. Bessems K, van AP. Exploring determinants of completeness of implementation and continuation of a Dutch school-based healthy diet promotion programme. Int J Heal Prom Edu. 2014;52(6):315–27. 22. Brown CH, Curran G, Palinkas LA, Aarons GA, Wells KB, Jones L, et al. An
23. Stetler CB, Legro MW, Wallace CM, Bowman C, Guihan M, Hagedorn H, et al. The role of formative evaluation in implementation research and the QUERI experience. J Gen Intern Med. 2006;21(Suppl 2):S1–8.
24. Proctor EK, Powell BJ, Mcmillen JC. Implementation strategies:
recommendations for specifying and reporting. Implement Sci. 2013;8(1):139. 25. Powell B, Waltz T, Chinman M, Damschroder L, Smith J, Matthieu M, et al. A
refined compilation of implementation strategies: results from the expert recommendations for implementing change (ERIC) project. Implement Sci. 2015;10:21.
26. Whiteside-Mansell L, Swindle TM. Together we inspire smart eating: a preschool curriculum for obesity prevention in low-income families. J Nutr Educ Behav. 2017;49(9):789–92.
27. Johnson S, Bellows L. Evaluation of a social marketing campaign targeting preschool children. Am J Health Behav. 2007;31(1):44–55.
28. Office of Head Start. 1302.31 Teaching and the learning environment. | ECLKC. Legislation and regulations: Head Start Program Performance Standards (45 CFR part 1304.23 Child Nutrition). US Department of Health and Human Services, Administration for Children and Families. 2016.https:// eclkc.ohs.acf.hhs.gov/policy/45-cfr-chap-xiii/1302-31-teaching-learning-environment.
29. Anzman-Frasca S, Savage JS, Marini ME, Fisher JO, Birch LL. Repeated exposure and associative conditioning promote preschool children’s liking of vegetables. Appetite. 2012;58:543–53.
30. Dazeley P, Houston-Price C. Exposure to foods’non-taste sensory properties. A nursery intervention to increase children’s willingness to try fruit and vegetables. Appetite. 2015;84:1–6.
31. Knai C, Pomerleau J, Lock K, McKee M. Getting children to eat more fruit and vegetables: a systematic review. Prev Med. 2006;42:85–95. 32. Wardle J, Cooke LJ, Gibson EL, Sapochnik M, Sheiham A, Lawson M.
Increasing children’s acceptance of vegetables; a randomized trial of parent-led exposure. Appetite. 2003;40:155–62.
33. Wardle J, Herrera M-L, Cooke L, Gibson EL. Modifying children’s food preferences: the effects of exposure and reward on acceptance of an unfamiliar vegetable. Eur J Clin Nutr. 2003;57:341–8.
34. Schindler JM, Corbett D, Forestell CA. Assessing the effect of food exposure on children’s identification and acceptance of fruit and vegetables. Eat Behav. 2013;14:53–6.
35. Borzekowski D, Robinson T. The 30-second effect: an experiment revealing the impact of television commercials on food preferences of preschoolers. J Am Diet Assoc. 2001;101(1):42–6.
36. Boyland E, Harrold J, Kirkham T, Halford J. Persuasive techniques used in television advertisements to market foods to UK children. Appetite. 2012;58: 658–64.
37. Kraak V, Story M. Influence of food companies’brand mascots and entertainment companies’cartoon media characters on children’s diet and health: a systematic review. Obes Rev. 2015;16(2):107–26.
38. Keller K, Kuilema L, Lee N, Yoon J, Mascaro B. The impact of food branding on children’s eating behavior and obesity. Physiol. 2012;106(3):379–86. 39. Roberto C, Baik J, Harris J, Brownell K. Influence of licensed characters on
children’s taste and snack preferences. Pediatrics. 2010;126(1):88–93. 40. Weber K, Story M, Harnack L. Internet food marketing strategies aimed at
children and adolescents: a content analysis of food and beverage brand web sites. J Am Diet Assoc. 2006;106:1463–6.
41. Benjamin Neelon SE, Briley ME. Position of the American dietetic association: benchmarks for nutrition in child care. J Am Diet Assoc. 2011; 111:607–15.
42. Gibson EL, Kreichauf S, Wildgruber A, Vögele C, Summerbell CD, Nixon C, et al. A narrative review of psychological and educational strategies applied to young children’s eating behaviours aimed at reducing obesity risk. Obes Rev. 2012;13(Suppl 1):85–95.
43. Greenhalgh J, Dowey A, Horne P, Lowe C. Positive-and negative peer modelling effects on young children’s consumption of novel blue foods. Appetite. 2009;52(3):646–53.
44. Hendy HM, Raudenbush B. Effectiveness of teacher modeling to encourage food acceptance in preschool children. Appetite. 2000;34:61–76. 45. IBM Corp. IBM SPSS Statistics for windows, version 22.0. Armonk, NY: IBM
Corp; 2013.
46. Dobson D, Cook TJ. Avoiding type III error in program evaluation. Results from a field experiment Eval Program Plann. 1980;3:269–76.
47. Saunders RP, Wilcox S, Baruth M, Dowda M. Process evaluation methods, implementation fidelity results and relationship to physical activity and
healthy eating in the faith, activity, and nutrition (FAN) study. Eval Program Plann. 2014;43:93–102.
48. Kimber M, Barac R, Barwick M. Monitoring fidelity to an evidence-based treatment: practitioner perspectives. Clin Soc Work J :1–15.
49. Ivers NM, Grimshaw JM, Jamtvedt G, Flottorp S, O’Brien MA, French SD, et al. Growing literature, stagnant science? Systematic review, meta-regression and cumulative analysis of audit and feedback interventions in health care. J Gen Intern Med. 2014;29:1534–41.
50. Stirman SW, Miller CJ, Toder K, Calloway A. Development of a framework and coding system for modifications and adaptations of evidence-based interventions. Implement Sci. 2013;8:65.
51. Castro FG, Barrera M Jr, Martinez CR Jr. The cultural adaptation of prevention interventions: resolving tensions between fidelity and fit. Prev Sci. 2004;5:41–5.
52. Chambers DA, Norton WE. The Adaptome: advancing the science of intervention adaptation. Am J Prev Med. 2016;51:S124–31.
53. Perepletchikova F, Treat TA, Kazdin AE, Dorsey S, Schoenwald SK, Mandell DS, et al. Treatment integrity in psychotherapy research: analysis of the studies and examination of the associated factors. J Consult Clin Psychol. 2007;75:829–41.
54. Beidas RS, Maclean JC, Fishman J, Dorsey S, Schoenwald SK, Mandell DS, et al. A randomized trial to identify accurate and cost-effective fidelity measurement methods for cognitive-behavioral therapy: project FACTS study protocol. BMC Psychiatry. 2016;16:323.
55. Williams N. Multilevel mechanisms of implementation strategies in mental health: integrating theory, research, and practice. Adm Policy Ment Heal Ment. 2016;43:783–98.