O R I G I N A L A R T I C L E
Open Access
Automatic segmentation and classification
of breast lesions through identification of
informative multiparametric PET/MRI
features
Wolf-Dieter Vogl
1†, Katja Pinker
2,3†, Thomas H. Helbich
2, Hubert Bickel
2, Günther Grabner
4,7, Wolfgang Bogner
4,
Stephan Gruber
4, Zsuzsanna Bago-Horvath
5, Peter Dubsky
6and Georg Langs
1*Abstract
Background:Multiparametric positron emission tomography/magnetic resonance imaging (mpPET/MRI) shows clinical potential for detection and classification of breast lesions. Yet, the contribution of features for computer-aided segmentation and diagnosis (CAD) need to be better understood. We proposed a data-driven machine learning approach for a CAD system combining dynamic contrast-enhanced (DCE)-MRI, diffusion-weighted imaging (DWI), and18F-fluorodeoxyglucose (18F-FDG)-PET.
Methods:The CAD incorporated a random forest (RF) classifier combined with mpPET/MRI intensity-based features for lesion segmentation and shape features, kinetic and spatio-temporal texture features, for lesion classification. The CAD pipeline detected and segmented suspicious regions and classified lesions as benign or malignant. The inherent feature selection method of RF and alternatively the minimum-redundancy-maximum-relevance feature ranking method were used.
Results:In 34 patients, we report a detection rate of 10/12 (83.3%) and 22/22 (100%) for benign and malignant lesions, respectively, a Dice similarity coefficient of 0.665 for segmentation, and a classification performance with an area under the curve at receiver operating characteristics analysis of 0.978, a sensitivity of 0.946, and a specificity of 0.936. Segmentation but not classification performance of DCE-MRI improved with information from DWI and FDG-PET. Feature ranking revealed that kinetic and spatio-temporal texture features had the highest contribution for lesion classification.18F-FDG-PET and morphologic features were less predictive.
Conclusion:Our CAD enables the assessment of the relevance of mpPET/MRI features on segmentation and classification accuracy. It may aid as a novel computational tool for exploring different modalities/features and their contributions for the detection and classification of breast lesions.
Keywords:Diagnosis (computer-assisted), Breast neoplasms, Magnetic resonance imaging, Machine learning, Positron-emission tomography
© The Author(s). 2019Open AccessThis article is distributed under the terms of the Creative Commons Attribution 4.0 International License (http://creativecommons.org/licenses/by/4.0/), which permits unrestricted use, distribution, and reproduction in any medium, provided you give appropriate credit to the original author(s) and the source, provide a link to the Creative Commons license, and indicate if changes were made.
* Correspondence:[email protected]
†Wolf-Dieter Vogl and Katja Pinker contributed equally to this work. 1Computational Imaging Research Laboratory, Department of Biomedical
Imaging and Image-guided Therapy, Medical University Vienna, Waehringer Guertel 18-20, 1090 Vienna, Austria
Key points
The positron emission tomography/magnetic resonance imaging (PET/MRI) computer-aided segmentation and diagnosis (CAD) system automatically detects, segments, and classifies breast lesions.
Automatic lesion segmentation was accurate and improved with information from all modalities.
A small number of features mainly from dynamic contrast-enhanced MRI achieves high classifica-tion accuracies.
The PET/MRI-CAD system allows exploring the
value of different imaging modalities and features.
Background
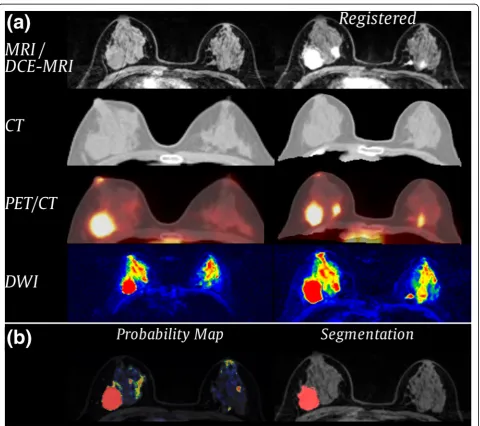
Breast cancer is the most common cancer and the second most common cause of mortality from cancer in women [1]. Early detection and precise diagnosis are important for effective treatment [2], and breast imaging plays a piv-otal role in the detection, characterisation, and staging of breast cancer. Recently, multimodal, multiparametric im-aging (mpI) including dynamic contrast-enhanced mag-netic resonance imaging (DCE-MRI), diffusion-weighted imaging (DWI), and positron emission tomography (PET) has been investigated for an improved differentiation of benign and malignant breast lesions [3]. Such imaging constitutes complex protocols but is promising for a more
comprehensive measurement of morphology (MRI), neoangiogenesis (DCE-MRI), tumour metabolism (PET), and microstructure (DWI) in cancerous and benign tissue [3] (Fig.1).
Due to the increased complexity of the information cap-tured by mpI, computational approaches that enable the quantitative assessment of multivariate measurements have been gaining relevance. Recently, computer-aided de-tection and diagnosis systems have been proposed to re-duce inter- and intra-reader variability and to aid radiologists in the detection and diagnosis of breast cancer [4]. These systems are able to analyse large amounts of imaging data in a short time, detect and visualise complex correlations and patterns, and provide objective and re-peatable measurements [5] to increase the accuracy of diagnosis [6]. Computer-aided detection (CADe) systems assist radiologists in localising suspicious regions in med-ical images, whereas computer-aided diagnosis (CADx) systems support the radiologist in the diagnosis of suspi-cious regions by providing and analysing information ex-tracted from these regions [7]. These systems show potential to be advantageous in the current clinical sce-nario [7] where despite guidelines for DCE-MRI, such as the Breast Imaging-Reporting and Data System (BI-R-ADS®) MRI lexicon [8], inter- and intra-reader variability remains an issue and the human analysis of complex rela-tionships observed in images and the underlying disease remains limited [9].
As yet, the information provided by individual imaging techniques as part of mpI remains poorly understood. To identify the diagnostically relevant parameters captured across DCE-MRI, DWI, and 18F-fluorodeoxyglucose (18F-FDG)-PET, we propose a novel automated data-driven approach: a combined breast lesion segmentation and clas-sification system for mpI data where the system automatic-ally identifies the information in the imaging data that contribute to an accurate segmentation and classification.
Methods
Patients
The data used in this retrospective analysis was acquired from an institutional review board-approved prospective, single-institution study [25]. All patients gave written in-formed consent. At the time of the prospective study, only prototypic PET/MRI scanners were in existence and these were not available at the study centre. Thus, 46 patients were included in this prospective study in which MRI and a combined computed tomography (CT)/18F-FDG-PET were acquired. All tumours were histopathologically verified. In our retrospective analysis, the CT image was used only as morphologic information for the registration and was purposely not part of seg-mentation and classification. After applying our auto-matic CT to MRI registration method, as described below, twelve patients had to be removed from analysis due to registration errors. All excluded cases were pa-tients with large breasts that were considerably com-pressed, or deformed, in one of the modalities during image acquisition. Misalignments were detected visually by overlaying MRI and CT images. From the remaining 34 patients, 12 had benign lesions and 22 had malignant lesions (2 patients had multifocal or multicentric can-cer). Characteristics of the lesions are listed in Table1.
Image acquisition
Patients underwent 3T MRI (Tim Trio, Siemens, Er-langen, Germany) in prone position using a four-channel
breast coil (InVivo, Orlando, FL, USA) and a combined whole-body PET/CT in-line system (Biograph 64 True-Point®; Siemens, Erlangen, Germany) in prone position.
For DCE-MRI a split dynamics protocol that combined high-spatial and high-temporal resolution was used [11]. First, a high spatial resolution, pre-contrast coronal T1-weighted turbo three-dimensional fast low angle shot (FLASH) sequence with water-excitation and fat-suppres-sion was acquired with matrix 320 × 320 × 120 and 1-mm isotropic voxel (DCE-MRI pre-contrast imaging, Idce-pre).
Subsequently, a DCE coronal T1-weighted volumetric in-terpolated breath-hold-examination (VIBE) sequence with 17 acquisitions (13.2 s per acquisition) was acquired with matrix 192 × 192 × 72 mm and 1.7-mm isotropic voxel (DCE-MRI,Idce). Seventy-five seconds after the beginning
of the sequence, gadoterate meglumine (Gd-DOTA, Dotarem®, Guerbet, Paris, France) was injected as a bolus at a dose of 0.1 mmol/kg at a rate of 4 mL/s and followed by a 20-mL saline flush at the same injection rate. Then, a FLASH sequence was acquired to capture the peak en-hancement of lesions (DCE-MRI peak-contrast imaging, Idce-peak), followed by a VIBE sequence with the same
pa-rameters above described. Finally, a FLASH sequence with the same parameters above described was acquired (DCE-MRI post-contrast imaging, Idce-post) to depict
de-layed enhancement lesion morphology. DWI sequences were acquired in the same session, withbvalues of 50 and 850 s/mm2, resulting into two datasets, Idwi b0 and Idwi b850, as well as the derived apparent diffusion coefficient
(ADC) mapping, Iadc [12] (matrix 172 × 86 × 24, pixel
2.09 × 2.09 mm, slice thickness 5.5 mm). 18F-FDG-PET (matrix 168 × 168 × 74, pixel 4 × 4 mm, slice thickness 3 mm) and CT images (matrix 512 × 512 × 74, pixel 1.37 × 1.37 mm, slice thickness 3 mm) of the thorax were ac-quired in a hybrid PET/CT scanner and were aligned by the scanner software.
CAD pipeline
We developed a novel automated data-driven combined CADx system for mpI data with MRI and PET. The system enabled automatic detection and segmentation of poten-tially cancerous regions and classified lesions as benign or malignant. The algorithm first aligned multimodal breast imaging data from DCE-MRI, DWI, and 18F-FDG PET non-rigidly, and segmented the breast. Then, the system ex-tracted local textural, kinetic, and intensity-based image features from the fused information and detected and clas-sified lesions using a random forest (RF) classifier [10]. Fig-ure2shows the overview of the proposed CAD pipeline.
Alignment
To collect information at individual positions across mo-dalities, all images were aligned to Idce-pre serving as
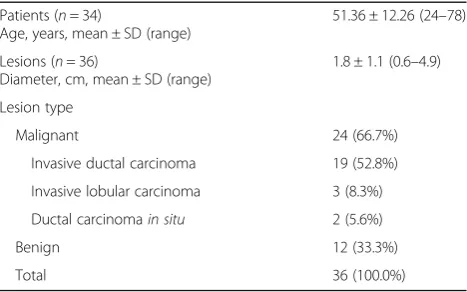
Table 1Patient and breast lesion characteristics
Patients (n= 34)
Age, years, mean ± SD (range)
51.36 ± 12.26 (24–78)
Lesions (n= 36)
Diameter, cm, mean ± SD (range)
1.8 ± 1.1 (0.6–4.9)
Lesion type
Malignant 24 (66.7%)
Invasive ductal carcinoma 19 (52.8%)
Invasive lobular carcinoma 3 (8.3%)
Ductal carcinomain situ 2 (5.6%)
Benign 12 (33.3%)
Total 36 (100.0%)
Fig. 3Results of the (a) registration and (b) segmentation process for one patient.aFirst row: Reference Idce-preand registered Idce-post. Second row: Ictunregistered/registered. Third row: Ipetimage unregistered/registered, fused with the corresponding CT image. Fourth row: Idwi b0 unregistered/registered.bProbability map obtained from voxel-wise classification overlaid on the MR pre-contrast image (left) and final segmentation after applying a threshold and post-processing (right)
reference coordinate system. Images were registered with the software package Advanced Normalisation Tools (ANTs) [13] using an affine transformation with mutual information as the similarity metric, followed by a non-rigid deformation with symmetric normalisation (SyN) [13] and windowed normalised cross-correlation as a similarity metric (Fig. 3a). As Ipet does not provide
morphologic information, we registered the correspond-ing CT image to Idce-pre [14] and subsequently applied
the obtained transformation onIpet.
Lesion segmentation
We treated lesion segmentation as a voxel-wise classifi-cation problem, where a machine learning algorithm assigned a binary label 1 (lesion) or 0 (non-lesion) to each voxel based on imaging features extracted at that location. As ground truth for training and validation, we used manual expert radiologist (with 3 years of experi-ence) annotations performed on the registered Idce-peak
orIdce-post, depending on where the lesion borders were
better visible. Annotations were validated by a second expert radiologist with 9 years of experience.
All computations were restricted to the breast area, which was segmented using an intensity-based growing region algorithm [15]. All MRI intensity values were standardised to zero mean and unit standard-deviation estimated from the breast area on the pre-contrast im-ages, Idce-pre and Idce. We computed intensity features
from all imaging data, from changes of the contrast over time and the summed up contrast in the DCE-MRI se-quence as specified in Table2.
An RF classifier model was trained on features ex-tracted from 1000 randomly selected samples per class and patient. The trained model was then used to predict the segmentation label for a new patient who was not part of the training data set for each
voxel x of the breast based on the computed features (Fig. 3b).
Lesion classification
After segmentation, the lesion was classified as either benign or malignant based on features extracted per le-sion. Intensity-based, kinetic, morphological, and tex-tural features were considered to train a lesion class prediction model, and the obtained model was used to predict malignancy for lesions in the new patient who was not part of the training data set.
Intensity-based features were calculated from DCE-MRI, DWI ADC, and the 18F-FDG-PET map. We tackled the lesion inhomogeneities in the contrast enhancement of DCE-MRI by the method described by Chen et al. [16], where the signal-to-time curves within a lesion were clustered by the fuzzy c-means algorithm and the curve with highest contrast en-hancement rate, the characteristic kinetic curve, was chosen for classification. We used the 25 time points beginning with contrast enhancement (flckc) and the
change over time (flδckc) calculated by forward
differ-ence (four frames) as intensity features. Analogously, Iadc and Ipet intensities were partitioned into five
clus-ters and the cluster centre with the lowest ADC value and the highest 18F-FDG uptake were used as features fl-adc and fl-pet.
To capture contrast enhancement kinetics, we fitted an asymmetric generalised logistic function as regression function multiplied with an exponential term to the characteristic kinetic curve:
C t;G;α;τ;t1=2;β;k¼G 1− 1 1þð2α−1Þ exp1
τt−t1=2
1=α
!
expβtk
whereGdefines the scaling,αthe asymmetry parameter,
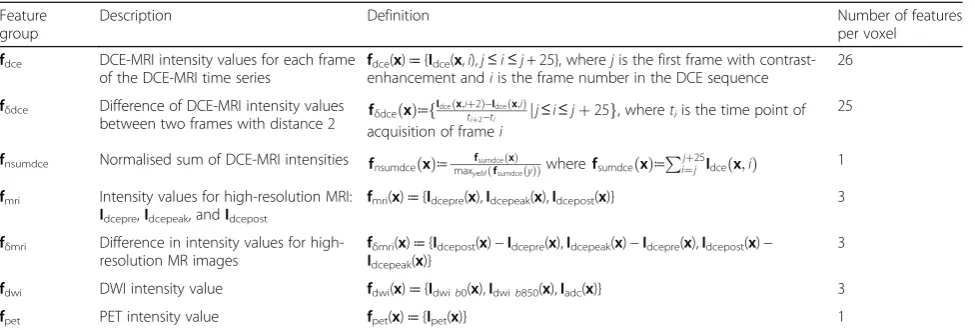
Table 2Features extracted for each voxel (x) within the breast (M)
Feature group
Description Definition Number of features
per voxel
fdce DCE-MRI intensity values for each frame of the DCE-MRI time series
fdce(x)≔{Idce(x,i),j≤i≤j+ 25}, wherejis the first frame with contrast-enhancement andiis the frame number in the DCE sequence
26
fδdce Difference of DCE-MRI intensity values
between two frames with distance 2 fδdceðxÞ≔f
Idceðx;iþ2Þ−Idceðx;iÞ
tiþ2−ti jj≤i≤jþ25g, wheretiis the time point of acquisition of framei
25
fnsumdce Normalised sum of DCE-MRI intensities fnsumdceðxÞ≔ fsumdceðxÞ
maxy∈MðfsumdceðyÞÞwherefsumdceðxÞ≔ Pjþ25
i¼j Idceðx;iÞ 1 fmri Intensity values for high-resolution MRI:
Idcepre,Idcepeak, andIdcepost
fmri(x)≔{Idcepre(x),Idcepeak(x),Idcepost(x)} 3
fδmri Difference in intensity values for high-resolution MR images
fδmri(x)≔{Idcepost(x)−Idcepre(x),Idcepeak(x)−Idcepre(x),Idcepost(x)− Idcepeak(x)}
3
fdwi DWI intensity value fdwi(x)≔{Idwib0(x),Idwib850(x),Iadc(x)} 3
fpet PET intensity value fpet(x)≔{Ipet(x)} 1
τ the steepness, and t1/2 the time of half maximum of
the sigmoid function; kdefines the terminal slope and β
scaling factor of the exponential term (Additional file1:
Figure S1). We used the parametersα,τ,β, andkas
fea-tures (flkinetic). In addition, we computed summary
mea-sures of the curve within a 7-min interval, beginning at start of contrast enhancement: area under the curve
(AuC), maximum enhancement (Cmax), time to
max-imum enhancement (Tmax), time to half maximum
en-hancement (T1/2), and maximum analytical derivative δδCt
of the regression functionC(t)(MDER).
To obtain textural features,fl-texture,we used a
volumet-ric texture analysis approach based on grey-level co-occurrence matrix (GLCM) and Haralick texture fea-tures [17, 18]. We computed the GLCM with 128 Gy-va-lue bins and 26 neighbours within the lesion and used its 13 s-order statistics [17]. fl-tex-pre, fl-tex-peak, and fl-tex-post
contained the Haralick features obtained from theIdce-pre, Idce-peak, andIdce-postintensity values, respectively.
In addition to the spatial texture analysis, we used a novel temporal texture analysis inspired by the works of Agner et al. [19] and Woods et al. [20]. With this analysis, we characterised the temporal properties of contrast up-take within a lesion,e.g., homogeneity of contrast uptake. To compute the GLCMs, we considered voxel pairs at the same spatial positionxbut at different time points in the contrast enhancement. We computed the Haralick fea-tures from pixel pairs from (Idce-pre, Idce-peak), (Idce-pre, Idce-post), and (Idce-peak, Idce-post), resulting in the feature
vectorsfl-tex-peak/pre,fl-tex-post/pre, andfl-tex-post/peak.
To obtain morphological feature candidates, flmorph,
we used shape descriptors, as utilised previously in the literature [19, 21, 22]. Definitions of the shape descrip-tors are given in Additional file1: Table S1.
Evaluation of lesion segmentation and classification
To evaluate lesion segmentation, we performed experi-ments in a leave-one-out cross-validation (LOOCV) fashion, training the segmentation algorithm and feature rankings on all but one example, and applying it to the remaining example not included in the training. The quality of the segmentation was measured on a pixel level by comparing the predicted segmentation with the manually annotated data using Dice similarity coefficient (DSC) [23] as a similarity measure and sensitivity (true-positive rate) describing the probability of detection. As RF provide probabilities, we determined the RF thresh-old as the one that maximises DSC on the training set. Overall performance was obtained by computing the mean of all test DSC scores.
To evaluate lesion classification, we classified lesions into the two classes: benign and malignant. Evaluation was performed in an LOOCV fashion for both ranking the features and determining accuracy. Accuracy was
reported as receiver operating characteristic (ROC) area under the curve (AUC) and sensitivity/specificity. The RF threshold was chosen within the training set as the one maximising the F1 score, which is the harmonic
mean of precision and sensitivity. All experiments were repeated 20 times, and averages for AUC and sensitivity/ specificity are reported. To study the impact of segmen-tation accuracy on classification, we performed classifi-cation on both manually delineated lesions and automatically segmented lesions.
In a post-processing step, false-positive blobs were re-moved by computing connected-components from the segmentations using a six-neighbourhood, and only blobs that partially overlapped with the manual annotation were selected. This step mimics the manual selection of a suspi-cious region that a radiologist wants to investigate further. For the two benign cases where the lesion was not de-tected, manual segmentation was used instead of the auto-matic segmentation. This post-processing step allowed us to evaluate classification accuracy independent of the seg-mentation performance.
Evaluation of feature contribution
We then evaluated the contribution of features collected across the mpI data and ranked their contribution to segmentation and classification based on two measures: (1) RF Gini importance (GI) [10] and (2) minimum-redundancy-maximum-relevance (mRMR) [24]. The GI measures the average amount of information gain using the Gini index splitting criterion during RF training and ranks the contribution of each feature as part of a multivariate pattern. If features are redundant but in-formative, it ranks all of them highly [25]; the mRMR provides a ranking based on relevance and redun-dancy of the features. Then, we successively increased the number of features for training and validation, be-ginning with the top-ranked feature, and measured the performance of each model, thus allowing us to assess the contribution of each individual feature in a multimodal, multiparametric setup. In addition, the benefits of multiparametric and multimodal features were evaluated by training models using only DCE-MRI features and combined DCE-MRI, DWI, and/or 18F-FDG PET features.
Results
Lesion segmentation
Table 3Automatic segmentation performance in terms of DSC and sensitivity
Features DSC mean ± SD/median ± IQR Sensitivity mean ± SD/median ± IQR Number of features
GI 0.607 ± 0.238/0.691 ± 0.255 0.661 ± 0.234/0.721 ± 0.263 2
GI without PET 0.608 ± 0.281/0.722 ± 0.419 0.739 ± 0.290/0.876± 0.238 11
GI without DWI 0.573 ± 0.290/0.708 ± 0.445 0.669 ± 0.324/0.825 ± 0.445 8
GI without DWI, without PET 0.577 ± 0.277/0.665 ± 0.419 0.658 ± 0.343/0.813 ± 0.597 25
mRMR 0.665± 0.236/0.757± 0.189 0.743 ± 0.267/0.836 ± 0.269 8
mRMR without PET 0.618 ± 0.272/0.749 ± 0.413 0.748 ± 0.277/0.873 ± 0.307 7
mRMR without DWI 0.601 ± 0.268/0.701 ± 0.377 0.686 ± 0.328/0.801 ± 0.538 7
mRMR without DWI, without PET 0.584 ± 0.300/0.710 ± 0.393 0.613 ± 0.338/0.784 ± 0.496 8
DSCDice similarity coefficient,DWIdiffusion-weighted imaging,IQRinterquartile range,GIGini Importance,mRMRminimum-redundancy-maximum-relevance,PET
positron emission tomography,SDstandard deviation. Values presented in bold are the highest values
0.757. Here, DSC benefited from multiparametric fea-tures, showing a reduced mean DSC of 0.601 without DWI, 0.618 without PET, and 0.584 with only DCE-MRI features. The model with GI feature selec-tion showed a lower performance with a DSC of 0.607 compared with the model with mRMR feature selec-tion. Here, DSC also benefitted from multiparametric features, showing a reduced DSC of 0.577 with only DCE-MRI features. The improvement in segmentation accuracy for multiparametric features mainly resulted
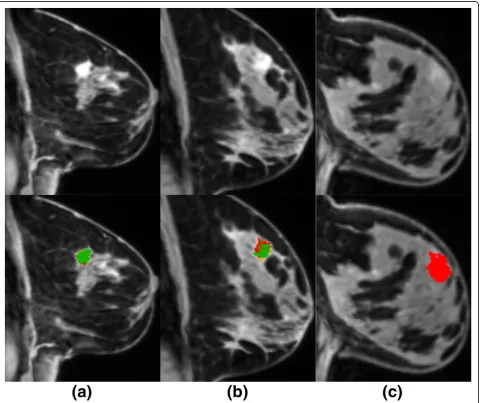
from reducing false-positive cases, such as vessels and enhancing parenchymal areas. Overall, for this dataset, we had a detection rate of 22/22 (100%) for malignant lesions and of 10/12 (83.3%) for benign lesions. As shown in Fig. 4, the missed benign lesions had a very low contrast uptake and thus were missed by the pre-diction models.
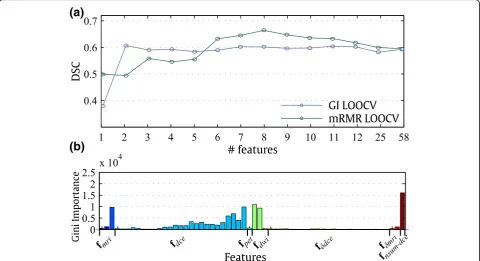
The performance of the GI and mRMR feature selection models with an increasing number of highest-ranked fea-tures is shown in Fig.5a. The performance of the GI fea-ture selection model peaked at only three feafea-tures whereas the performance of the mRMR feature selection model peaked at six features. Table4shows the ranking of the features according to GI and mRMR. Both algorithms rankedfdwi,fnsum-dce, andIdce-posthighly. However, mRMR
tended to pick more varied features than GI, where GI se-lected six potentially correlated features from fdce as part
of the top 10 features. The features capturing changes in the contrast,fδdceandfδmri, received a lower ranking in GI
(see also Fig.5b) compared with mRMR.
Lesion classification
In Table 5, we list the results for the models showing the highest ROC AUC score after GI and mRMR fea-ture selection. Overall, for manually annotated lesions, mRMR feature selection yielded the highest AUC (0.978) using only two features, with a sensitivity of 94.6% and specificity of 93.6% for identifying
(a)
(b)
Fig. 5Feature ranking and its influence on segmentation performance.aThe mean DSC, using a successively increasing number of top-ranked features according to RF GI and mRMR ranking.bGI feature ranking of the segmentation features. The four top-ranked features are labelled in the figure
Table 4Top-ranked segmentation features according to Gini importance and minimum-redundancy-maximum-relevance
Rank Gini importance Minimum-redundancy-maximum-relevance
1 fnsum-dce Idce-post
2 fdwi# 1 fδdce#16
3 fdce# 25 fdwi# 2
4 Idce-post fpet
5 fdwi# 2 fnsum-dce
6 fdce# 23 fdwi#1
7 fdce# 22 fδmri#1
8 fdce# 24 fδdce#23
9 fdce# 15 fδmri#2
10 fdce# 17 fδdce#20
malignant lesions. When automatic segmentation was used, the highest ROC AUC was 0.861 including only three DCE-MRI features. mRMR feature selection showed a better AUC performance than GI, both for manual annotation (0.978 versus 0.949) and automatic segmentation (0.861 versus0.771).
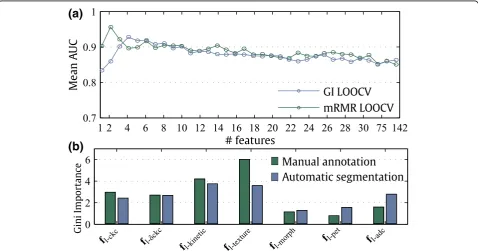
The performance of the GI and mRMR feature selec-tion models with an increasing number of highest-ranked features is shown in Fig.6a. The mRMR feature selection model peaked at only two features
whereas the GI feature selection model peaked at four features, with a subsequent decrease in AuC perform-ance. A closer look at the ranking of the features (Table6 and Fig.6b) indicates that features from the pool of kin-etic (fl-kinetic) and textural (fl-texture) features were
top-ranked by GI and mRMR models. Morphologic (fl-morph) and PET (fl-pet) features received a low ranking
by GI and mRMR models. The DWI ADC feature (fl-adc)
was ranked as an important feature by GI in automatic segmentation only.
Table 5Classification results for differentiation of malignant and benign lesions for manually annotated lesions and automatic segmented lesions using automatic feature selection
Feature selection method Manual annotation Automatic segmentation
AUC (mean ± SD) Sensitivity/ specificity
Number of features
AUC (mean ± SD) Sensitivity/ specificity
Number of features
GI LOOCV 0.949 ± 0.019 0.920/0.868 4 0.771 ± 0.040 0.961/0.482 100
GI LOOCV without PET 0.946 ± 0.002 0.924/0.859 4 0.771 ± 0.040 0.972/0.486 75
GI LOOCV without DWI 0.949 ± 0.015 0.915/0.873 4 0.754 ± 0.035 0.983/0.427 75
GI LOOCV without DWI, without PET 0.944 ± 0.018 0.922/0.868 4 0.755 ± 0.033 0.976/0.409 75
mRMR LOOCV 0.978± 0.008 0.946/0.936 2 0.858 ± 0.013 0.941/0.773 3
mRMR LOOCV w/o PET 0.975 ± 0.010 0.957/0.918 2 0.856 ± 0.018 0.948/0.736 3
mRMR LOOCV w/o DWI 0.977 ± 0.006 0.954/0.950 2 0.857 ± 0.017 0.943/0.745 3
mRMR LOOCV w/o DWI, PET 0.973 ± 0.010 0.950/0.927 2 0.861± 0.009 0.941/0.755 3
AUCarea under the curve at receiver operating characteristic analysis,DCE-MRIdynamic contrast-enhanced magnetic resonance imaging,DWIdiffusion-weighted imaging,GIGini importance,LOOCVleave-one-out cross-validation,mRMRminimum-redundancy-maximum-relevance,PETpositron emission tomography, SD standard deviation. Values presented in bold are the highest values
(a)
(b)
Discussion
We present a novel data-driven combined breast lesion segmentation and classification system for mpI data with combined18F-FDG-PET/MRI. This system automatically detects and segments potentially cancerous regions and classifies lesions as benign or malignant. Our results showed that automatic lesion segmentation was accurate and improved with information from all modalities, but even a small number of features were sufficient to achieve the reported maximum accuracy. On the other hand, our results showed that lesion classification largely drew on information from DCE-MRI, without benefit-ting from information from other modalities and param-eters. The results are consistent with previous findings but add insights into the feasibility of a completely auto-mated lesion segmentation and of classification from mpI data. The results were obtained by quantifying the information captured across multimodal mpI data and features, enabling the assessment of imaging protocols in this context.
Using combined mpI based on DCE-MRI, DWI, and
18
F-FDG-PET in a CADe or CADx system is a novel promising approach for improving diagnostic accuracy [26]. Previously, CADe and CADx systems have been proposed for digital mammography to increase the ra-ther moderate sensitivity [27] and to help in classifying lesions as benign or malignant [28]. Semi-automatic methods have been proposed for classifying each pixel as cancerous or non-cancerous using fuzzy c-means clus-tering [29] or Markov random field-based clustering of the time-series [30]. Moreover, methods designed to out-line lesions using theactive contour framework (i.e., au-tonomously and adaptive search of object contours based on image features and user interaction) have also been presented [31, 32]. Automatic segmentation methods, which may also be seen as CADe systems, have been proposed using machine-learning approaches
based on intensity and textural features (co-occurrence, run-length) [20,33–35]. Recently, an automated localisa-tion of breast cancer lesions based on DCE-MRI was proposed by Gubern-Mérida et al. [36]. Multimodal ap-proaches combining several modalities have been re-ported for PET/CT breast images: Han et al. [37] segmented lesions by applying a graph-based Markov ran-dom field method on a combined PET/CT image, taking advantage from both the high spatial resolution of CT and the functional information of PET. Lastly, several CADx methods that classify breast lesions as benign or malignant by exploring the DCE-MRI data have been proposed using morphology [38], lesion texture [39], contrast enhance-ment [16,40], a combination of morphology and contrast enhancement [41], or a combination of morphology and texture [19, 21, 31, 42, 43]. State-of-the-art DCE-MRI CADx methods have been reported using various per-formance metrics, different datasets (e.g., malignant cases only), and differing aims (i.e., segmentation versus
detection).
Using our system, we detected all malignant cases and missed two benign lesions. Detected lesions were classi-fied as malignant with a sensitivity of 95%. Using texture features, Woods et al. [20] and Yao et al. [35] previously reported an ROC-AUC of 0.999 and 0.984, respectively. However, Woods et al. performed the evaluation on the same subjects as used in training, and both these studies were conducted in a small set of malignant lesions only. Twellmann et al. [33] reported a ROC-AUC of 0.99 for lesion detection using LOOCV and DCE-MRI informa-tion. Vignati et al. [34] reported the performance of a fully automated system as a detection rate of 0.89 and a sensitivity of 0.98 at four false-positive cases per breast. In their study, the performance measure did not include false-positive areas. Gubern-Mérida et al. [36] used an automated method and achieved a sensitivity of 89% at four false-positive per normal case. As normal cases,
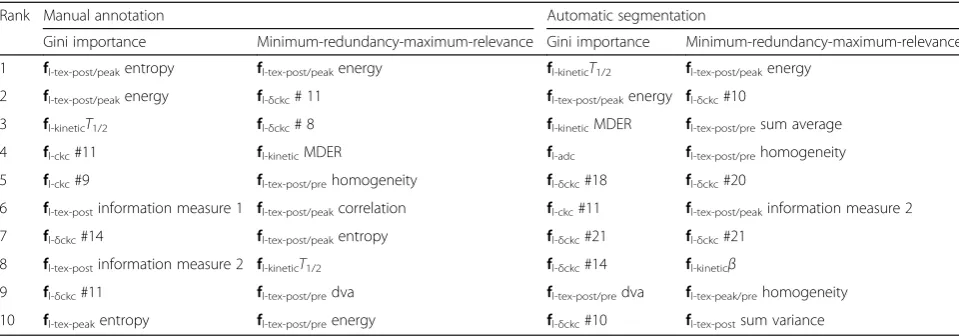
Table 6The ten top-ranked classification features according to Gini importance and minimum-redundancy-maximum-relevance
Rank Manual annotation Automatic segmentation
Gini importance Minimum-redundancy-maximum-relevance Gini importance Minimum-redundancy-maximum-relevance
1 fl-tex-post/peakentropy fl-tex-post/peakenergy fl-kineticT1/2 fl-tex-post/peakenergy 2 fl-tex-post/peakenergy fl-δckc# 11 fl-tex-post/peakenergy fl-δckc#10
3 fl-kineticT1/2 fl-δckc# 8 fl-kineticMDER fl-tex-post/presum average
4 fl-ckc#11 fl-kineticMDER fl-adc fl-tex-post/prehomogeneity
5 fl-ckc#9 fl-tex-post/prehomogeneity fl-δckc#18 fl-δckc#20
6 fl-tex-postinformation measure 1 fl-tex-post/peakcorrelation fl-ckc#11 fl-tex-post/peakinformation measure 2
7 fl-δckc#14 fl-tex-post/peakentropy fl-δckc#21 fl-δckc#21
8 fl-tex-postinformation measure 2 fl-kineticT1/2 fl-δckc#14 fl-kineticβ
9 fl-δckc#11 fl-tex-post/predva fl-tex-post/predva fl-tex-peak/prehomogeneity
10 fl-tex-peakentropy fl-tex-post/preenergy fl-δckc#10 fl-tex-postsum variance
they included patients with a BI-RADS rating of 1 or 2, who were healthy subjects with benign findings.
For the task of automatic lesion segmentation, our study showed that mpI is beneficial, as evidenced by the increase of the DSC from 0.584 to 0.665. The high rank-ing of DWI features in both GI and mRMR feature se-lection models indicates that the addition DWI to DCE-MRI is especially beneficial in segmentation. We also found that lesion segmentation benefitted from the addition of PET, although the benefit was to a lesser ex-tent than that of DWI. When both DWI and PET were added, the DSC was further improved; thus, our results suggest that PET has a complementary relationship with DWI. Interestingly, features describing the change of contrast between time-steps (fδdce and fδmri) received a
good ranking in the mRMR feature selection model overall but a low ranking in the GI feature selection model. A likely reason is that while they contribute less information than the higher-ranked GI features, their contribution is orthogonal to the higher-ranked features. In our study, mRMR as a feature selection model pro-vided slightly better results than GI. The moderate mean DSC score for lesion segmentation results from several reasons. First, the two undetected benign lesions exhib-ited very low contrast enhancement with a DSC of 0, leading to a drop in the mean value. However, we kept these two benign cases in the dataset to evaluate whether additional parameters may allow the system to segment these challenging cases, which was not the case as re-ported. Second, additional areas of contrast uptake, such as vessels and enhancing parenchymal tissues, resulted in an increased false-positive rate. While DWI and
18
F-FDG-PET image modalities increased automatic seg-mentation accuracy, mainly by reducing the false-positive cases, lesions with low contrast uptake could not be de-tected automatically. As good segmentation is important for the accurate classification of a lesion, we aim to im-prove the segmentation performance,e.g., by introducing heuristics that filter false-positive cases in a post-process-ing step in a future study, as proposed for instance by Vig-nati et al. [34] and Gubern-Mérida et al. [36] where morphologic and kinetic descriptors were used in a sec-ond step.
In our study, a high accuracy in lesion classification was achieved for both expert and automatic segmenta-tion. However, the highest accuracy was achieved with manual segmentation and mRMR feature selection from DCE imaging data. Top-ranked features largely over-lapped between GI and mRMR feature selection models; the exception was thatfl-adcwas ranked highly by the GI
feature selection model following only automatic segmentation. While the addition of DWI and
18
F-FDG-PET to DCE-MRI was beneficial overall for le-sion segmentation, lele-sion classification only improved
slightly with these two modalities for GI feature selec-tion following manual segmentaselec-tion. Lesion classifica-tion for mRMR features selecclassifica-tion was best without these two modalities. fl-pet was lowly ranked, consistent with
recent findings by Magometschnigg et al. [44] that indi-cate that quantitative18F-FDG-PET values are not help-ful for breast cancer classification. On the other hand, the kinetic feature fl-kineticreceived a high GI as well as
high mRMR ranking. Textural features were top-ranked, mostly from fl-tex-post/peak. The top-ranked feature,
GLCM energy, measures the uniformity of lesion tex-ture, reflecting the uniformity of contrast-enhancement within the lesion during a later stage. The morphologic featurefl-morphscored very low, although they are an
in-tegral part of the BI- RADS® lexicon for lesion classifica-tion, being discriminative features for clinical diagnosis, as shown by Pinker-Domenig et al. [45]. This suggests that binary segmentation and shape descriptors are not precise enough to describe the shape and margin of the lesion and feature extraction from a soft-margin around the hard segmentation border (e.g., textural features) may better capture the BI-RADS margin descriptors (cir-cumscribed, non-cir(cir-cumscribed, irregular, spiculated). Alternatively, digital mammography or digital breast tomosynthesis may be used as an additional higher reso-lution modality to assess the morphology of the lesion more accurately. To summarise, mRMR slightly outper-formed GI as a feature selection method for breast le-sion classification. Novel DCE-MRI features that describe the kinetics and spatio-temporal texture of the contrast uptake were highly predictive for the classifica-tion of benign and malignant lesions, whereas DWI and PET did not provide additional information. Whereas we used data from separate MRI and PET/CT scanners, the methods, results, and findings can be directly trans-ferred to images obtained at combined PET/MRI scan-ners, as the CT information was used for alignment only and was not part of the decision models.
One limitation of the study is that only subjects with suspicious findings on mammography or breast ultra-sonography were included. As a consequence, an assess-ment of false-positive cases in healthy subjects was not possible. However, the majority of tissue in the breast consists of healthy tissue, on which the classifier was trained, and was classified as healthy tissue in our study. A second limitation is the small number of subjects. Even though cross-validation allowed us to estimate the generalisation of the model to some degree, statistical significance can only be obtained from a larger cohort. Thus, we aim to confirm our preliminary findings on a larger number of patients in a future study.
in-depth understanding of the multivariate information, where redundancies and relationships between imaging data are not obvious. This is essential for further clinical exploitation of imaging parameters. It enables designing of feasible imaging paradigms constructed from a possibly reduced subset of acquisition sequences. Furthermore, in the context of disease mechanisms, the data-driven model could serve as a means for hypothesis generation.
Additional file
Additional file 1:Figure S1.Illustration of the influence of logistic model parameters on curve, and the model fitted to a CKC. From left to right:αdefines the asymmetry of the logistic model,τthe steepness of the curve and k influences the terminal slope. The regression curve fitted to a given CKC for a malignant (blue) and a benign lesion (green).Figure S2.Boxplot of automatic segmentation performance in terms of Dice similarity coefficient (DSC). DWI, diffusion-weighted imaging; GI, Gini Im-portance; mRMR, minimum-Redundancy-Maximum-Relevance; PET, posi-tron emission tomography; w/o, without. (DOCX 219 kb)
Abbreviations
18
F-FDG:18F-fluorodeoxyglucose; ADC: Apparent diffusion coefficient; BI-RADS: Breast Imaging-Reporting and Data System; CADe: Computer-aided detection; CADx: Computer-aided diagnosis; CT: Computed tomography; DCE-MRI: Contrast-enhanced magnetic resonance imaging; DSC: Dice similarity coefficient; DWI: Diffusion-weighted imaging; FLASH: Fast low angle shot; GI: Gini importance; GLCM: Grey-level co-occurrence matrix;
LOOCV: Leave-one-out cross-validation; mpI: Multiparametric imaging; mRMR: Minimum-redundancy-maximum-relevance; PET: Positron emission tomography; RF: Random forest; ROC: Receiver operating characteristic; VIBE: Volumetric interpolated breath-hold-examination
Availability of data and materials
The datasets used and/or analysed during the current study are available from the corresponding author on reasonable request.
Funding
This work was supported by the Austrian Science Fund FWF (I2714-B31); the Austrian Federal Ministry of Economy, Family and Youth, the National Foundation for Research, Technology and Development [OPTIMA]; the Austrian Nationalbank‘Jubiläumsfond’Projects Nr. 16219 and Nr. 13418; and the H2020 - Research and Innovation Framework Programme PHC-11-2015 [667211-2]. Katja Pinker was partially supported by the NIH/NCI Cancer Center Support Grant P30 CA008748.
Acknowledgements
The authors acknowledge the support in manuscript writing and editing from Joanne Chin.
Authors’contributions
KP, THH, and GL contributed to the conception and design. KP, THH, W-DV, and GL contributed to the development of the methodology. W-DV, KP, THH, HB, GG, WB, SG, and PD contributed to the acquisition of data (acquired and managed patients, provided facilities, etc.). W-DV, ZB-H, KP, and GL contributed to the analysis and interpretation of data (e.g., statistical analysis, biostatistics, computational analysis). W-DV, KP, THH, HB, GG, WB, SG, ZB-H, PD, and GL contributed to the writing, review, and/or revision of the manuscript. W-DV, KP, THH, and GL contributed to the administrative, technical, or material support (i.e., reporting or organising data, constructing databases). KP, THH, and GL contributed to the study supervision. W-DV, KP, THH, HB, GG, WB, SG, ZB-H, PD, and GL contributed to the final approval of the manuscript to be published.
Ethics approval and consent to participate
The institutional review board of the Medical University of Vienna approved this prospective, single-institution study (EK 510_2009) and retrospective data analysis and all patients gave written, informed consent.
Consent for publication Not applicable.
Competing interests
The authors declare that they have no competing interests.
Publisher’s Note
Springer Nature remains neutral with regard to jurisdictional claims in published maps and institutional affiliations.
Author details
1Computational Imaging Research Laboratory, Department of Biomedical
Imaging and Image-guided Therapy, Medical University Vienna, Waehringer Guertel 18-20, 1090 Vienna, Austria.2Division of Molecular and Gender Imaging, Department of Biomedical Imaging and Image-guided Therapy, Medical University Vienna, 1090 Vienna, Austria.3Department of Radiology, Breast Imaging Service, Memorial Sloan Kettering Cancer Center, New York, NY 10065, USA.4MR Center of Excellence, Department of Biomedical Imaging and Image-guided Therapy, Medical University Vienna, 1090 Vienna, Austria.5Department of Pathology, Medical University Vienna, 1090 Vienna, Austria.6Department of Surgery, Medical University Vienna, 1090 Vienna, Austria.7Department of Radiologic Technology, Carinthia University of Applied Sciences, Klagenfurt, Austria.
Received: 22 October 2018 Accepted: 7 March 2019
References
1. Ferlay J, Shin HR, Bray F, Forman D, Mathers C, Parkin DM (2010) Estimates of worldwide burden of cancer in 2008: GLOBOCAN 2008. Int J Cancer 127: 2893–2917
2. Baum M (1976) The curability of breast cancer. BMJ 1:439–442
3. Pinker K, Bogner W, Baltzer P et al (2014) Improved differentiation of benign and malignant breast tumors with multiparametric 18fluorodeoxyglucose positron emission tomography magnetic resonance imaging: a feasibility study. Clin Cancer Res 20:3540–3549
4. Ayer T, Ayvaci MU, Liu ZX, Alagoz O, Burnside ES (2010) Computer-aided diagnostic models in breast cancer screening. Imaging Med 2:313–323 5. Woods BJ (2008) Computer-aided detection of malignant lesions in
dynamic contrast enhanced MRI breast and prostate cancer datasets. Dissertation, Ohio State University Available viahttp://rave.ohiolink.edu/ etdc/view?acc_num=osu1218155270
6. Doi K (2007) Computer-aided diagnosis in medical imaging: historical review, current status and future potential. Comput Med Imaging Graph 31: 198–211
7. Vyborny CJ, Giger ML, Nishikawa RM (2000) Computer-aided detection and diagnosis of breast cancer. Radiol Clin North Am 38:725–740
8. Morris E, Comstock C, Lee C, Lehman C, Ikeda D, Newstead G (2013) ACR BI-RADS® magnetic resonance imaging. ACR BI-BI-RADS® Atlas, Breast Imaging Reporting and Data System Reston. American College of Radiology, VA, USA 9. Stoutjesdijk MJ, Fütterer JJ, Boetes C, van Die LE, Jager G, Barentsz JO (2005)
Variability in the description of morphologic and contrast enhancement characteristics of breast lesions on magnetic resonance imaging. Investig Radiol 40:355–362
10. Breiman L (2001) Random forests. Mach Learn 45:5–32
11. Pinker K, Grabner G, Bogner W et al (2009) A combined high temporal and high spatial resolution 3 Tesla MR imaging protocol for the assessment of breast lesions: initial results. Invest Radiol 44:553–558
12. Bogner W, Pinker-Domenig K, Bickel H et al (2012) Readout-segmented echo-planar imaging improves the diagnostic performance of diffusion-weighted MR breast examinations at 3.0 T. Radiology 263:64–76 13. Avants BB, Tustison NJ, Song G, Cook PA, Klein A, Gee JC (2011) A
14. Somer EJ, Benatar NA, O'Doherty MJ, Smith MA, Marsden PK (2007) Use of the CT component of PET-CT to improve PET-MR registration:
demonstration in soft-tissue sarcoma. Phys Med Biol 52:6991–7006 15. Adams R, Bischof L (1994) Seeded region growing. IEEE Trans Pattern Anal
Mach Intell 16:641–647
16. Chen W, Giger ML, Bick U, Newstead GM (2006) Automatic identification and classification of characteristic kinetic curves of breast lesions on DCE-MRI. Med Phys 33:2878–2887
17. Haralick RM (1979) Statistical and structural approaches to texture. Proc IEEE 67:786–804
18. Chen W, Giger ML, Li H, Bick U, Newstead GM (2007) Volumetric texture analysis of breast lesions on contrast-enhanced magnetic resonance images. Magn Reson Med 58:562–571
19. Agner SC, Soman S, Libfeld E et al (2011) Textural kinetics: a novel dynamic contrast-enhanced (DCE)-MRI feature for breast lesion classification. J Digit Imaging 24:446–463
20. Woods BJ, Clymer BD, Kurc T et al (2007) Malignant-lesion segmentation using 4D co-occurrence texture analysis applied to dynamic contrast-enhanced magnetic resonance breast image data. J Magn Reson Imaging 25:495–501
21. Nie K, Chen JH, Yu HJ, Chu Y, Nalcioglu O, Su MY (2008) Quantitative analysis of lesion morphology and texture features for diagnostic prediction in breast MRI. Acad Radiol 15:1513–1525
22. Gilhuijs KG, Giger ML, Bick U (1998) Computerized analysis of breast lesions in three dimensions using dynamic magnetic-resonance imaging. Med Phys 25:1647–1654
23. Dice LR (1945) Measures of the amount of ecologic association between species. Ecology 26:297–302
24. Peng H, Long F, Ding C (2005) Feature selection based on mutual information: criteria of max-dependency, max-relevance, and min-redundancy. IEEE Trans Pattern Anal Mach Intell 27:1226–1238 25. Menze BH, Kelm BM, Masuch R et al (2009) A comparison of random forest
and its Gini importance with standard chemometric methods for the feature selection and classification of spectral data. BMC Bioinformatics 10:213 26. Pinker K, Bogner W, Baltzer P et al (2014) Improved diagnostic accuracy with
multiparametric magnetic resonance imaging of the breast using dynamic contrast-enhanced magnetic resonance imaging, diffusion-weighted imaging, and 3-dimensional proton magnetic resonance spectroscopic imaging. Invest Radiol 49:421–430
27. Oliver A, Freixenet J, Marti J et al (2010) A review of automatic mass detection and segmentation in mammographic images. Med Image Anal 14:87–110
28. Elter M, Horsch A (2009) CADx of mammographic masses and clustered microcalcifications: a review. Med Phys 36:2052–2068
29. Chen W, Giger ML, Bick U (2006) A fuzzy c-means (FCM)-based approach for computerized segmentation of breast lesions in dynamic contrast-enhanced MR images. Acad Radiol 13:63–72
30. Wu Q, Salganicoff M, Krishnan A, Fussell DS, Markey MK (2006) Interactive lesion segmentation on dynamic contrast enhanced breast MRI using a Markov model. Proc SPIE 6144:61444M-1–61444M-8.https://doi.org/10.1117/ 12.654308
31. Zheng Y, Englander S, Baloch S et al (2009) STEP: spatiotemporal enhancement pattern for MR-based breast tumor diagnosis. Med Phys 36: 3192–3204
32. Agner SC, Xu J, Madabhushi A (2013) Spectral embedding based active contour (SEAC) for lesion segmentation on breast dynamic contrast enhanced magnetic resonance imaging. Med Phys 40:032305 33. Twellmann T, Lichte O, Nattkemper TW (2005) An adaptive tissue
characterization network for model-free visualization of dynamic contrast-enhanced magnetic resonance image data. IEEE Trans Med Imaging 24: 1256–1266
34. Vignati A, Giannini V, De Luca M et al (2011) Performance of a fully automatic lesion detection system for breast DCE-MRI. J Magn Reson Imaging 34:1341–1351
35. Yao J, Chen J, Chow C (2009) Breast tumor analysis in dynamic contrast-enhanced MRI using texture features and wavelet transform. IEEE J Sel Top Signal Process 3:94–100
36. Gubern-Mérida A, Martí R, Melendez J et al (2015) Automated localization of breast cancer in DCE-MRI. Med Image Anal 20:265–274
37. Han D, Bayouth J, Song Q et al (2011) Globally optimal tumor segmentation in PET-CT images: a graph-based co-segmentation method. In: Székely G,
Hahn HK (eds) Information Processing in Medical Imaging. IPMI 2011. Lecture Notes in Computer Science, vol 6801. Springer, Berlin, Heidelberg, pp 245–256
38. Meinel LA, Stolpen AH, Berbaum KS, Fajardo LL, Reinhardt JM (2007) Breast MRI lesion classification: improved performance of human readers with a backpropagation neural network computer-aided diagnosis (CAD) system. J Magn Reson Imaging 25:89–95
39. Gibbs P, Turnbull LW (2003) Textural analysis of contrast-enhanced MR images of the breast. Magn Reson Med 50:92–98
40. Levman J, Leung T, Causer P, Plewes D, Martel AL (2008) Classification of dynamic contrast-enhanced magnetic resonance breast lesions by support vector machines. IEEE Trans Med Imaging 27:688–696
41. Szabó BK, Wiberg MK, Boné B, Aspelin P (2004) Application of artificial neural networks to the analysis of dynamic MR imaging features of the breast. Eur Radiol 14:1217–1225
42. McLaren CE, Chen WP, Nie K, Su MY (2009) Prediction of malignant breast lesions from MRI features: a comparison of artificial neural network and logistic regression techniques. Acad Radiol 16:842–851
43. Chen W, Giger ML, Newstead GM et al (2010) Computerized assessment of breast lesion malignancy using DCE-MRI robustness study on two
independent clinical datasets from two manufacturers. Acad Radiol 17:822–829 44. Magometschnigg HF, Baltzer PA, Fueger B et al (2015) Diagnostic accuracy
of 18F-FDG PET/CT compared with that of contrast-enhanced MRI of the breast at 3 T. Eur J Nucl Med Mol Imaging 42:1656–1665