A Multi-objective Optimization Approach for Optimal Location and
Sizing of SVC to Enhance Power System Security
T. N. V. L. N. Kumar
Professor & Head, Department of E.E.E. Geethanjali Institute of Science and Technology,
Nellore. India [email protected]
R.V. S. Satyanarayana Professor, Department of E.C.E. S. V. University College of Engineering
Tirupathi, India [email protected]
Abstract — The increase in power demand has made operation and planning of large interconnected power system more complex and therefore less secure than before. Hence, the modern power systems are more prone to widespread failures. One family of the device which can enhance the safe and reliable operation of the network and has contributed to the capacity augmentation is FACTS. But, they are very expensive and must be suitably sized and located to maximize the overall benefit to the system. This work aims to identify the optimal location and size of the Static Var Compensator (SVC) by optimizing the multi-objective function, formulated by different factors that define system security, namely Voltage Deviation, System Overload and Real Power Losses. The multi objective optimization function has been optimized using a Modified Bacterial Foraging Optimization Algorithm (MBFOA). The results are presented and analyzed for an IEEE 30 bus test system and Indian Utility Neyveli Thermal Power Station (IU-NTPS) 23 bus practical system.
Keyword — FACTS, SVC, System security, MBFOA, IEEE 30 Bus system, IU-NTPS.
1. INTRODUCTION
A Flexible AC transmission systems (FACTS), a power electronics based device which was introduced in 1980s., It is now used as an economical and efficient means to control power transfer in an interconnected AC transmission system [1, 2].Over years, the use of FACTS controllers in transmission system have become crucial, to increase the system’s capabilities by better utilization of existing power networks. In the conventional power system, there is very little or no control over the variables such as phase angles, bus voltages and line impedances. These variables control power flow and a change in any of them can change the power flow. A FACTS controller controls these variables, and hence the power flow gets controlled indirectly. Due to this, they provide a better stability of power system network, like voltage stability, line stability, small signal stability, transient stability, enhance power transfer capability. This in turn improves the system reliability. However, in all this the main role played using FACTS devices leads for controlling the power flow [3, 4]. Placing FACTS at proper location in a transmission system can result in control of line flow and maintenance of bus voltage level at the desired level. This leads to improvement in voltage stability margin. It is this compensating capability of FACTS devices that helps in reducing the flow of heavily loaded lines and thus maintains voltages at desired level. The only problem with the FACTS device is its cost. Therefore, it is important that it can be placed
power system stability. The optimization techniques used for the same are: Genetic Algorithm (GA), Particle Swarm Optimization (PSO) and some other heuristic techniques. The BFOA proposed by Kevin Paso in the year 2002 has attracted many researchers towards it. This can be attributed toward its less computational time, ability to provide global convergence and capability to handle more number of objective functions when compared with other evolutionary algorithms. In specific relation to its advantage for the power system is its immunity towards the size and non-linearity of the problem. Its performance remains unaffected by the size and non-linearity, a problem like optimal location of FACTS devices can offer. It also has the ability to provide convergence where most of the analytical methods have failed. Most of the existing works employ conventional BFOA and locate the FACTS device. Any suitable modification and improvements in BFOA can enhance its ability to find the global solution. The very structure of BFOA provides an opportunity in optimizing the tumble directions of the bacteria so that it can be guided effectively towards the global best of the population. Similarly, there is also a chance to dynamically alter the chemo tactic steps resulting in wider chance of individuals in reproduction view. This works aims at exploiting these two possibilities in delivering the Modified Bacterial Foraging Optimization Algorithm (MBFOA) and use it for the optimal location and sizing of Static VAr Compensator (SVC). The placement is optimized using a Multi Objective Function to identify the optimal location of SVC device and this function represents voltage deviation, system overload and real power loss. The proposed method is validated using IEEE 30 bus system. The (IU-NTPS) 23 bus practical system (Indian Utility Neyveli Thermal Power Station) results were obtained for validating the superiority of the proposed technique.
2. MODEL OF STATIC VAR COMPENSATOR (SVC)
This work aims at exploiting these two possibilities in delivering the Modified Bacterial Foraging Optimization Algorithm (MBFOA) [13, 14, 15] and use it for the sizing and optimal location Static VAR Compensator (SVC). The SVC has salient features like voltage stability, damping of power oscillations and maintaining the voltage constant at the desired value. This work aims at exploiting these two possibilities in delivering the Modified Bacterial Foraging Optimization Algorithm (MBFOA) [33-38] and use it for the sizing and optimal location Static VAr Compensator (SVC). The SVC has salient features like voltage stability, damping of power oscillations and maintaining the voltage constant at the desired value. The equivalent circuit of the variable susceptance model is shown in Figure 1 [26].
Figure 1 Variable susecptance model of SVC
The liberalized equation representing the total susceptance Bsvc as state variable is given by the
following equation
At each iteration (k), the variable shunt susceptance Bsvc
is updated
Based on the equivalent circuit of SVC, the current drawn by SVC is
Reactive power drawn by SVC, which is also reactive power injected,Qsvc at bus i, is
3. PROBLEM FORMULATION
Multi-objective combinatorial optimization problems explore a finite search space for optimum and feasible solutions. These solutions should be optimum and often balance multiple objectives simultaneously. This is the fundamental challenge in different domains of engineering. Most of the multi objective problems are NP (Non deterministic Polynomial) time hard problems. To solve these problems, the approximation approaches that primarily depend on met heuristic have been used over a period of time. It is important that has to be kept in mind while using these met heuristic approaches is that they often identified only near optimal solutions and also suffer from parameters sensitivity. This value refers to the fact that the accuracy of the result is often influenced by the parameter setting of these approaches. In this research work one such optimization formulation has been employed. The primary goal of this formulation is to determine the optimal location and sizing of FACTS devices in a power system to enhance its security while keeping the system loses low. The proposed multi optimization problem is the representative of three different functions, namely Voltage Deviation, System Overload and Real Power Losses. The multi-objective function is represented as
Where, F and x are the objectives and decision vectors, Ω are the solution domain.
Where,
is Nominal voltage magnitude (1 pu for all load buses),Vi is the voltage magnitude for ith load bus, Sj is the apparent power for jthline and denoted as the max apparent power for jth line. Finally, the real power at ith line is represented as PLi. The proposed multi-objective function has to be optimized within certain constraints. These constraints can be very broadly classified into equality and inequality constraints. In this research work, the equality constraints load flow equations considered for real and reactive power flow conditions and the inequality constraints for the generation of reactive power constraints and the constraints for the FACTS device. The equality and inequality constraints are also considered to evaluate Modified BFOA. These constraints are listed below:
3.1. Equality constraints
These constraints represent the load flow equations corresponding to both real and reactive power balance equations, which can be written as:
(
)
(
)
0
1
N j ij ij ij ij j ii
PD
V
G
Cos
B
Sin
PG
(9)
(
)
(
)
0
1
N j ij ij ij ij j ii
QD
V
G
Sin
B
Cos
QG
(10)Where:
PGi and QGi: generator real and reactive power at ithbus respectively;
PDi and QDi: load real and reactive power at ith bus respectively;
Gij and Bij: transfer conductance and susceptance between buses i and j, respectively.
3.2. Inequality constraints
Generation reactive power constraints:
N
I
fori
Q
Q
Q
Gi Gi Gi...
max
min
(11)FACTS constraints:
For SVC min max C SVC
C
Q
Q
Q
(12)4. MODIFIED BACTERIAL FORAGING OPTIMIZATION ALGORITHM (MBFOA)
BFOA was initiated by Kevin Passino in the year 2002 [9]. He motivated by the social foraging behavior of E. coli bacteria and presented the BFOA. This algorithm has several advantages like the ability to achieve global optimization, insensitivity to initial values and ability to have parallel distributed processing. Through the reproduction operation it satisfies the rule of evolution which implies the survival of fitness. The usage of elimination dispersal procedure is used to nullify the premature convergence. The bacteria generated movement in the presence of chemical attractants and repellents is referred as chemo taxis for each bacterium [10, 20]. This process can be simulated by two distinct moves known as run or tumble. Throughout its entire lifetime, the bacteria alternate between these two modes of operation [33]-[38]. The alteration between these two moves helps the bacteria in its search for nutrients. In the case of bacteria the reproduction step happens. During this process, elimination and dispersal occurs so
that a bacterium in a particular region is dispersed because of a particular influence. This process of elimination and dispersal can affect the chemo tactic process and also assist it. In this proposed work, our modified BFOA is employed [33-38]. The bacterium representing a potential solution can be denoted by (j, G), where ‘j’ denotes the chemotaxic loop index while ‘G’
denotes the generation cycle loop index. This generational loop can be considered as a cycle in which processes are carried out. In addition to this, a swarming process is included in chemo taxis operation. The modified BFOA includes an attracter movement within the chemo taxis process. For the remaining steps the tumble - swim movement is used. In addition to this, an additional swim operator is also used making the total number of swim operators to two. The two new swims are also applied within the chemo taxis process. The first operator aims to compliment the swarming operator by letting bacteria explore other areas of search space by following randomly chosen bacteria. The second operator focuses on small movements of the bacterium in its vicinity having tiny step sized values [33-38].
Step 1:Different BFOA parameters are initialized. Step 2:The fitness of the objective function is evaluated. Step 3:The chemo tactic tumble or run is then initiated. Step 4:The end of chemo tactic function is checked for
stopping criteria. If yes, the operation is shifted to the next step or it returns back to step 2. Step 5:The process of reproduction is initiated.
Step 6:The process of reproduction is checked for stopping criteria. If the condition is satisfied the operation moves to step 7 or else it moves to step 2.
Step 7:The process of elimination and dispersion is initiated.
Step 8:The elimination and dispersion process is checked for its stopping criteria. If the condition is satisfied the operation moves to step 9 or else it moves to step 2.
Step 9:The optimized solution is provided.
Reproduction and Elimination Dispersal are the next following processes to follow. The initial swarm of bacteria a skew operator is applied. This skew helps in the random generation of bacteria but with their location skewed to a particular area. The skew factor is applied randomly. Also to avoid the premature convergence of the bacterium, the reproduction step occurs only at certain cycles of the algorithm. This repetition cycle is predefined by a parameter assigned to it.
5. RESULTS AND DISCUSSION
The simulated results are coded using Mat lab Version 7.1 and MatPower version 5. The practical results at Neyveli Thermal Power Station (IU-NTPS) based on Modified BFOA are compared with IEEE 30 Bus System. For validating the proposed approach three test cases are considered, these scenarios can be envisaged as;
Scenario 1: This is the base case with normal load in all load condition; the load flow is carried out with a load factor of 1 across all the buses.
Scenario 3: This scenario is for checking the contingency response by considering the most critical line outage in the system.
5.1. IEEE 30 Bus test system
An IEEE 30 [31] bus system is considered to estimate and validate the proposed Modified BFOA technique. The standard IEEE-30 bus system has 6 generator buses and having the tap setting transformers.
Table (1) Results of base case before optimization
The assumptions are as follows. The upper limit is 1.05 p.u. for all the PQ buses and the reference bus [13, 14, 15]. In this work, the reactive load is 126.20 MVAr. The active load is 283 MW and the system’s total generation capacity is 900 MW. The line number 5 is considered for analysis. Now, the results for base case before optimization in Table (1) and real and reactive power losses are given in the Table (2). The results of our earlier work have been considered to compare the results obtained for GA. The base case before optimization results are incorporated the Table (1). The real and reactive power losses can be observed in the Table (2).
Table (2) Real and reactive power losses for the base case before optimization
The results of optimal location and sizing of SVC for all the three scenarios are listed using the table (3) and for this placement the real power losses are calculated and tabulated using the table (4).
Table (3) Optimal location and size of SVC optimized by the proposed approach--Case 1
Table (4) Comparison of real power loss before and after placement of SVC--Case 1
The percentage reduction in real power loss after placement of optimized size of SVC in locations identified by the algorithm is depicted using the figure (2).
Figure 2 Plot of percentage reduction in real power loss post SVC placement for different scenarios --Case 1
There is appreciable improvement in real power losses on account of placement of SVC. For scenario 1, which is the base case the algorithm identifies bus 21 as the optimum location and suggests a size of SVC to be 6.7325 MVAR.
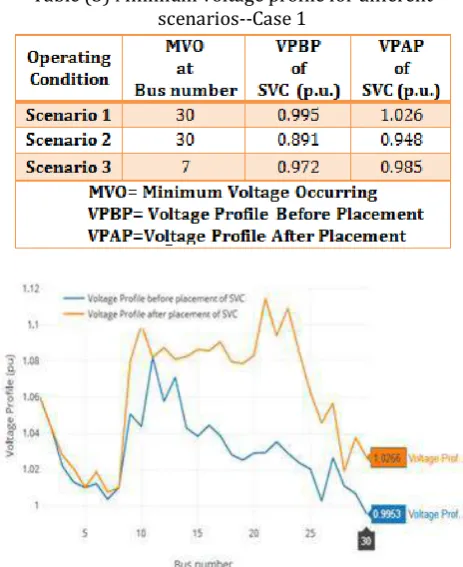
Table (5) Minimum voltage profile for different scenarios--Case 1
Figure 3 Voltage profile before and after placement of SVC for Scenario 1 -Case 1
in voltage profile is tabulated through table (5) for different scenarios. Figure (3) provides a comparative plot of voltage profiles at different buses before and after placement of SVC. A visible improvement in voltage profile is observed across all the buses for scenario1. Similarly, the average loads bus voltage before and after the optimal location of SVC is tabulated in the table (6).
Table (6) Average load bus voltage before optimization and after optimized location of SVC- Case 1
The table (7) populates the results of voltage deviation and overload for different scenarios, for before and after the placement of SVC. It is obvious from the results presented that the voltage profile has improved and is clearly visible in terms of the average value of load bus voltage as well. The effect of placement of SVC can be inferred on both the voltage deviation as well as the overload. In order to validate the proposed approach, the results are compared with those achieved by other optimization approaches namely BFOA and GA. The discussion is limited towards the optimal location and sizing for different scenarios. The influence of such placement on real power loss is also illustrated as an example to showcase the efficacy of the proposed method. The optimum location and sizing identified by different methods are listed in the table (8).
Table (7) Voltage deviation and overload before and after placement of SVC- Case 1
Table (8) Comparison of optimal placement and sizing delivered by different approaches
The comparative analysis of real power losses for different optimization techniques is illustrated using the figure (4). It can be inferred from the figure the proposed approach delivers the best results in terms of reduction of real power losses.
Figure 4 Plot of real power losses for different scenarios optimized by different approaches
5.2. Case 2: Indian Utility Neyveli Thermal Power Station (IU-NTPS) 23 bus system
The second case is Indian Utility Neyveli Thermal Power Station (IU-NTPS). It is a 23 bus system. This system has 19 load buses and having 22 transmission lines. The salient feature of IU-NTPS is that it maintains the transmission lines with 4 generator buses. The bus 1 is the reference bus for determining the system data. The results are deduced for100 MVA. Outage of line 3 is considered the most critical line outages of the IUNTPS -23 bus system.
Table (9) optimal location and size of SVC optimized by the proposed approach-Case 2
The results of size and the optimal location of SVC for all the three scenarios are listed using the Table (9) and for this placement, the real power losses are calculated and tabulated using the Table (10).
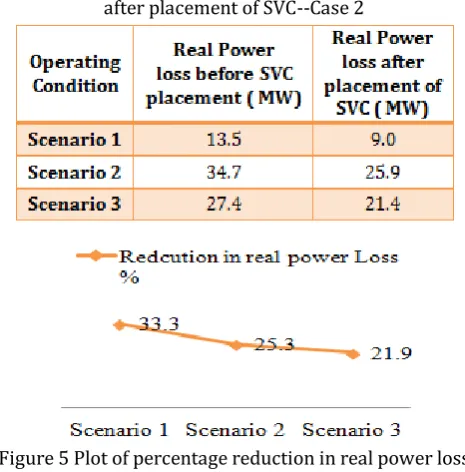
Table (10) Comparison of real power loss before and after placement of SVC--Case 2
Figure 5 Plot of percentage reduction in real power loss post SVC placement for different scenarios –case 2
by the algorithm is depicted using the figure (5).The percentage reduction in real power loss after placement of optimized size of SVC in locations identified by the algorithm is depicted using the figure (5). There is appreciable improvement in real power losses on account of placement of SVC. For scenario 1, which is the base case the algorithm identifies bus 13 as the optimum location and suggests a size of SVC to be 6.13 MVAR. This placement results in real power losses getting reduced by 4.5 MW, which translates to a reduction of 33.3 %. Similarly for scenario 2, the optimum size is identified to be 10.78 MVR placed at bus number 08. Such a placement results in reduction of real power losses from 34.70 MW to 25.90 MW.
Table (11) Minimum voltage profile for different scenarios--Case 2
This amounts to 25.3 % reduction in real power loss. Similarly when the critical line outage of line 3 is considered for location of SVC placement, the optimum bus is identified to be bus number 20 and the size is fixed at 9.04 MVAR. Similarly, the enhancement in voltage profile is tabulated through table (11) for different scenarios. It can be inferred from the table that for all the scenarios minimum voltage occurs at bus number 19. Through the location of SVC there is improvement in minimum voltage profile of these buses. Table (12) depicts the results of voltage deviation and overload for different scenarios, for before and after the placement of SVC. The positive effect of placement of SVC can be inferred on both the voltage deviation as the overload.
Table (12) Voltage deviation and overload before and after placement of SVC-Case 1
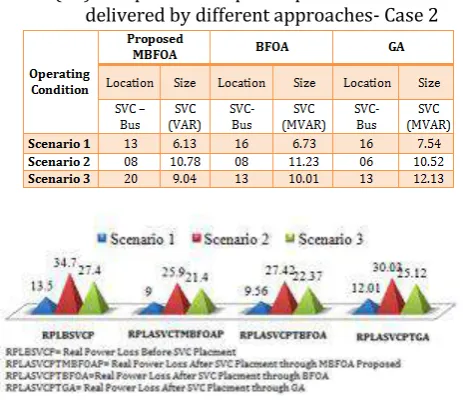
Like in case 1 the validation and efficacy of the proposed approach is illustrated by comparing the results of placements provided by original BFOA and GA. The results are compared with the help of Table 13. The comparative analysis of real power losses for different optimization techniques is illustrated using the figure (7). It can be inferred from the figure the proposed approach delivers the best results in terms of reduction of real power losses.
Table (13) Comparison of optimal placement and sizing delivered by different approaches- Case 2
Figure 6 Plot of real power losses for different scenarios optimized by different approaches –Case 2
In order to have an understanding of the cost of the FACTS devices the cost is computed using (13). The cost function is obtained from [32].The cost analysis is tabulated using table 14 case 1 and table 15 for case 2. It can be inferred from the tables that for both the cases, except for scenario 1 in case 1, the minimum cost of SVC is obtained for placement through the proposed approach.
Table (14) Cost of placement of SVC as optimized by different approaches for different test scenarios in Case
1
Table (15): Cost of placement of SVC as optimized by different approaches for different test scenarios in Case
2
6. CONCLUSION
compared with BFOA and GA for cost and reduction in real power loss.
REFERENCE
[1]. N. G. Hingorani and L. Gyugyi, “Understanding FACTS: Concepts and Technology of Flexible AC Transmission System”, IEEE Press, 2000.
[2]. G W Stagg and A H El-Abid, ‘Computer Methods in Power System Analysis’, McGraw-Hill Book Co, 1968. [3]. Camacho Yuryevich Janson, “Evolutionary
programming based optimal power flow algorithm.” IEEE Trans on Power Systems, 1999; 14(4):1245–50. [4]. Canizares C A and Faur Z T (1999), “Analysis of SVC and TCSC Controllers in Voltage Collapse”, IEEE Trans. on Power Systems, Vol. 14, No. 1, pp. 158-165. [5]. A. H. Sekhar and A. L. Devi, "Voltage profile
improvement and power system losses reduction with multi TCSC placement in transmission system by using firing angle control model with heuristic algorithms," 2016 International Conference on Signal Processing, Communication, Power and Embedded System (SCOPES), Paralakhemundi, 2016, pp. 295-301.
[6]. N. Archana and R. Vidhyapriya, "Location of multi-type facts devices under contingency: An intelligent approach using modified ABC," 2016 International Conference on Advances in Electrical, Electronic and Systems Engineering (ICAEES), Putrajaya, 2016, pp. 477-483.
[7]. I. G. Adebayo, M. A. Bhaskhar, A. A. Yusuff and A. A. Jimoh, "Optimal location identification of FACTS devices through genetic algorithm and the network structural characteristics techniques," 2016 IEEE International Conference on Renewable Energy Research and Applications (ICRERA), Birmingham, 2016, pp. 778-782.
[8]. A. N. Zeinhom, "Optimal sizing and allocation of Unified Power Flow Controller (UPFC) for enhancement of Saudi Arabian interconnected grid using Genetic Algorithm (GA)," 2016 Saudi Arabia Smart Grid (SASG), Jeddah, 2016, pp. 1-6.
[9]. A. S. Telang and P. P. Bedekar, "Systematic approach for optimal placement and sizing of STATCOM to assess the voltage stability," 2016 International Conference on Circuit, Power and Computing Technologies (ICCPCT), Nagercoil, 2016, pp. 1-6. [10].P. P. Kulkarni and N. D. Ghawghawe, "Optimal
placement and parameter setting of TCSC in power transmission system to increase the power transfer capability," 2015 International Conference on Energy Systems and Applications, Pune, 2015, pp. 735-739. [11].A. Sheth, C. D. Kotwal and S. Pujara, "Optimal
placement of TCSC for improvement of static voltage stability," 2015 5th Nirma University International Conference on Engineering (NUiCONE), Ahmedabad, 2015, pp. 1-6.
[12].S. Dixit, G. Agnihotri, L. Srivastava and A. Singh, "An Overview of Placement of TCSC for Enhancement of Power System Stability," 2014 International Conference on Computational Intelligence and Communication Networks, Bhopal, 2014, pp. 1184-1187
[13].D. Shchetinin and G. Hug, "Optimal TCSC allocation in a power system for risk minimization," 2014 North American Power Symposium (NAPS), Pullman, WA, 2014, pp. 1-6.
[14].L. Srivastava, S. Dixit and G. Agnihotri, "Optimal location and size of TCSC for voltage stability enhancement using PSO-TVAC,"2014 Power & Energy Systems: Towards Sustainable Energy, Bangalore, 2014, pp. 1-6.
[15].M. M. Eissa, T. S. Abdel-hameed and H. Gabbar, "A novel approach for optimum allocation of Flexible AC Transmission Systems using Harmony Search technique," 2013 IEEE International Conference on Smart Energy Grid Engineering (SEGE), Oshawa, ON, 2013, pp. 1-6.
[16].Kennedy, J., Eberhart, and R.: “Particle swarm optimization”. In: Proceedings of IEEE International Conference on Neural Networks, pp. 1942–1948 (1995).
[17].Dorigo, M., Gambardella, L.M.: Ant Colony System: “A Cooperative Learning Approach to the Traveling Salesman Problem” IEEE Transactions on Evolutionary Computation 1(1), 53–66 (1999) [18].Holland, J.H.: “Adaptation in Natural and Artificial
Systems” University of Michigan Press, Ann Harbor (1975)
[19].Storm, R., Price, K.: “Differential evolution – A Simple and Efficient Heuristic for Global Optimization over Continuous Spaces “Journal of Global Optimization 11(4), 341–359 (1997)
[20].Passino, K.M. “Biomimicry of Bacterial Foraging for Distributed Optimization and Control”. IEEE Control Systems Magazine, 52–67 (2002)
[21].A. H. Sekhar and A. L. Devi, "Voltage profile improvement and power system losses reduction with multi TCSC placement in transmission system by using firing angle control model with heuristic algorithms," 2016 International Conference on Signal Processing, Communication, Power and Embedded System (SCOPES), Paralakhemundi, 2016, pp. 295-301.
[22].N. Archana and R. Vidhyapriya, "Location of multi-type facts devices under contingency: An intelligent appproach using modified ABC," 2016 International Conference on Advances in Electrical, Electronic and Systems Engineering (ICAEES), Putrajaya, 2016, pp. 477-483.
[23].I. G. Adebayo, M. A. Bhaskhar, A. A. Yusuff and A. A. Jimoh, "Optimal location identification of FACTS devices through genetic algorithm and the network structural characteristics techniques," 2016 IEEE International Conference on Renewable Energy Research and Applications (ICRERA), Birmingham, 2016, pp. 778-782.
[24].A. N. Zeinhom, "Optimal sizing and allocation of Unified Power Flow Controller (UPFC) for enhancement of Saudi Arabian interconnected grid using Genetic Algorithm (GA)," 2016 Saudi Arabia Smart Grid (SASG), Jeddah, 2016, pp. 1-6.
Conference on Circuit, Power and Computing Technologies (ICCPCT), Nagercoil, 2016, pp. 1-6. [26].P. P. Kulkarni and N. D. Ghawghawe, "Optimal
placement and parameter setting of TCSC in power transmission system to increase the power transfer capability," 2015 International Conference on Energy Systems and Applications, Pune, 2015, pp. 735-739. [27].A. Sheth, C. D. Kotwal and S. Pujara, "Optimal
placement of TCSC for improvement of static voltage stability," 2015 5th Nirma University International Conference on Engineering (NUiCONE), Ahmedabad, 2015, pp. 1-6.
[28].S. Dixit, G. Agnihotri, L. Srivastava and A. Singh, "An Overview of Placement of TCSC for Enhancement of Power System Stability," 2014 International Conference on Computational Intelligence and Communication Networks, Bhopal, 2014, pp. 1184-1187
[29].Selvarasu, M. Surya kalavathi.C “SVC placement for voltage constrained loss minimization using self-adaptive firefly algorithm”, Archives of electrical engineering, vol.62(4),pp. 649-661 (2013)
[30].Matpower Version 5.1 user manual
[31].https://www2.ee.washington.edu/research/pstca/ [32].Biplab Bhattacharyya, Vikash Kumar Gupta, Sanjay
Kumar, UPFC with series and shunt FACTS controllers for the economic operation of a power system, Ain Shams Engineering Journal, Volume 5, Issue 3, 2014, Pages 775-787
[33].T. N. V. L. N. Kumar, Dr. R. V. S. Satyanarayana, “Optimal Location and Sizing of UPFC to Enhance Power System Security Using Modified BFOA”, Current Trends in Technology and Science (CTTS), Volume: 6, Issue: 3, pp. 720-726.
[34].T. N. V. L. N. Kumar, Dr. R. V. S. Satyanarayana, “Enhancing Power System Security through Optimal Location and sizing of TCSC through Modified BFOA”, Journal of Advanced Research in Dynamical and Control Systems (JARDCS), Issue:17
[35].T. N. V. L. N. Kumar, Dr. R. V. S. Satyanarayana, “A Modified BFOA Approach for Optimal location and Sizing of FACTS for Enhancing Power System Security”, i-manager's Journal on Power Systems Engineering (JPS), Aug-Oct,2017.
[36].T. N. V. L. N. Kumar, Dr. R. V. S. Satyanarayana, “Validation of Modified BFOA for Optimal Location and Sizing of SVC to improve Power System”, Journal of Instrument Society of India (JISOI),September,2017.
[37].T. N. V. L. N. Kumar, Dr. R. V. S. Satyanarayana,“ A Robust and Cost reduction Technique based on Multi-objective SVC for Enhancement of Power System Security”, International Journal of Current Advanced Research (IJCAR), Accepted for November,2017. [38].T. N. V. L. N. Kumar, Dr. R. V. S. Satyanarayana,
“Enhancing Power System Security – A Multi-objective Optimal Approach to Identify Location and Sizing of SVC”, IUP-Journal of Electrical and Electronics Engineering (IUP-JEEE), Accepted for Jan, 2017.
Author’s Profile
(1) Prof. T. N. V. L. N. Kumar Completed B. Tech in Electrical & Electronics Engineering from NBKR IST, Vidyanagar, Affiliated to S V University, Tirupati.
He got his M. Tech in Power Systems from SVUCE and registered Ph. D with S V University. He is working as Professor and HOD EEE in Geethanjali Institute of Science and Technology, Nellore and having over 30 years of teaching experience. He has published 4 papers in reputed International journals and conferences.
(2) Dr. R. V. S. Satyanarayana Professor, Department of ECE, S.V.U.C.E, Tirupati. He completed his Ph. D in the year 2003. He has got over 30 years of teaching and Research experience. He got best paper awards in two National conferences.