M E T H O D O L O G Y
Open Access
Automated nutrient screening system enables
high-throughput optimisation of microalgae
production conditions
Khairul Adzfa Radzun
1,2†, Juliane Wolf
1†, Gisela Jakob
1, Eugene Zhang
1, Evan Stephens
1, Ian Ross
1and
Ben Hankamer
1*Abstract
Background:Microalgae provide an excellent platform for the production of high-value-products and are increas-ingly being recognised as a promising production system for biomass, animal feeds and renewable fuels.
Results:Here, we describe an automated screen, to enable high-throughput optimisation of 12 nutrients for micro-algae production. Its miniaturised 1,728 multiwell format allows multiple micromicro-algae strains to be simultaneously screened using a two-step process. Step 1 optimises the primary elements nitrogen and phosphorous. Step 2 uses Box-Behnkenanalysis to define the highest growth rates within the large multidimensional space tested (Ca, Mg, Fe, Mn, Zn, Cu, B, Se, V, Si) at three levels (−1, 0, 1). The highest specific growth rates and maximum OD750values
provide a measure for continuous and batch culture.
Conclusion:The screen identified the main nutrient effects on growth, pairwise nutrient interactions (for example, Ca-Mg) and the best production conditions of the sampled statistical space providing the basis for a targeted full factorial screen to assist with optimisation of algae production.
Keywords:Algae, Nutrient, Biomass, Screening, High-throughput, Growth
Background
Microalgae provide the biotechnology industry with an excellent platform for the production of a broad range of high-value products (for example, pigments, unsaturated fatty acids and expressed proteins), animal and aquacul-ture feeds and also represent a rapidly advancing tech-nology for the production of biocommodities like biomass feedstocks for renewable fuel production (for example, oil-based fuels, methane, alcohols and hydro-gen). Increasing the economic viability of production re-quires process optimisation, and a key aspect of this is maximising biomass quality and yield (that is, maximum growth rate and total biomass concentration).
The development of improved growth media for microalgae is an important aspect of this strategy. The significance of nutrient optimisation is highlighted by
the fact that microalgae have adapted to a diverse range of environments (for example, varying C, N and P source and concentration) and so are likely to have dif-ferent nutrient requirements. The bioavailability of each respective element also depends significantly on factors such as solubility, chemical speciation (for example, Fe2+ and Fe3+), pH, ionic strength, inorganic anions, chelates or interaction with other elements (for example, the for-mation of Ca3(PO4)2precipitates). Nutrients must there-fore be supplied in a bioavailable form, and while nutrient deficiencies can limit culture growth and/or health, the supply of excess nutrients can result in nutri-ent wastage (for example, opportunistic P uptake), toxic effects and additional waste streams. Nutrient optimisa-tion therefore impacts economic and environmental sus-tainability as well as the overall energy balance of the system.
Given the broad biodiversity of microalgae and the wide range of conditions that they grow under, it is not surprising that their elemental composition varies. * Correspondence:[email protected]
†Equal contributors 1
Institute for Molecular Bioscience, The University of Queensland, St Lucia, Queensland 4072, Australia
Full list of author information is available at the end of the article
Carbon is reported to be the most abundant element in biomass (approximately 40% to 60% of the ash-free bio-mass) being a component of most biomolecules, and can be provided in the form of CO2 (for photoautotrophic, photoheterotrophic and mixotrophic growth regimes) and/or organic carbon forms such as acetate (for mixo-trophic, photoheterotrophic and heterotrophic growth modes). Oxygen, also a component of most biomolecules, is thought to be the next most abundant element (for example, approximately 12% to 29%) [1] of biomass and is an integral part of most biomass components includ-ing proteins, carbohydrates and oils. The macroele-ments N (approximately 7% of biomass), S and P (approximately 1% of biomass) [2] are mainly involved in protein and nucleic acid synthesis as well as regula-tory pathways in the cell and are indispensible. Mg is a major component of chlorophylls and a co-factor for enzymes while Ca is part of the water oxidizing complex of photosystem II an important element in the CO2 fix-ation process and involved in ion transport and intracel-lular signalling [3]. K, Na and Cl are prominent in the cytoplasm and play key roles in osmoregulation [4]. Mi-croelements (trace elements) are also often required as co-factors (for example, for enzymes and cell signalling). They include Fe, Cu, Mn, Mo and V which can exist in multiple stable oxidation states and so take part in redox chemistry [5]. Mo and V are relatively soluble as oxy-anions and are important co-factors in enzymes of S and N metabolism [5]. Zn and Co provide additional catalytic capacity. Zn acts as a co-factor in many en-zymes and supports the function of transcription fac-tors, and its concentration may be regulated in part by metallothioneins [6]. Co is a constituent of both of vita-min B1 and B12 co-enzymes, which are involved in a range of metabolic reactions [5-7]. Silicon is an abun-dant element but is not generally found at high levels in biology due to the insolubility of its oxides or hydrox-ides. Nevertheless, Si is important for specific algae (such as diatoms) that build up hard Si-rich cell walls (frustules) [8]. Fe is also an essential micronutrient for all living organisms primarily because it can efficiently accept and donate electrons (for example, reduction/ oxidation of Fe-S clusters). In this context, Fe plays a crucial role in electron transport processes such as res-piration and photosynthesis. Fe-containing proteins are also directly involved in nitrate and nitrite reduction, chlorophyll synthesis and the detoxification of O2 radi-cals [9,10]. In summary then, each of these elements will be required in a suitable concentration range and bio-available form and the optimisation of these conditions has been conducted in agriculture and horticulture over centuries.
In terms of algae production, growth media have until now largely been based on the following:
1. The results of elemental analysis of biomass [11] 2. Flask scale trials and complete statistical screens of
selected variable (for example, N and P) [12].
Both of these approaches are theoretically suboptimal. First, basing media formulations on elemental analysis of biomass is no guarantee that optimal conditions will be achieved, as the original biomass analysed, may itself have been produced under suboptimal conditions such as nutrient limitation or excess. Second, the use of complete factorial analysis of a few selected variables fails to identify the theoretical optimum of production. For example, single nutrient analysis (for example, of N) misses the role of potential interactions between other nutrients (for example, Ca and P) [5,11-15], and further-more, micronutrient requirements may vary under dif-ferent growth conditions.
A third approach involves the use of a full factorial screen. This would provide a statistically valid analysis but is limited by the fact that the optimisation of the 21 most commonly used macro- (C, N, P, K, Ca, Mg, S, Na, Cl) and microelements (Fe, Mn, Zn, Cu, B, Mo, Si, Se, V, Co, Ni, I) (excluding additional commonly used amino acids, vitamins and/or other additives) at even three dif-ferent concentrations would require 321 experiments = 10,460,353,203). Clearly, this is an impractically large set of variables to analyse which would have to be increased further if proper consideration was given to nitrogen type (for example, NO3-, NH4+ or urea), different carbon forms (for example, glucose or acetate) to support photoheterotrophic, mixotrophic or heterotrophic growth and other supplements (for example, vitamins). Yet despite this, failure to analyse this full and complex statistical space is likely to result in the inability to iden-tify optimal conditions.
Here, we report an advanced miniaturised high-throughput robotic screen designed to identify the best nutrient conditions within this complex multidimen-sional statistical space and is suitable to analyse a broad range of microalgae species. The screen contains the above 21 mineral elements and vitamins B1and B12and focuses on the statistical optimisation of 12 of the most important of these. These include the 12 macro- (N (that is, NO3−, NH4+ and urea), P, Ca, Mg) and microele-ments (Mn, Zn, Cu, B, V, Si, Fe, Se) with the remaining nutrients provided in reportedly replete levels at 1% CO2 concentration (near optimal, though this can be adjusted).
2. A total of 246 trials (for Steps 1 and 2) were per-formed for each strain analysed. Specifically, the system is designed to measure growth curves based on optical density at 750 nm (OD750, a proxy measure for bio-mass) to measure maximum growth rates (as a model for continuous culture) and total biomass yield (as a model of batch culture) (Figure 1). The measurement of growth rate was the usual approach, and based on this, the statistical performance of each condition was evaluated to identify,
1. the best nutrient mix for a given algae cell line, 2. the best concentration range for each nutrient (that
is, limiting, sufficient and toxic levels of supply) which has operational importance for scale up, and 3. positive and negative statistical nutrient interactions
that affect microalgae biomass production.
The screen therefore provides an excellent basis for next phase targeted full factorial screens under scaled up conditions on the path to commercial process opti-misation for efficient biomass production.
Results and discussion
Two-step nutrient screening matrix design
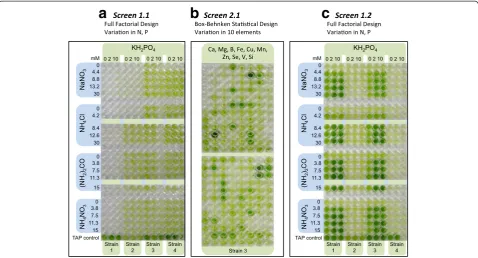
The layouts of the Screens 1 and 2 matrices used to identify the best nutrient mixtures for a single species are shown in Figure 2a, b, respectively. The Screen 1 ‘matrix unit’consists of 63 microwells. Thismatrix unit
was copied 24 times across the eighteen 96-well plates
to construct the full ‘24 unit Screen 1 matrix’ that formed a full 1,512-well screen run (Figure 1b). The 24
unit Screen 1 matrix enables 24 individual species (or 8
species in triplicate) to be analysed simultaneously. The Screen 2 ‘matrix unit’consists of 183 microwells (180 screen solutions and 3 internal Tris-acetate-phosphate (TAP) controls). TAP is a standard medium for chlorophytes and contains acetate which can be metabolised by most microalgae, thereby allowing mixo-trophic growth. Mixomixo-trophic growth generally yields higher growth rates than photoautotrophic growth pro-viding a positive control. It was copied 9 times across the eighteen 96-well plates to construct the full ‘9 unit Screen 2 matrix’that formed a full 1,647-well screen run (Figure 1b). The 9 unit Screen 2 matrix enables 9 indi-vidual species (or 3 species in triplicate) to be analysed simultaneously.
The full factorial Screen 1 (Figure 2a) consists of three phosphate (KH2PO4) concentrations (0, 2 and 10 mM) and five nitrogen concentrations for NaNO3(to identify NO3− utilising strains), NH4Cl (to identify NH4+ utilising strains), NH4NO3 (to identify NH4+ and NO3− utilising strains) and urea (NH2)2CO (to identify strains that can use this alternative cheaper nitrogen source). The values of 0, 2 and 10 mM KH2PO4 were selected to provide phosphate-limited conditions (0 mM), an average litera-ture value (2 mM) (Additional file 1: Table S3) and ex-cess phosphate (10 mM) (see ‘Materials and methods’). A similar approach was taken to set the N concentra-tions in Screen 1, for the N sources NaNO3, NH4Cl,
NH4NO3and (NH2)2CO. All other nutrients were set as described in Table 1 to reflect average literature values.
Preliminary screening using macronutrients
Eight randomly selected algae strains were screened
(Micractinium inermum (18-1), Ankistrodesmus gracilis
(18-2),Rhombocystis complanata(SF-150),Chlorella
sor-okiniana (21), Monoraphidium convolutum (9-FW), C.
pyrenoidosa (22), M. reisseri (13), Podohedriella falcate
(4A-1)) using a preliminary Screen 1 (Screen 1.1). The results of four of these are shown as a photographic profile after 72 h of incubation in Figure 2a. The growth rate in all of the photoautotrophic conditions tested was very much lower than that of the TAP control. As CO2 was provided as a 1% CO2:Air (v/v) mixture, this sug-gested that nutrient(s) other than CO2, N and P might be present either in limiting or inhibitory concentra-tions despite being based on average literature values.
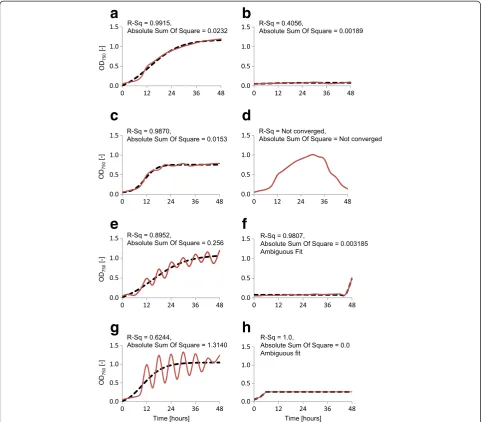
Growth curve fitting
The parallel acquisition and screening of approximately 1,700 growth curves requires automation and robust quality control to ensure that the maximum specific growth rates are as accurately defined as possible for
conditions were eliminated from the final analysis. Figure 6e depicts a growth curve with an intermediate strength circadian rhythm or intermittent flocculation, while Figure 6g shows a stronger circadian rhythm/inter-mittent flocculation pattern. Figure 6f, h is an example of curves yielding ambiguous fits. These were manually ex-cluded from further analysis based on the low max OD750.
Automated sampling and data analysis
Table 2 shows the three highest growth rates (in bold) obtained for the eight species tested and the N and P conditions under which these were obtained. Closer ana-lysis shows that the relative standard deviation (RSD) is well below 5% and sometimes below 1% between bio-logical replicates. Typically, manual OD measurements yield approximately 10% error levels between biological replicates. The low standard deviations achieved in this automatic screen were due to three factors. First, auto-mating nutrient solution preparation reduced dispensing errors. Second, optical density measurement errors were also reduced through automation. Third, the process of automation enabled the collection of a large number of data points (24 for each experiment) which improved the statistical curve fit used to calculate the μmax value
for each experiment condition. The RSD values there-fore reflect these collective improvements over manual analysis.
It should be noted that the process of automated OD measurement requires the robotic removal of the lid of each 96-microwell plate within the cultivation chamber for a period of 2.7 min per measurement (once every 3 h). As a result, it is not possible to completely elimin-ate evaporation. However, the reduction of the optical path length through evaporation is compensated for by the concomitant increase cell concentration. Regardless, to minimise these effects, the μmaxvalues were typically calculated during the first 24 to 48 h of the experiment. It is of note that despite these small evaporative losses, the RSD values are significantly lower than can be achieved through manual measurement (see above). As the automation process enables the analysis of 1,728 samples simultaneously and the RSD values are low, it is concluded that it is an acceptable compromise.
Strain performance
The specific growth rates of the eight microalgae strains tested using Screen 1.1 (Figure 2a) were well below the μmax in TAP media (0.14 to 0.23 h−1). Consequently, a
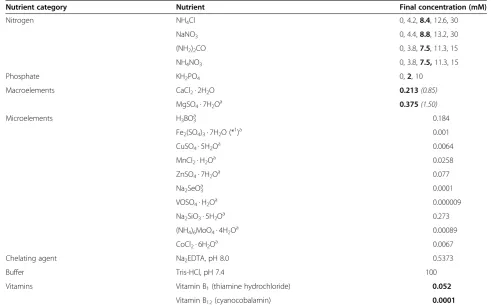
Table 1 Nutrient formulation of the Screen 1 system
Nutrient category Nutrient Final concentration (mM)
Nitrogen NH4Cl 0, 4.2,8.4, 12.6, 30
NaNO3 0, 4.4,8.8, 13.2, 30
(NH2)2CO 0, 3.8,7.5, 11.3, 15
NH4NO3 0, 3.8,7.5,11.3, 15
Phosphate KH2PO4 0,2, 10
Macroelements CaCl2· 2H2O 0.213(0.85)
MgSO4· 7H2Oa 0.375(1.50)
Microelements H3BO3a 0.184
Fe2(SO4)3· 7H2O (*1)a 0.001
CuSO4· 5H2Oa 0.0064
MnCl2· H2Oa 0.0258
ZnSO4· 7H2Oa 0.077
Na2SeO3a 0.0001
VOSO4· H2Oa 0.000009
Na2SiO3· 5H2Oa 0.273
(NH4)6MoO4· 4H2Oa 0.00089
CoCl2· 6H2Oa 0.0067
Chelating agent Na2EDTA, pH 8.0 0.5373
Buffer Tris-HCl, pH 7.4 100
Vitamins Vitamin B1(thiamine hydrochloride) 0.052
Vitamin B12(cyanocobalamin) 0.0001
The average nutrient concentrations based on the literature analysis (Additional file1: Table S3) are indicated in bold fonts. Refined nutrient concentrations after iterative cycling of nutrient screens are indicated in italic fonts.a
Nutrient elements were prepared asBasal Mediumfor 5000 tests. (*1
screen including micronutrients (Screen 2) was con-ducted to identify additional limiting nutrient factors.
For this purpose, the three best performing microalgae strains,M. convolutum(9-FW),M. reisseri(13) andP. fal-cate(4A-1) were chosen. They were tested in Screen 2 in triplicate using 4.2 mM NH4Cl and 10 mM KH2PO4for
strains M. convolutum (9-FW) and M. reisseri (13) and 30 mM NH4Cl and 10 mM KH2PO4for strainP. falcate
(4A-1) as the starting point. These Screen 1 formulations yielded specific growth rates of 0.061 h−1, 0.083 h−1 and 0.059 h−1for strains M. convolutum (9-FW), M. reisseri
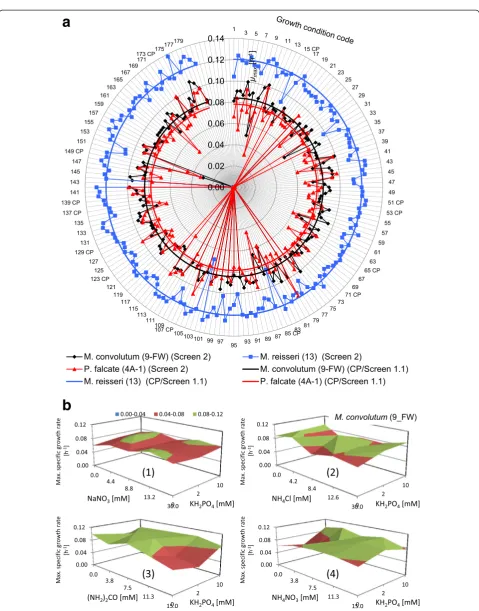
(13) andP. falcate(4A-1), respectively. The best condition (See figure on previous page.)
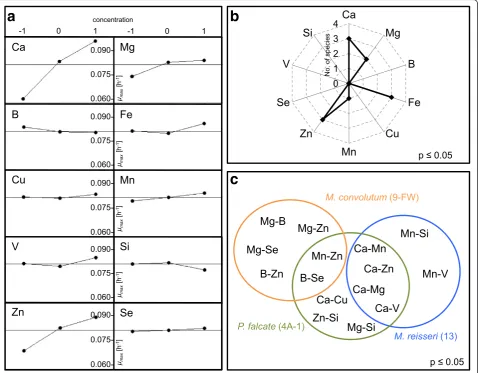
Figure 3Radial plots of the highest specific growth rates ofM. convolutum(9-FW) (black),M. reisseri(13) (blue) andP. falcate(4A-1) (red) in 180 Screen 2 conditions (a) and growth rate analysis forM. convolutum(9-FW) in the subsequent Screen 1.2 (b).(a)The radial plot displays the highest specific growth rateμmax(h−
1
) for each condition indicated by the distance of a given data point from the centre of the plot. The radial plot shows growth rate data of Screen 1.1 in comparison to Screen 2 to visualise the growth performance improvement. The growth rate performance of three key strains in Screen 2 was much higher than in Screen 1.1.(b)Surface chart of the growth rate data analysis in Screen 1.2. The growth rate data are shown as a function of the nitrogen (N) and phosphate (P) concentration exemplary forM. convolutum(9_FW) in individual plots for media containing NaNO3(1), NH4Cl (2), (NH2)2CO (3) and NH4NO3(4) as nitrogen source.
identified in Screen 1 forms the centre point (CP) of Screen 2 (‘Material and methods’) and acts as the baseline reference for Screen 2.
Figure 2b shows a photographic overview of Screen 2 at the 72-h endpoint. The two key points to note are that the 180 condition Screen 2 Box-Behnken analysis yielded a broad range of different growth rates and final biomass densities (light to dark green) and that some of the conditions tested yielded culture densities much closer to those obtained with the TAP control than was achieved in Screen 1.1. Based on these results, all of the curves were individually subjected to the curve fit quality control analyses (see Figure 6) and specific growth rates were then determined for each of the 180 Screen 2 conditions tested. Figure 3 summarises this information as a radial plot of the average (triplicate) specific growth rates (h−1) obtained for the three strains (M. convolutum(9-FW) (black),M. reisseri(13) (blue) andP. falcate(4A-1) (red)) for each of these 180 conditions. The first point of note is that the average of the Screen 2 specific growth rates is the same as the best conditions obtained in Screen 1. This is because 20 of the Screen 2 conditions are identical with the best conditions from Screen 1 and are used as the midpoint controls (centre points). Closer analysis also shows that several conditions yielded growth rate values significantly above (0.108 h−1, 0.138 h−1, 0.119 h−1forM. convolutum
(9-FW),M. reisseri(13) andP. falcate(4A-1), respectively) this midpoint (0.084 h−1, 0.12 h−1, 0.078 h−1for
M. convo-lutum(9-FW), M. reisseri(13) and P. falcate(4A-1), re-spectively) and much closer to the positive TAP controls (0.193 h−1, 0.2 h−1, 0.175 h−1for
M. convolutum (9-FW),
M. reisseri (13) and P. falcate (4A-1), respectively). The
best conditions obtained for the three strains are sum-marised in Table 3.
Main and interacting element effects
Next, the highest specific growth rate values from the Screen 2 trials were subjected to Main effects (pvalue) analysis using Minitab (Figure 4a). For a given element (for example, Ca), this analysis involved as follows: 1) The clustering of all conditions with low calcium (−1), medium calcium (0) and high calcium (1) concentra-tions; and 2) Calculating the average specific growth rate and standard deviation of each of these−1, 0 and 1 clus-ters and determining whether there is a significant dif-ference between them (p≤0.05). In the case of calcium (Figure 4a), it can be seen that at higher concentrations (1), higher growth rates are achieved than at lower con-centrations (−1). A similar analysis was conducted for Ca, Mg, Fe, Cu, Mn, B, V, Si, Zn and Se (Figure 4a) for all eight species. The statistical analysis showed (Figure 4b) that of the eight strains tested, calcium had a significant effect for three strains as did Fe and Zn, while Mg affected two of eight (strains M. convolutum
(9-FW) and M. reisseri (13)). The system is also de-signed to analyse pairwise interactions using Minitab (Figure 4c). Such analysis can identify a number of po-tential species/nutrient mix specific effects (for example, Mg-Zn in M. convolutum (9_FW)) or interactions com-mon to more than one species (for example, Ca-Mg for
P. falcate(4A-1) andM. reisseri(13)).
Performance improvements through nutrient optimisation
The statistical Main and Interaction Effects analyses of Screen 2 as well as the analyses of its individual media compositions resulting in improved growth determined that Ca, Mg, Zn and Mn were for some species being supplied at insufficient levels. To establish proof of principle of the utility of the nutrient screen and to test whether the adjustment of Ca and Mg (highest and most frequent significance) in Screen 1 would result in signifi-cant improvement in the observed maximum specific growth rates, Screen 1.2 was tested. It differed from Screen 1.1 in that it used a fourfold increase of Ca (raised from 0.213 to 0.85 mM) and Mg (raised from 0.375 to 1.5 mM as the new baseline concentration (Table 2). The same eight microalgae strains tested in Screen 1.1 were then tested in Screen 1.2.
All strains showed better photoautotrophic growth performance in Screen 1.2 than in Screen 1.1 as shown in (Figure 5).
As expected, photoautotrophic growth rates were still below the photoheterotrophic rates (TAP controls). Most microalgae strains preferred media containing 3.8 mM NH4NO3as the nitrogen source, and this also Figure 5Improvement of photoautotrophic growth performance.
yielded the highest OD750after 72 h of cultivation (end-point). Most strains were also able to grow in all tested nitrogen sources supplied in the Screen 1.2 and growth trends seemed to be directly correlated to nitrogen and phosphate concentration levels (Figure 3b). The pre-ferred phosphate concentrations varied between 2 and 10 mM, perhaps reflecting the capacity of the different algal strains to store phosphate intracellularly. The ma-jority of strains, however, required only 2 mM phos-phate (KH2PO4) to achieve high endpoint OD750values.
In Screen 1.2, NH4+salts are observed to be the most readily accessible and energy efficient (requiring less
energy for assimilation) source of nitrogen [16] al-though at high concentration, it can cause toxicity [17-19] and variation in pH. This may also be due to pre-adaptation of the algae to TAP media (maintenance media of the strains), which contains NH4+ as nitrogen source. However, the two strains C. pyrenoidosa (22)
and P. falcate(4A-1) showed good growth in NH4+ but
grew best in urea ((NH2)2CO) despite pre-adaptation to NH4Cl from TAP media. StrainsM. inermum(18-1),
A. gracilis (18-2), C. sorokiniana (21) and M. reisseri
ammonium concentration is low enough to avoid tox-icity, but the nitrate still provides excess capacity on ammonium depletion.
Ca and Mg
The Screen 1.2 experiments demonstrated that reformu-lation of calcium and magnesium (based on Screen 2 re-sults) can increase the performance of the microalgae in both growth rate and endpoint OD750. In the future, re-optimisation of nutrients such as zinc and manganese, bioprospecting of new strains and pre-adaptation of the current microalgae strains with the improved media followed by re-screening and re-evaluation of physical cultivation parameters (optimisation of CO2 level, temperature and light intensity) are some approaches that may generate further improvements in growth rate and biomass accumulation that maximises photoauto-trophic growth potential.
The significance of calcium and magnesium for pho-toautotrophic microalgal growth is interesting, as they
are important elements in the microalgal photosyn-thetic apparatus. Calcium is part of the water oxidizing complex [3] of photosystem II and an important elem-ent in the CO2 fixation process in the Calvin-Benson-Bassham cycle (CBB cycle, reductive pentose phosphate cycle) which is the metabolic pathway that connects photosynthetic energy production to the conversion of at-mospheric CO2 into organic compounds [20]. Calcium may also be involved in ion transport [21], which is im-portant in nutrient uptake, and physico-chemical pro-cesses such as buffering, precipitation or interactions with toxic components. Magnesium, on the other hand, accounts for 2.7% of the molecular weight of chlorophyll and is necessary for chloroplast structure [22] involving the formation of grana from the thylakoid stacks [23]. Magnesium is also involved in chloroplast synthesis and in microalgal metabolism (it occurs in many cellular en-zymes such as RNA polymerase, ATPases, protein kinases, phosphatases, glutathione synthase and carboxylases). Appropriate formulation of calcium and magnesium
Table 3 Specific growth rates and best medium composition in Screen 2
Strain Highestμmax
[h−1]
Centre point
μmax[h−1]
TAP control
μmax[h−1]
Improvement over Screen 1.1 (%)
Medium with highestμmax
Element variation in best media
M. convolutum
(9-FW)
0.108 ± 0.010 0.080 ± 0.008 0.191 ± 0.005 44 177 Ca (+1), Mn (+1), B (−1),
V (−1)
M. reisseri(13) 0.138 ± 0.016 0.118 ± 0.004 0.200 ± 0.021 40 175 B (+1), Fe (+1), Si (+1), Cu (−1)
P. falcate(4A-1) 0.119 ± 0.017 0.077 ± 0.008 0.175 ± 0.012 50 79 Ca (+1), Fe (+1), Zn (+1), Se (+1)
Algal strains were cultivated in triplicates.
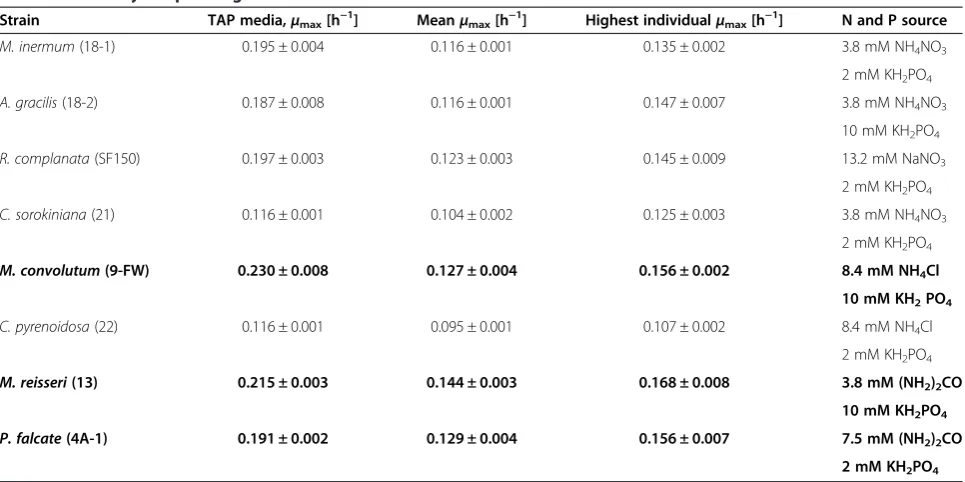
Table 2 Summary of specific growth rates of Screen 1.2
Strain TAP media,μmax[h− 1
] Meanμmax[h− 1
] Highest individualμmax[h− 1
] N and P source
M. inermum(18-1) 0.195 ± 0.004 0.116 ± 0.001 0.135 ± 0.002 3.8 mM NH4NO3
2 mM KH2PO4
A. gracilis(18-2) 0.187 ± 0.008 0.116 ± 0.001 0.147 ± 0.007 3.8 mM NH4NO3
10 mM KH2PO4
R. complanata(SF150) 0.197 ± 0.003 0.123 ± 0.003 0.145 ± 0.009 13.2 mM NaNO3
2 mM KH2PO4
C. sorokiniana(21) 0.116 ± 0.001 0.104 ± 0.002 0.125 ± 0.003 3.8 mM NH4NO3
2 mM KH2PO4
M. convolutum(9-FW) 0.230 ± 0.008 0.127 ± 0.004 0.156 ± 0.002 8.4 mM NH4Cl
10 mM KH2PO4
C. pyrenoidosa(22) 0.116 ± 0.001 0.095 ± 0.001 0.107 ± 0.002 8.4 mM NH4Cl
2 mM KH2PO4
M. reisseri(13) 0.215 ± 0.003 0.144 ± 0.003 0.168 ± 0.008 3.8 mM (NH2)2CO
10 mM KH2PO4
P. falcate(4A-1) 0.191 ± 0.002 0.129 ± 0.004 0.156 ± 0.007 7.5 mM (NH2)2CO
2 mM KH2PO4
concentrations are therefore important for core meta-bolic and photosynthetic processes in the microalgal cells and can influence growth performance. From the literature, it was not predicted that these would be the most crucial nutrients to be found. Clearly, much more targeted experiments are required to identify the na-ture of these nutrient effects and interactions.
Screen performance
The system defined optimal search spaces of nutrient concentrations and combinations and identified poten-tial nutrient interactions and nutrient toxicity. The spe-cific growth rates obtained are in broad agreement with the larger scale cultivation values reported in the litera-ture [24]. The system was validated in terms of well-to-well variability (repeatability test by using Cronbach’s alpha analysis of 92% to 96% accuracy), run-to-run vari-ability (reproducibility test standard deviation of 2.1% to 16.9% accuracy) and with respect to potential artefacts such as edge effects through evaporation. The data valid-ity was found to be within the satisfactory error range. The best nutrients blend for each strain, and the corre-sponding nutrient main effects and interactions identi-fied provided solid basis for further full factorial refinement of additional variables such as light quality and intensity and CO2concentration in scaled up sys-tems better suited for this purpose.
Future optimisation
Lag phase reduction
In suitable media conditions, the lag phase lasted ap-proximately 6 to 9 h prior to log growth phase. The lag phase length is dependent on species, the metabolic state of the cells as well as photoinhibition, and could potentially be reduced by using improved pre-culture conditions for individual species.
Nutrient range optimisation
An important consideration is the nutrient concentra-tion range covered between the−1 and +1 conditions of the Box-Behnkenanalysis. Initially, the default condition was to use half (−1) or twice (+1) the average concentra-tion. However, unlike the macronutrient case, it is pos-sible that optimal ranges of micronutrients can vary by orders of magnitude, so that much wider ranges should be investigated in future designs. Future rounds of screening with wider micronutrient ranges may be re-quired to uncover these ranges for specific situations. However, based on Screens 1.2 and 2 as well as main ef-fects and pairwise interaction analysis, the optimisation space can be greatly reduced and the analysis of these variables ranked according to their relative importance.
Conclusions
While a range of statically optimised processes have been reported [25-27], these have only been tested using small experimental arrays (for example, approximately 16 to 20 experiments). The new miniaturised and auto-mated 1,728 multiwell Screenformat presented here has enabled the analysis of a large multidimensional space (Screen 1: N and P full factorial; Screen 2: ten elements at three concentrations) for nutrient sufficiency (and minimisation of toxic effects) at three levels. The broad statistical space sampled (310= 59,049 full factorial con-ditions) was compressed 328-fold and successfully ana-lysed using an incomplete factorial Box-Behnken design and required only 246 trials per cell line. This analytical method is therefore a powerful tool that can provide greatly improved data matrices over those reported to date. Furthermore, it yielded the main effects (for ex-ample, main nutrient effects on growth), identified
pair-wise nutrient interactions (for example, Ca-Mg) and
provided the basis for a smaller targeted full factorial screen-set to assist with optimisation of algae production processes for scale up in terms of energy balance and economic return. The further integration of photo-graphic recording, FACS analysis and FTIR screening opens up the opportunity to extend analyses to factors affecting cell aggregation, cell division and metabolic pathways. The rates obtained compare favourably with those reported in the literature [24]. This can be ex-plained by near optimal nutrient provision under condi-tions in which light and CO2 are not limiting low cell concentrations and thin cultures [28].
Material and methods High-throughput screen design
The nutrient screen was designed to provide a minia-turised, automated, high-throughput platform for rapid low-cost optimisation of nutrient conditions. The 96-well micro96-well plate format was chosen as a basis for the design as it provides future flexibility to expand sample scaling (for example, 384-, 96-, 48-, 24-, 12-and 6-well) as well as array scalability (for example, from the current eighteen 96-well plates = 1,728 wells) while achieving acceptable errors associated with miniaturisation.
differentiate between algae, bacterial or fungal bio-mass, detritic compounds or algal exudates, the use of axenic algae cell cultures eliminated most of these complications. Subsequent further precision testing of high-performance conditions identified during the screen can be conducted to deliver higher precision if required. However, as OD750 is based on light scatter-ing, it is influenced by cell size. For the purposes of this broad screen, it is therefore necessary to assume that cell size does not vary significantly over the duration of the experiment. This is clearly an approximation. How-ever, the screens were species specific (measuring intra-species variance related to nutrient effects) and the average cell size of most algae species do not vary more than two- to threefold in diameter throughout the growth cycle. Unless synchronised, this is the case for most populations containing a mixture of cell sizes [30]. Cultivation was conducted for 75 h or less to min-imise evaporation effects. A second-generation system design could potentially incorporate additional checks for accuracy of biomass estimation.
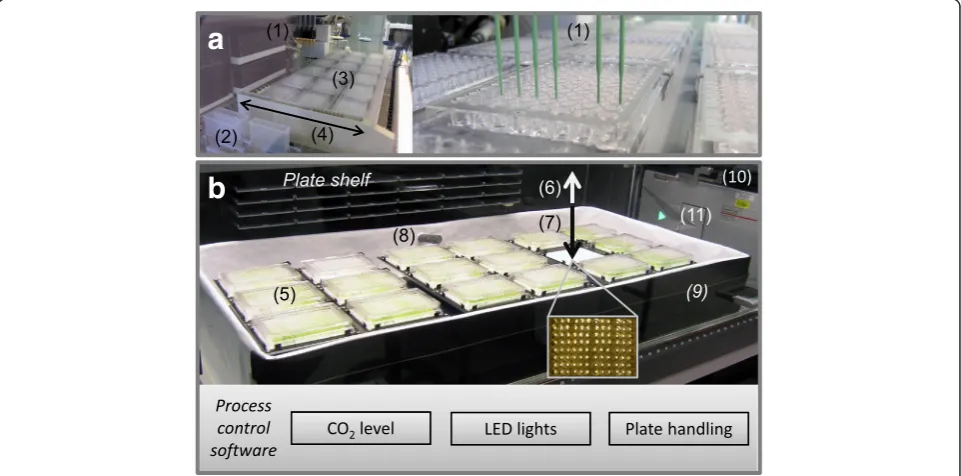
Automated media preparation
A Tecan robot (Freedom Evo 150, Tecan Group Ltd., Männedorf, Switzerland) (Figure 1a) equipped with a li-quid handling arm (1) was used to accurately dispense the nutrient screen matrix stock solutions into 1,728 wells. The liquid handling arm (1) dispenses the stock solutions from a set of 100-mL troughs (2) into eighteen 96-well plates placed on two platforms (3) to generate the nutrient blend matrices required for growth trials. A large trough (4) located between the troughs (2) and platform (3) was used to wash the tips between the dis-pensing steps of different nutrients. The dispensed nu-trient plates were then gamma sterilised at a dose of 2 k-Gy. Microwell plates containing the media were wrapped in cling film and were stored at −20°C until used. A filter sterilised vitamins B1 and B12 solution (Acrodisc 0.22-μm filter) was added to the gamma steri-lised media together with the microalgae inoculum (see Additional file 1: Figure S2, S3 and Additional file 1: Table S2).
Automated growth chamber
System layout
A second Tecan system (Tecan Freedom EVO 150 ro-botic workstation, Tecan Group Ltd., Männedorf, Switzerland) was configured and further developed into an automated microalgae growth chamber (Figure 1b). Specifically, it was fitted with three orbital shakers (IKA KS 130 Control microwell plate shakers, IKA Werke GmbH & Co., KG, Staufen, Germany), each holding six 96-well microwell plates (5), enabling the use of a total of eighteen 96-well plates (1,728 samples). The system
was operated at room temperature and during the ex-periment remained within a range of 23°C ± 0.5°C.
Illumination
Controlled top illumination (Figure 1b (6)) and bottom illumination (7) have been integrated into the system, with capacity for both continuous illumination and day/ night cycling. The top illumination system was designed to closely match the visible part of the solar spectrum. It consists of alternating fluorescent lights (12 Cool white Phillips PL-L55W/840 Cool White, Philips International B.V., Amsterdam, Netherland, and 11 Philips PL-L55W/ 830 Warm White lights, Phillips International B.V., Amsterdam, Netherland). The fluorescent light sources extend beyond the whole cultivation area and were posi-tioned over approximately 1.5 m above the microwell plates, to ensure even illumination. Uniformity of illu-mination across the full cultivation area was confirmed through detailed light meter measurements and achieved a maximum light intensity of 450μmol photons m−2s−1 at the microwell plate level.
Below the microwell plates, a customised diode array lighting system was also fitted (see Figure 1b insert). This illumination system positioned one light-emitting diode (SMD 3020, Epistar, Hsinchu City, Taiwan) below each well of each 96-well plate (LEDs are rated to +/−5%). The maximum illumination intensity is approximately 3,000 μmol photons m−2 s−1 and can be adjusted be-tween 0% and 100% of maximum intensity in 1% incre-ments. This ability to vary light intensity enables‘dynamic’ day/night cycling. Programs coded in Arduino© (Arduino SA) provide the ability to run: (1) A fixed light cycle, (2) A day/night cycle with light flux changing at manually set time increments (for example, 5% every 30 min to a maximum or minimum level) to simulate outdoor solar conditions and (3) a rapid flashing light cycle to simulate mixing of cells in photobioreactors (maximum cycle speed is 10 ms−1). The top and bottom illumination systems can be used individually or in combination.
CO2control
the shakers. The volume within it (approximately 65 L) is approximately 11 times less than the total volume of the entire Tecan enclosure (dimensions 115 cm × 130 cm × 50 cm) and, as it does not have a top, does not interfere with the light path from the top lights. A stable 1% ± 0.3% CO2-enriched atmosphere could therefore be maintained much more precisely and with a reduced CO2requirement by flooding the 1% CO2mix into the bottom of the enclosure via a looping perforated tube system.
Time course assays
A robotic manipulator arm (10 - Tecan, ROMA) was fit-ted to transfer the plates to a plate reader after removal of the lid (11 - Tecan Infinite M200 PRO, Tecan Group Ltd., Männedorf, Switzerland) to measure optical density at defined intervals (typically every 3 h).
Algae growth media variations for the screening
The‘midpoint’and elemental screen range of the screen was based on an extensive literature search and the aver-age values obtained. In total, 11 different fresh water media (TAP medium [31], HSM medium [32], Johnson medium [33], Bristol medium [34],Botryococcusmedium [35], Spirulina medium [35], M4N medium [36], Modi-fied Bold 3 N [35], Del Río medium [37], BG11-1 medium [38] and Modified BG11 medium [39]) were analysed, and their elemental compositions are com-pared in Additional file 1: Table S3. NaNO3and NH4Cl were found to be the most common nitrogen sources. In this screen, urea ((NH2)2CO), a common and cheap fer-tiliser, and ammonium nitrate (NH4NO3), which pro-vides an opportunity for microalgae to dynamically switch N sources during growth, were also tested.
For microelements, the Hutner’s trace formulation [40] was modified by the inclusion of selenium, van-adium and silicon. Other elements have been included because many elements are not essential but beneficial for growth and to make the screening systems applicable to a broad variety of microalgae strains, such as diatoms. The average nutrient concentration based on these 11 media was used as the average values for Screen 1 and the initial mid-value for the Screen 2 system. It was noted that average concentration values derived from the literature search analysis may not be optimal but provided a sensible starting point for optimisation. Solu-bility constants of each element were examined to en-sure that the formulation did not induce precipitation.
Careful formulation of the microelements was crucial to produce accurate and sensible information from the nutrient screen systems for application to the larger scale systems such as bioreactor and open pond systems. Selenium (0.1μM) [14], vanadium (0.009μM) [38], sili-con (273 μM) [38], vitamin B1 (52 μM) [15,41] and
vitamin B12(0.1 μM) [15,42] were used as a baseline of both screens in addition to the Hutner’s trace elements [40] and concentrations (Table 1) used for TAP media [31]. In addition, 0.5373 mM Na2-EDTA, pH 8.0 (chelat-ing agent) and 100 mM Tris-HCl (pH 7.4) buffer are added to the formulation (concentrations derived from range finding experiments, data not shown). Extensive preliminary trials were conducted to monitor optical density changes of the screen media over an experimen-tal run period to ensure that no salt precipitation occur that could contribute to increased measured OD. Given this and to maximise the efficiency of statistical design, blank wells were not included in the runs. This is how-ever optional.
To optimise the efficiency of the screen statistically (that is, to maximise the multidimensional search space and minimise sample number), the screen was config-ured into a two stages process (Screen 1 and Screen 2).
Screen 1 - N and P optimisation
Screen 1 was designed to identify the best N type and concentration tested (Figure 2), and these are based upon the average literature values (Additional file 1: Table S3) and the concentration ranges listed in Table 1. The rationale for this approach is that different algae have different N preferences and that the effects of N and P are so important that without their initial opti-misation, the statistical influences of the other elements on algae growth will be masked. For example, ammo-nium requiring algae would show very low growth in ni-trate based media.
The nitrogen (N) source concentration was adjusted to account for the number of N atoms in the source (for example, NaNO3= 1, NH4NO3= 2). A chelating agent (0.5373 mM Na2-EDTA, pH 8.0) and a buffer (100 mM Tris-HCl, pH 7.4) were added to the formulation (concentrations derived from range finding experiments -data not shown). It is recognised that such high levels of EDTA and Tris-HCl would not likely be suitable for sub-sequent scale up cultivations; however, they are required here to ensure pH stability and to prevent precipitation in a miniaturised system that cannot be controlled in an automated fashion as in scaled up photobioreactors.
The full factorial design of Screen 1 investigates the ef-fect of the four different nitrogen sources and one phos-phorous source at five and three concentration levels, respectively (Table 1), for each algal strain in the test. In total, Screen 1 consists of 60 different photoautotrophic conditions and 3 positive photoheterotrophic controls (TAP media).
Nutrient Screen 2 uses the best N and P conditions
microalgal growth performance. The elements were tested at three concentration levels coded as −1 (low), 0 (middle) and +1 (high). Other nutrients were supplied at constant concentrations. These consisted of CoCl2, (NH4)6Mo7O24, Na-EDTA (pH 8), Tris-HCl (pH 7.4) and vitamins B1 and B12 (Table 1) which excludes them from being tested variables in the current screen configuration. These elements, though not a complete set of nutrients at this stage, were consid-ered to be the most critical for initial testing of a broad range of species. The low and high concentra-tion levels for each of the nutrient elements were set as a twofold difference from the middle concentration (Table 1). The Box-Behnken experimental design allows the observation of primary effects and nutrient interaction effects on microalgal growth to be deter-mined and presented via response surface analysis [11]. Minitab 15 software (Minitab Inc., State College, PA, USA) was used to design the experiment and generated 180 different media formulations (experi-ments) (Additional file 1: Table S4 ).
The three-level second-order response surface model for m factors (x1,…, xm) in n runs is described by
Equation 1 [43].
y¼Xβþε ð1Þ
y= then× 1 response vector
n= number of runs (equals number of concentrations tested)
X=n×pmodel matrix withn1 ×prow vectors
x= (1,x1,…,xm,x1x2,…,xm−1xm,x12,…,xm2)
m =number of factors (here 10)
xm=growth rate of factorm
β=p× 1 vector of parameters (to be estimated) ε=n× 1 vector of errors (with zero mean and covari-ance matrixInσ2)
Screen format
A total of 24 species (or 8 species in triplicates) can be analysed in a single Screen 1 run, and a total of 9 species (or 3 species in triplicates) in 180 conditions can be ana-lysed in Screen 2. All nutrient elements were prepared as individual stocks. Both screens include a triplicate photoheterotrophic/mixotrophic growth condition con-trols in TAP media to compare between runs of the same strain (quality control) as well as to photoautotro-phic growth conditions. Microalgal growth rates in media containing acetate as additional carbon source (TAP controls) are expected to be higher than rates in photoautotrophic growth conditions using CO2 as sole carbon source.
Growth rate determination
Assuming that the specific growth rate μ (h−1) repre-sents the average growth rate of all cells present in the culture, it defines the fraction of increase in biomass over a unit of time and is proportional to the biomass of the cells during exponential growth phase (Equation 2). OD750 was used as the basis for maximum specific growth rates μmax determination of each condition. These rates were used to compare different conditions within the nutrient screens for each algae strain. In gen-eral, batch culture growth phases can be divided into lag, exponential, linear and stationary phase with μmax occurring in exponential phase.
μ¼ ln OD750ð Þt2 –ln OD750ð Þt1=ðt2−t1Þ ð2Þ
μ= specific growth rate OD750(t1)= OD750at time OD750(t2)= OD750at time
t1= time 1 (h)
t2= time 2 (h)
High-throughput data processing requires a form of curve fitting that appropriately compensates for irregu-larities, such as circadian rhythm or scattering effects, to ensure a high comparability of different growth condi-tions (see Equation 3). Under optimal growth condicondi-tions, the microalgae growth curve from lag phase to station-ary phase can be usefully described by a sigmoidal curve. Non-linear regression was used to normalise (curve fit) the recorded 3-h OD750 data points to a simple sig-moidal model (variable sigsig-moidal curve fit (GraphPad Prism, GraphPad Prism Inc., La Jolla, USA)) (Equation 3). The sigmoidal curve fit approach was selected be-cause it describes the usual physiological behaviour of the system where reasonable growth occurs. In non-ideal growth conditions where specific growth rates are low, a sigmoidal fit cannot be achieved (for example, lin-ear growth with no plateau). Strong circadian rhythms in some algae can also interfere with curve fitting (Figure 6). Under these conditions, the growth rates were excluded from the screen.
Y¼ktoþðktn–ktoÞ= 1þ10ðlogt1=2–tÞHill slope
ð3Þ
Y= normalised OD750data xpoint, kto= raw OD750at time 0,
ktn= raw OD750at time n,
log t½= log10 of time when the OD750 is between t0 andtn,
Hill slope = the steepness of the curve at t½.
growth conditions were selected by comparing all μmax values for each strain.
The quality of the fit was assessed using R-square (where a value more than 0.85 was chosen to indicate good quality) and absolute sum of squares (value less than 0.1 was chosen to indicate good quality) (Figure 6). A data cutoff limit based on the R-square (R2) value of the normalised growth plots was ap-plied. This was designed to screen and remove fitted growth curves with R2 smaller than 0.85. Growth curves that can be fitted accurately to the regression model have smaller sum of square regression (SSreg) than sum of square total (SStot). The curve fitting process first generates a number of possible curve fits to the raw data and then identifies the model yielding the highest R2 and the least sum of square. In the situation in which only limited data can be fitted or the chosen model is too complicated, the Not
Con-verged or Ambiguous remarks respectively are
gener-ated by the GraphPad Prism software [44].
Although the screen was validated through triplicate runs, each screen is designed to be conducted without replicates to broaden the screen by maximising the number of conditions and algae strains assayed per run. The screen is not intended to be highly analytically pre-cise but to identify optimal regions of nutrient search space which can be analysed more precisely using con-ventional assays, while excluding the vast majority of conditions. Validation of well-to-well (repeatability test) and run-to-run reliability (reproducibility test) indicated excellent internal data consistency between replicate ex-periments (see Additional file 1: Figures S4, S5 and S6), in particular for high growth rate samples.
Statistical analysis on microalgal growth rate using response surface method
TheMain and Interaction Effectsanalyses (response sur-face method(RSM)) were used to identify specific effects and statistical interactions between the nutrients as well as to determine the significance of nutrients that can im-prove microalgal growth.
Main and Interaction Effects analysis
TheMain Effects analysis identifies the statistical signifi-cance of individual nutrients on the microalgae growth rate (Figure 4). The Interaction Effects analysis deter-mines significant statistical interactions between mul-tiple nutrient factors and their effects on microalgal growth rate. When the Main and Interaction Effects ex-hibited significance (p≤0.05), the nutrient factor in-volved in these cases should be fine-tuned for growth performance improvement. The analysis is based on the average value of the growth rate of specific nutrient concentration level (−1, 0 and 1) in the changing
background of 180 experiments conducted within the
Box-Behnken matrix. In principle, important conditions
will significantly influence the relative growth rates within these changing backgrounds.
The Interaction Effects analysis determines the
syner-gistic or antagonistic effects of two nutrient elements on microalgal growth rates. Nutrient elements that exhib-ited statistical significant interaction effects could be subsequently evaluated or optimised on a rational basis to increase the microalgae growth rate. The analysis was based on the average value of the growth rate of specific nutrient concentration levels (−1, 0 and 1) from 180 ex-periments (Additional file 1: Table S4).
Algae strains and culture conditions
The microalgae strains M. inermum (18-1), A. gracilis
(18-2), R. complanata (SF-150), C. sorokiniana (21), M. convolutum(9-FW),C. pyrenoidosa (22),M. reisseri(13),
P. falcate(4A-1) were isolated in the vicinity of Brisbane, Queensland, Australia. Identification consisted of mor-phological investigation (Olympus BX42 and Nikon Ti-U, × 200 and × 400 magnification) and molecular classi-fication by rDNA analysis (see Additional file 1: Figure S1 and Table S3). The amplification of 18S rDNA and its sequencing was outsourced to the Australian Gen-ome Research Facility (AGRF). Sequences were aligned using nucleotide BLAST (NCBI, http://blast.ncbi.nlm.-nih.gov/Blast.cgi) against the ‘nucleotide collection (nr/ nt)’database.
Additional file
Additional file 1:Microalgae characterisation, microwell sterilization techniques, cultivation media comparison, Screen 2 media key and statistical screening background.The additional file contains: Microalgal identification data for the strains used based on molecular (Additional Table 1) and morphological (Additional Figure 1) classification by rDNA analysis; Optimisation data of gamma irradiation levels for nutrient media sterilization (Additional Figure 2) and its effect on vitamin B1and B12stability (Additional Figure 3) as well as on
Chlamydomonas reinhardtiigrowth (Additional Table 2); A list of average macronutrient concentrations in common media (Additional Table 3); Individual Screen 2 media conditions; Notes on statistical variability, Cronbach Alphaanalysis for Screen 1.2 (Additional Figure 4) and Screen 2 (Additional Figure 5); Analysis of the run-to-run reproducibility of the highest growth rate values obtained in Screen 2 (Additional Figure 6).
Abbreviations
ATPase:adenosinetriphosphatase; CBB cycle: Calvin-Benson-Bassham cycle; CP: centre point; FACS: fluorescence-activated cell sorting; FTIR: Fourier transform infrared spectroscopy; OD750: optical density at 750 nm; TAP: Tris-acetate-phosphate medium;μmax: maximum specific growth rate.
Competing interests
The authors declare that they have no competing interests.
Authors’contributions
BH, ILR, ES, KAR and JW designed the experiments. KAR and JW performed the robotic nutrient screening experiments. KAR and EZ performed the preliminary experiments. KAR, JW and ILR performed the data analysis. GJ and ILR performed the algal strain isolation. JW, BH, KAR and ILR wrote the manuscript. All authors read and approved the final manuscript.
Acknowledgements
The authors gratefully acknowledge the support of the Australian Research Council (Discovery and Linkage grants), the Queensland Government (National and International Research Alliance Program), the Faculty of Applied Sciences at the Universiti Teknologi MARA (UiTM) (PhD Research Scholarship) in Malaysia, the Institute for Molecular Biosciences (Research Scholarship) and the University of Queensland (Major Equipment and Infrastructure grant support). We also thank Jennifer Yarnold and John Srka for their help in developing the LED systems for the automated growth chamber.
Author details
1Institute for Molecular Bioscience, The University of Queensland, St Lucia,
Queensland 4072, Australia.2Faculty of Applied Sciences, Universiti Teknologi MARA, Shah Alam 40450Selangor, Malaysia.
Received: 12 August 2014 Accepted: 13 March 2015
References
1. Bumbak F, Cook S, Zachleder V, Hauser S, Kovar K. Best practices in heterotrophic high-cell-density microalgal processes: achievements, potential and possible limitations. Appl Microbiol Biotechnol. 2011;91(1):31–46. 2. Lehr F, Posten C. Closed photo-bioreactors as tools for biofuel production.
Curr Opin Biotechnol. 2009;20(3):280–5.
3. Chigri F, Soll J, Vothknecht UC. Calcium regulation of chloroplast protein import. Plant J. 2005;42(6):821–31.
4. Marschner H. Mineral Nutrition of Higher Plants. Sixth Editionth ed. London: Academic Press; 2003. p. 889.
5. Merchant SS, Allen MD, Kropat J, Moseley JL, Long JC, Tottey S, et al. Between a rock and a hard place: trace element nutrition in
Chlamydomonas. Biochimica Et Biophysica Acta-Molecular Cell Research. 2006;1763(7):578–94.
6. Sigel A, Sigel H, Sigel RKO. Metallothioneins and Related Chelators. Metal ions in Life Sciences. Cambridge, England: Royal Society of Chemistry; 2009.
7. Stadtman ER, Overath P, Eggerer H, Lynen F. The role of biotin and vitamin B12 coenzyme in propionate metabolism. Biochem Biophys Res Commun. 1960;2:1–7.
8. Epstein E. Silicon. Annu Rev Plant Physiol Plant Mol Biol. 1999;50:641–64. 9. Geider RJ, La Roche J. The role of iron in phytoplankton photosynthesis, and the potential for iron-limitation of primary productivity in the sea. Photosynth Res. 1994;39(3):275–301.
10. Raven JA, Evans MCW, Korb RE. The role of trace metals in photosynthetic electron transport in O-2-evolving organisms. Photo-synth Res. 1999;60(2–3):111–49.
11. Kennedy M, Krouse D. Strategies for improving fermentation medium performance: a review. J Ind Microbiol Biotechnol. 1999;23(6):456–75. 12. Wang B, Lan CQ. Optimising the lipid production of the green alga
Neochloris oleoabundans using Box-Behnken experimental design. Can J Chem Eng. 2011;89(4):932–9.
13. Tran HL, Kwon JS, Kim ZH, Oh Y, Lee CG. Statistical optimization of culture media for growth and lipid production of Botryococcus braunii LB572. Biotechnol Bioprocess Eng. 2010;15(2):277–84.
14. Kropat J, Hong-Hermesdorf A, Casero D, Ent P, Castruita M, Pellegrini M, et al. A revised mineral nutrient supplement increases biomass and growth rate in Chlamydomonas reinhardtii. Plant J. 2011;66(5):770–80.
15. Wang ST, Pan YY, Liu CC, Chuang LT, Chen CNN. Characterization of a green microalga UTEX 2219-4: effects of photosynthesis and osmotic stress on oil body formation. Bot Stud. 2011;52(3):305–12.
16. Naylor AW. Phylogenetic aspects of nitrogen metabolism in algae. Ann N Y Acad Sci. 1970;175(2):511.
17. Syrett PJ, Peplinska AM. Effects of nitrogen-deprivation, and recovery from it, on the metabolism of microalgae. New Phytol. 1988;109(3):289–96. 18. Grobbelaar, JU, Algal Nutrition-Mineral Nutrition. Handbook of microalgal
culture: biotechnology and applied phycology, ed. R. A. 2004;95-115. Black-well Publishing.
19. Wilhelm C, Buchel C, Fisahn J, Goss R, Jakob T, LaRoche J, et al. The regulation of carbon and nutrient assimilation in diatoms is significantly different from green algae. Protist. 2006;157(2):91–124.
20. Rocha AG, Vothknecht UC. The role of calcium in chloroplasts-an intriguing and unresolved puzzle. Protoplasma. 2012;249(4):957–66.
21. Pittman JK, Edmond C, Sunderland PA, Bray CM. A cation-regulated and proton gradient-dependent cation transporter from Chlamydomonas rein-hardtii has a role in calcium and sodium homeostasis. J Biol Chem. 2009;284(1):525–33.
22. Huber SC, Maury W. Effects of magnesium on intact chloroplasts: I. Evidence for activation of (sodium) potassium/proton exchange across the chloroplast envelope. Plant Physiol. 1980;65(2):350–4.
23. Chen L, Wu X, Huang H, Liu XQ, Liu C, Zheng L, et al. Effects of Mg2+ on spectral characteristics and photosynthetic functions of spinach photosystem II. Spectrochimica Acta Part a-Molecular and Biomolecular Spectroscopy. 2009;72(2):343–7.
24. Xu Y, Boeing WJ. Modeling maximum lipid productivity of microalgae: review and next step. Renew Sustain Energy Rev. 2014;32:29–39. 25. Chen JJ, Li YR, Lai WL. Application of experimental design methodology for
optimization of biofuel production from microalgae. Biomass Bioenergy. 2014;64:11–9.
26. Spolaore P, Joannis-Cassan C, Duran E, Isambert A. Optimization of Nannochloropsis oculata growth using the response surface method. J Chem Technol Biotechnol. 2006;81(6):1049–56.
27. Muñoz-Tamayo R, Martinon P, Bougaran G, Mairet F, Bernard O. Design of optimal experiments for parameter estimation of microalgae growth models. Comput Appl Biotechnol. 2013;12(1):315–30.
28. Oey M, Ross IL, Stephens E, Steinbeck J, Wolf J, Radzun KA, et al. RNAi knock-down of LHCBM1, 2 and 3 increases photosynthetic H2 production efficiency of the green alga Chlamydomonas reinhardtii. Plos One. 2013;8(4), e61375. 29. Suryata I, Svavarsson HG. Geothermal CO2bio-mitigation techniques by utilizing
microalgae at the Blue Lagoon, Iceland. In: 34th Workshop on Geothermal Reser-voir Engineering. Stanford, California: Stanford University; 2010.
30. Goto K, Beneragama CK. Circadian clocks and antiaging: do non-aging microalgae like Euglena reveal anything? Ageing Res Rev. 2010;9(2):91–100. 31. Gorman DS, Levine RP. Cytochrome F and Plastocyanin. Their Sequence in
Photosynthetic Electron Transport Chain of Chlamydomonas Reinhardi. Proc Natl Acad Sci U S A. 1965;54(6):1665.
33. Johnson MK, Johnson EJ, Macelroy RD, Speer HL, Bruff BS. Effects of salts on the halophilic alga Dunaliella viridis. J Bacteriol. 1968;95(4):1461.
34. Bold HC. Some cytological aspects of Chlamydomonas chlamydogama. Am J Bot. 1949;36(10):795–5.
35. UTEX. The culture collection of Algae. 2012; Available from: http:// www.utex.org.
36. Morita M, Watanabe Y, Saiki H. High photosynthetic productivity of green microalga Chlorella sorokiniana. Appl Biochem Biotechnol. 2000;87(3):203–18. 37. Del Rio E, Acien G, Garcia-Malea MC, Rivas J, Molina-Grima E, Guerrero
MG. Efficient one-step production of astaxanthin by the microalga Haematococcus pluvialis in continuous culture. Biotechnol Bioeng. 2005;91(7):808–15.
38. Orosa M, Franqueira D, Cid A, Abalde J. Analysis and enhancement of astaxanthin accumulation in Haematococcus pluvialis. Bioresour Technol. 2005;96(3):373–8.
39. Boussiba S, Vonshak A. Astaxanthin accumulation in the green alga Haematococcus pluvialis. Plant Cell Physiol. 1991;32(7):1077–82.
40. Hutner SH, Provasoli L, Schatz A, Haskins CP. Some approaches to the study of the role of metals in the metabolism of microorganisms. Proc Am Philos Soc. 1950;94:152–70.
41. Perez-Garcia O, Bashan Y, Puente ME. Organic carbon supplementation of sterilized municipal wastewater is essential for heterotrophic growth and removing ammonium by the microalga Chlorella vulgaris. J Phycol. 2011;47(1):190–9.
42. Kebede E. Response of Spirulina platensis (=Arthrospira fusiformis) from Lake Chitu, Ethiopia, to salinity stress from sodium salts. J Appl Phycol. 1997;9(6):551–8.
43. Nguyen AV, Thomas-Hall SR, Malnoe A, Timmins M, Mussgnug JH, Rupprecht J, et al. Transcriptome for photobiological hydrogen production induced by sulfur deprivation in the green alga Chlamydomonas reinhardtii. Eukaryot Cell. 2008;7(11):1965–79.
44. Radushev D, Muzyka A, Goodness of fit of nonlinear and linear regression. 2007, Graph Pad Prism - Statistic Description.
Submit your next manuscript to BioMed Central and take full advantage of:
• Convenient online submission
• Thorough peer review
• No space constraints or color figure charges
• Immediate publication on acceptance
• Inclusion in PubMed, CAS, Scopus and Google Scholar
• Research which is freely available for redistribution