Studies on Proximate and Physico-Chemical
Evaluation of Different Groundnut Varieties
Grown in India
Dr. Shashikant Pardeshi Scientific Officer
DPHL, Jalgaon, Maharashatra, India
Abstract
In the present study of five different groundnut varieties such as GG-11,J-11,TMV-2,Rs-1 and K-6 were grown under different geographical places in India. The proximate analysis, oil yield and physicochemical characteristics of collected groundnut seeds and their extracted oils were determined for their nutritional assay. It was found that the seeds contained in the range of extracted oil, protein, moisture, crude fibre, total ash, crude fat, carbohydrate and calories contents were 39.81-44.9%, 26.25-38.13%, 3.54-5.29%, 2.2-4.08%, 2.6-3.0%, 28.8-32.8, 17.01-34.66 and 502.84-528.36 % respectively. The specific gravity, viscosities, impurities and refractive index of the extracted groundnut seed oil were in the range of 0.9147-0.916, 91.47-91.6, 0.04-0.06 and 1.4623-1.4632, respectively. AV (mg KOH/g oil), IV (g I2/100 g oil), SV (mg KOH/ g oil),ester value and unsaponifiable matter
content (%) of the extracted oil from groundnut seeds were in the range of 1.1-4.48, 84.75-95.84,188.61-195.68,186.91-192.1 and 0.44-0.7% respectively. This study is empirical and on the basis of finding it is revealed that groundnut seed oil can be a valuable source of edible oil.
Keywords: Groundnut seeds, Extraction, Proximate, Physico-Chemical analysis
_______________________________________________________________________________________________________
I. INTRODUCTION
India is the largest producer of groundnut in the world. Around 88% of the groundnut area and production in India is concentrated in five states: Andhra Pradesh, Gujarat, Karnataka, Tamil Nadu, and Maharashtra. Nearly 83% of the total area is under rainy-season groundnut and the other 17% is cultivated during the post rainy rainy-season. During 1995-98, groundnut was grown in India over 7.47 Mha with a total production of 8.02 Mt [12]. Groundnut /peanut (Arachis hypogaea) is a legume which is widely grown as a food crop. The genus Arachis, a member of the family Leguminoseae, is among the major oil seeds in the world. China, India and USA are the main producers of groundnuts to the rest of the world. Groundnut is now grown worldwide in the tropical and temperate zones primarily as an oil seed crop. India possesses varying climatic conditions results in cultivation of a wide range oil bearing crops trees and nuts [11]. Peanut (Arachis hypogaea L.) is an herbaceous plant, which is an important source of edible oil for millions of people living in the tropics [7]. In 2003, the US food and drug administration reported that scientific evidence suggests that eating 1.5 ounces (43 g) per day of most nuts including peanuts, as part of a diet low in saturated fat and cholesterol may reduce the risk of heart disease [4]. Recently, it has been associated with metabolic benefits in the context of counteracting metabolic dysfunction associated with the increasing prevalence of obesity and metabolic syndrome [13]. The fat content in groundnut has been largely studied. In general, Groundnut seed contain 44-56% oil and 22-30% protein on a dry seed basis and is a rich source of minerals such as phosphorus, calcium, magnesium and potassium and vitamins like E, K and B group [18]. The nutritive value of food is high as the groundnut is affordable and serves as good source of oil and protein [6].
Barku et al. (2012) have reported changes on the chemical composition as a result of processing. However, little information on the effect of traditional processing on peanuts quality was reported. The chemical properties of oils are amongst the most important properties that determine the quality and help to describe the present condition of oils. Its constitute one of the essential components of balanced diet as good source of energy. The study indicated that Peanut oil, may have a higher shelf life, nutritional value and industrial applications. Vegetable oil had made an important contribution to the diet in many countries [10].
The chemical composition of groundnut seeds has been evaluated in relation to protein level and fatty acid composition in several countries. Peanuts make an important contribution to the diet in many countries. Peanut seeds are a good source of protein, lipid and fatty acids for human nutrition. The oil content of groundnut differs in quantity, the relative proportion of fatty acids, geographical location, seasons and growing conditions. Groundnut protein is increasingly becoming important as food and feed sources, especially in developing countries [9]. Groundnut seeds are reported to contain 9.5 to 19.0 % total carbohydrates as both soluble and insoluble carbohydrate [20]. Vegetable oils are in high demand due to diseases associated with fat from animal origin. The groundnut cake has several uses in feed and infant food formulations [5].
ash, fat and crude protein. The extracted oils were analyzed for physical and chemical parameters, such as refractive index, specific gravity, viscosity, iodine value, acid value, saponification value and unsaponifiable matter etc.
II. MATERIAL AND METHODS
Procurement of Materials
Proximate, physical and chemical analysis of seeds and extracted oil were based on five peanut varieties namely GG-11,J-11,TMV-2,Rs-1 and K-6 have been used for cultivation in arid zone as well as irrigated regions of Rajasthan, Madhya Pradesh and Gujarat then used for extraction of oil which was provided by oil mills association, Jalgaon (Maharashtra). The seeds and pod shells were separated manually. For analysis, mature and healthy seeds were stored in grinded form in glass containers. The chemical reagents and glassware used in this research work are analytical grade.
Methods
Proximate Analysis of Groundnut Seeds
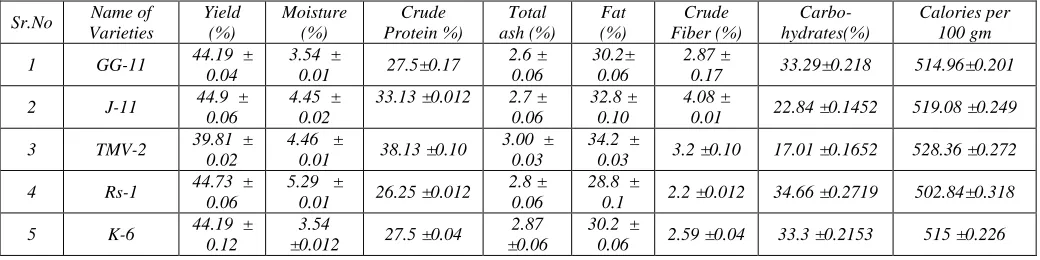
Results of the proximate analysis of groundnut seeds examined are shown in Table 1. a) Determination of Moisture content by Hot Air –oven method
Moisture content of the crushed powder of groundnut kernels is the loss in mass of the sample on heating at 105OC under operating
conditions specified. Weigh in a previously dried and tared dish about 10 g of the groundnut kernel powder which has been thoroughly mixed. Loosen the lid and heat, in an oven at 105OC for 1 hour. Remove the dish from the oven and close the lid. Cool
in desiccators containing equivalent desiccant and weigh. Heat in the oven for a further period of 1 hour, cool and weigh. Repeat this process until change in weight between two successive observations does not exceed 1mg. Carry out the determination in triplicate [15]
Moisture and volatile matter (Percent by weight) =W1 x100/W --- (i) Where, W1= loss in gm of the material on drying, W= Weight in gm of the material taken for test.
% Moisture on dry weight basis = W1 x100/100-% Moisture b) Determination of Total ash
Ash refers to the inorganic residue after total incineration of organic matter. The ash content is an indicator of product quality and the nutritional value of the products. It is advisable to determine the acid insoluble ash [15].
c) Determination of crude Fat
The oils and fats from oilseeds and fruits as well as from animal fatty tissue correspond quite closely with those extracted by diethyl ether, practically, all the sterols and phosphorus containing organic compounds notably the lecithins are extracted with the glycerides. Free fats can be extracted by less polar solvents such as petroleum ether and diethyl ether, whereas the bound fat requires more polar solvents, alcohols for their extraction. The free fats content can be conveniently determined in foods by extracting the dried and ground material with petroleum or diethyl ether in soxhlet extraction apparatus. Extraction in the presence of alcohols causes the release of lipoidal substances bound to proteins and carbohydrates, phospholipids and glycolipids. Hence, the residue after solvent removal and the addition of anhydrous sodium sulphate needs to be extracted with petroleum ether [8]. d) Determination of crude Protein
The quantification of total protein in food and food products can be performed directly or by determining total nitrogen from nitrogen conversion of crude protein using a suitable conversion factor. The protein content is calculated from the total nitrogen determined by Kjeldhal method ,protein contain in varying proportions, however protein calculated by factor it represents true protein present but also be determined directly by formal titration, UV spectroscopy, Lowry method, Dye binding method, Infra Red spectroscopy, Nuclear Magnetic Resonance spectroscopy , Turbiditymetry, Refractometry. Here used indirect Kjeldhal method it has 3 steps Digestion, distillation and titration, Ammonia is liberated from acid digestion mixture by distillation in the presence of alkali, a total recovery of ammonia from the digest can be obtained and titrated with the alkali and calculated % nitrogen and crude protein content is calculated by conversion factor 6.25 [8].
e) Determination of Crude fibre
The crude fibre representing the cell wall material left after boiling with dilute acid and alkali in the process is the mixture of cellulose, lignin and pentocans together with sand ,silica and other mineral matter locked in tissues and little nitrogenous matter after grinding and defatting, boiling with sulphuric acid solution, and separation and washing of insoluble residue. This residue is boiled with sodium hydroxide solution, separated, washed and dried and the insoluble residue is then weighed. The loss in mass on incineration is also noted [8].
f) Determination of Carbohydrate content
By the difference of mean values, the content of carbohydrates was estimated i.e. Carbohydrate content = 100- [% lipids +% Proteins+%Ash+% crude fibre% Moisture] Calories per 100gms calculated with standard values of carbohydrates, protein and fats.
Extraction of Oil of Collected Seeds
weighed using commercial grinder and fed to a soxhlet extractor and hexane was used as the extraction solvent, equipped with thimble and fitted with a 2 L round bottomed flask .The extraction was carried out for a period of 8 hours. At the end of the extraction period, the solvent was recovered by using a rotary evaporator and residual oil was dried at 750 C for one hour. The
extract was transferred to desiccators and then stored in air tight container until needed for further analysis [17]. The amount of oil extracted was determined using the following equation
Oil content (%) = weight of oil extracted / weight of seed x100
Determination of physical and chemical properties of extracted oil
The extracted oil was immediately analyzed for chemical properties, such as iodine, acid and saponofication value, while specific gravity, viscosity, refractive index and colour were examined for physical properties using DGHS manual methods. The refractive indices of the oil at room temperature were determined with Abbe/ Butyro Refractometer [3] and the specific gravity measurement (also carried out at room temperature), using specific gravity bottle. The state and colour of the oil were noted, using Lovibond tintometer at room temperature. Viscosity measurement with Hakke viscometer (rheoVT550) at room temperature and yield were determined, following the method described by the association of official chemists (AOAC) [8]. Results are expressed as the means of three separate determinations.
Determination of Physical Properties of extracted oil
Results of the physical properties of the selected oils examined are shown in Table 2. Determination of colour
The method determines the colour of oils by comparison with Lovibond glasses of known colour characteristics. The colour is expressed as the sum of the yellow and red slides used to match the colour of the oil in a cell of the specified size in the Lovibond Tintometer. Clean the glass cell of desired size with carbon tetrachloride and allow it to dry. Fill it with oil and place the cell in position in the tintometer. Match the colour with sliding red, yellow and blue colours. Colour of the oil in terms Lovibond units as follows [15].
Colour reading = (a Y + 5 b R) --- (ii) Where, a= sum total of the various yellow slides (Y) used, b = sum total of the various red (R) slides used
Determination of the Refractive index at 40 0C
The refractive index was measured, as this figure can help determine the level of unsaturated of the fatty acids in oils, a nutritive quality of interest for this study [16].Measurement of the refractive index of the sample is done by means of a suitable Butyro refractomater at 400C, a refractometer was used to measure the refractive index of extracted oils. Distilled water which has
refractive index 1.3330 at 20OC and 1.3306 at 40OC, the usual temperature of taking readings Make sure sample is completely dry,
circulate stream of water through the instrument. Adjust the temperature of the refractomater to the desired temperature. Ensure that the prisms are clean and dry. Place a few drops of the sample on the prism. Close the prisms and allow standing for 1-2 min. Adjust the instrument and lighting to obtain the most distinct reading possible and determining the refractive index or butyro-refractometer number [ 15].
Determination of Specific gravity
The specific gravity of extracted oil was recorded as a general measure of oil density compared to the density of water [16]. This is useful for physically comparing and identifying oils. The specific gravity was determined using the specific gravity bottle method. The following formula was used to calculate the specific gravity of extracted oils [15].
Specific gravity = (weight of bottle + oil) - (weight of bottle) /( weight of water)----(iii) Impurities
The level of impurities (mesocarp fibers, insoluble materials, phosphatides, trace metals and oxidation products) was measured in each oil, as high levels of these substances are typically prohibited in the regulated production of edible oils [19]. Two grams (2 g) of oil was weighed into a 500 ml flask and mixed with 20 ml of a 1:1 solvent (petroleum ether and diethyl ether). The content s were vigorously shaken, covered, and allowed to stand for 24 hours. The mixture was filtered through a weighed 11 cm qualitative filter paper. The paper was then washed with 10 ml of the 1:1 solvent and placed in an oven at 103 ºC for one hour. The dried paper was then weighed. The impurity (%) of oil was calculated with the following formula [15].
Impurities (%) = (w2-w1)/w3 --- (iv)
w ₂ = Weight of paper before filtering, w₁ = Weight of paper after filtering, w₃ = Weight of initial sample. Determination of Viscosity
The viscosity of extracted oil was measured as an additional proxy for fat unsaturation, as prior studies have described an inverse relationship between viscosity and fatty acid unsaturation in oils [1]. Viscosity was determined at room temperature250C, using a
Hakke viscometer (rheo VT550).
Determination of Chemical Properties of Extracted Oil
Results of the chemical properties of the selected oils examined are shown in Table 3. Determination of Acid value
cooled oil sample in a 250 ml conical flask and 50 ml to 100 ml of freshly neutralised hot ethyl alcohol and about one ml of phenolphthalein indicator solution. Boil the mixture for about five minutes and titrate while hot against standard alkali solution shaking vigorously during the titration [15].
Acid value = (56.1) (V) (N) / W --- (v)
Where V = Volume in ml of standard sodium hydroxide solution used, N = Normality of the standard sodium hydroxide solution, and W = Weight in g of the sample.
Determination of Iodine value (Wij’s method)
The iodine value of such oil was measured, as this value is also useful for determining the unsaturation level of the fatty acids in oil [2].The iodine value of an oil / Fat is the number of grams of iodine absorbed by 100 g of the oil /fat, when determined by using Wijs solution. The oil / fat sample taken in carbon tetrachloride is treated with a known excess of iodine monochloride is treated with glacial acetic acid Wijs solution) The excess of iodine monochloride is treated with potassium iodide and the liberated iodine estimated by titration with sodium thiosulphate solution .The iodine value is a measure of the amount of unsaturation (number of double bonds) in a fat [15].
Iodine value = 12.69 (B- S) N / W --- (vi) Where, B = volume in ml of standard sodium thiosulphate solution required for the blank,
S = volume in ml of standard sodium thiosulphate solution required for the sample, N = normality of standard sodium thiosulphate solution, W = weight in g of the sample.
Determination of Saponofication Value
The saponofication value is the number of mg of potassium hydroxide required to saponify 1 gram of oil /fat.The saponification value of such oil was measured to explore the potential industrial uses for the oils, as this parameter reveals oil’s suitability to be made into soap [14]. Two grams (2 g) of oil was dissolved in 25 ml of alcoholic potassium hydroxide. The mixture was refluxed for 45 minutes and then cooled. 1 ml of phenolphthalein indicator was added. The solution was titrated using 0.5 M HCL. A blank determination was conducted. The oil sample is saponified by refluxing with a known excess of alcoholic potassium hydroxide solution. The alkali required for saponofication is determined by titration of the excess potassium hydroxide with standard hydrochloric acid [15].
Saponification value = 56.1 (B- S) N / W --- (vii)
Where, B= Volume in ml of standard hydrochloric acid required for the blank, S = Volume in ml of standard hydrochloric acid required for the sample, N = Normality of the standard hydrochloric acid, W = Weight in gm of the oil .fat taken for the test.
Determination of ester value
The ester value is the ‘mg’ of KOH required to react with glycerol/ glycerin after saponify 1 g of oil sample. Ester value is calculated by the following relation
Ester Value = Saponification Value – Acid Value Determination of Unsaponifable matter
The Unsaponifable matter was determined using the neutralized liquid after titration for the determination of saponification value. The neutralized liquid was transferred quantitatively into a separating funnel using 50ml of water for washing the flask. Add to the flask 50ml of petroleum ether, shake vigorously, and allow the layers to separate. Transfer the lower soap layer into another separating funnel and repeat the ether extraction for another 3 times using 50 ml portions of petroleum ether. Wash the combined ether extract three times with 25 ml portions of aqueous alcohol followed by washing with 25 ml portions of distilled water to ensure ether extract is free of alkali (washing are no longer alkaline to phenolphthalein) Transfer ether solution to 250 ml beaker, rinse separator with ether ,add rinsing to main solution. Evaporate to about 5 ml and transfer quantitatively using several portions of ether to Erlenmeyer flask previously dried and weighed. Evaporate ether .When all ether has been removed add 2-3 ml acetone and while heating on steam or water bath completely remove solvent under a gentle air. To remove last traces of ether, dry at 100 0C for 30 minutes till constant weight is obtained dissolve residue in 50 ml of warm ethanol which has been neutralised to a phenolphthalein end point. Titrate with 0.02 N NaOH [15].
Weight in g of the free fatty acids in the extract as oleic acid = (0.282) (V) (N)
Where, V = Volume in ml of standard sodium hydroxide solution, N = Normality of standard sodium hydroxide solution Unsaponifable matter = 100 (A- B) / W --- (viii)
Where, A = Weight in g of the residue, B = Weight in g of the free fatty acids in the extract W = Weight in g of the sample.
III. STATISTICAL ANALYSIS
IV. RESULTS AND DISCUSSION
Results of the proximate analysis of the groundnut seed were investigated (table 1), Oil extraction yield of the different groundnut varieties which are relatively high as in between 39.81- 44.9% and better than other oil crops, such as soybean, which produces an edible oil yield of approximately 18%. The moisture content are from the range of 3.54 to 5.3 %.Ash content 2.6 to 3.0 %, crude fiber ranges from 2.2 to 4.08% crude protein ranges from 26.25 to 38.13%, fat content from 28.8 to 32.8% and carbohydrate by difference ranges from 17.01 to 34.66 %. Calories values are in the range of 502.84-528.36 per 100gram.
Results of the physical characteristics of the different varieties of groundnut seed extracted oil were investigated (table 2), the colour in yellow units ranges from 2.2 to 2.4 on Lovibond tintometer. Specific gravity ranges from 0.9147 to 0.9160 for all the varieties of groundnut. The value of the viscosity of the various oils extracted fell outside the recommended standard range of 91.47 to 91.6.The refractive index analysis shows that the values between 1.4623 and 1.4632, the refractive index increases as the double bond increases. Others could be attributed to the presence of some impurities and other components of the crude oil mixture ranges from 0.04-0.06%.
Result of the chemical characteristics of the different varieties of groundnut seed extracted oil were investigated (table 3). Results obtained from this work indicate that the acid value of the oils as determined range from 1.1-4.48 mg KOH/g oil. The saponification values of the various oils were found to be in ranges from 188.61to 195.68. The iodine values show increase in the average degree of un-saturation of the oil, as /such, the amount of iodine which can be absorbed by unsaturated acids would be higher and ranges from 84.75 to 95.84. Unsaponifiable matter in the range from 0.44-0.67, ester value ranges from 186.91-192.1. As a result of their agreement with standard, all the oils could be classified as non-drying oils; since their iodine values are lower than 100 (gI2/100 g
sample). Certainly, those oils whose values are less than 100 (g I2/100 g sample) could be used extensively as lubricants and
hydraulic brake fluids.
V. CONCLUSION
The physicochemical properties of different varieties of groundnut seed oils have been analyzed and compared.all the extracted groundnut oil samples confirming to standards of the food product and standards regulations 2011 of the Food safety and standards act 2006. it is concluded that all the groundnut varieties are fit for human consumption. From the physicochemical characterization, all the oils have very low degree of unsaturation and could be classified as non-drying oils. The percentage oil content of most of the seeds selected from different varieties of groundnut, show them as high oil yielding. Groundnut characteristically contained high level of oil and protein with low level of moisture, ash and carbohydrates, this make it a potential source of edible oil. The low moisture is an advantage when the shelf life is considered. The low ash content is an indicative of low level of inorganic impurities and qualifies as good source of mineral element. Though the saponification value is high, a property adequate for soap making industry, a low iodine value in the nut is the suitability for cooking. The oil is of good quality and could be recommended as suitable for cooking usage especially, all the oils show good tendency to be used as unrefined.
Table – 1
Proximate composition of different variety of groundnut seeds
Sr.No Name of Varieties Yield (%) Moisture (%) Crude Protein %) Total ash (%) Fat (%) Crude Fiber (%) Carbo-hydrates(%) Calories per 100 gm
1 GG-11 44.19 ±
0.04
3.54 ±
0.01 27.5±0.17
2.6 ± 0.06
30.2± 0.06
2.87 ±
0.17 33.29±0.218 514.96±0.201
2 J-11 44.9 ±
0.06
4.45 ± 0.02
33.13 ±0.012 2.7 ± 0.06
32.8 ± 0.10
4.08 ±
0.01 22.84 ±0.1452 519.08 ±0.249
3 TMV-2 39.81 ±
0.02
4.46 ±
0.01 38.13 ±0.10
3.00 ± 0.03
34.2 ±
0.03 3.2 ±0.10 17.01 ±0.1652 528.36 ±0.272
4 Rs-1 44.73 ±
0.06
5.29 ±
0.01 26.25 ±0.012
2.8 ± 0.06
28.8 ±
0.1 2.2 ±0.012 34.66 ±0.2719 502.84±0.318
5 K-6 44.19 ±
0.12
3.54
±0.012 27.5 ±0.04
2.87 ±0.06
30.2 ±
0.06 2.59 ±0.04 33.3 ±0.2153 515 ±0.226 Values are mean ± SEM (n=3), each value is an average of three determinations
Table – 2
Physical properties of different groundnut extracted seed oils.
Sr. No
Oils /
Name of varieties Specific gravity Viscosity at 25
0C/CP Impurities (%)
RI at 400C
Colour (Yellow unit)
1 GG-11 0.9160 ±0.4*10-3 91.6 ±0.03 0.04 ±0.01 1.4630 ±0.1*10-4 2.2 ± 0.06
2 J-11 0.9158 ±0.2*10-3 91.58 ±0.03 0.05 ±0.01 1.4623 ±0.16*10-3 2.2 ± 0.06
3 TMV-2 0.9147 ±0.2*10-3 91.47 ±0.02 0.06 ±0.00 1.4626 ±0.24*10-3 2.4 ± 0.03
4 Rs-1 0.9152 ±0.2*10-3 91.52 ±0.02 0.06 ±0.01 1.4632 ±0.12*10-3 2.3 ± 0.06
5 K-6 0.9160 ±0.3*10-3 91.6 ±0.02 0.04 ±0.01 1.4630 ±0.12*10-3 2.2 ± 0.06
Table – 3
Chemical Properties of different groundnut extracted seed oils.
Sr. No
Oils /Name of varieties
AV* (mg KOH/g)
IV*
(Wijs) SV* (mg KOH/g) Unsaponifiable matter* (g/kg) EV*
1 GG-11 3.58 ±0.02 84.75 ±0.1 195.68 ±0.15 0.7 ±0.06 192.1 ±0.12
2 J-11 4.48 ±0.01 92.8 ±0.01 193.28 ±0.09 0.44 ±0.01 188.8 ±0.06
3 TMV-2 1.10 ±0.01 87.46 ±0.1 188.01 ±0.09 0.52 ±0.03 186.91 ±0.07
4 Rs-1 3.15 ±0.01 95.84 ±0.1 195.23 ±0.10 0.67 ±0.02 192.08 ±0.03
5 K-6 3.58 ±0.01 84.75 ±0.03 195.68 ±0.14 0.7 ±0.03 192.1 ±0.06
Values are mean ± SEM (n=3), AV-Acid value, IV-Iodine value, SV-Saponification value, EV-Ester value, * Each value is an average of three determinations
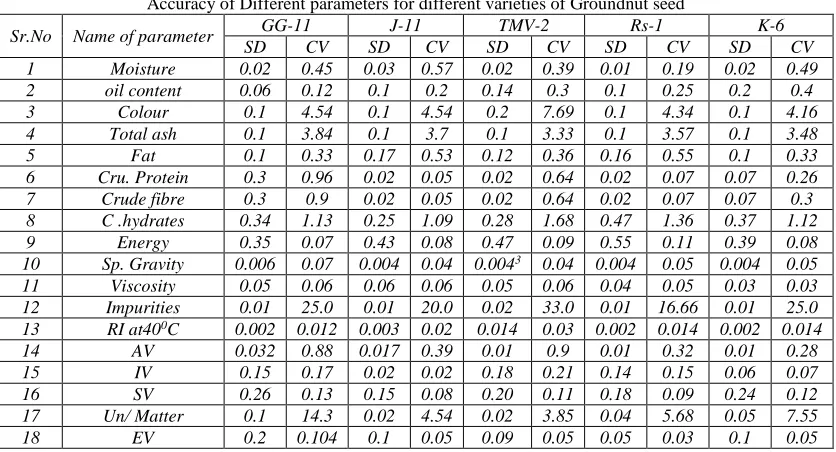
Table – 4
Accuracy of Different parameters for different varieties of Groundnut seed
Sr.No Name of parameter GG-11 J-11 TMV-2 Rs-1 K-6
SD CV SD CV SD CV SD CV SD CV
1 Moisture 0.02 0.45 0.03 0.57 0.02 0.39 0.01 0.19 0.02 0.49
2 oil content 0.06 0.12 0.1 0.2 0.14 0.3 0.1 0.25 0.2 0.4
3 Colour 0.1 4.54 0.1 4.54 0.2 7.69 0.1 4.34 0.1 4.16
4 Total ash 0.1 3.84 0.1 3.7 0.1 3.33 0.1 3.57 0.1 3.48
5 Fat 0.1 0.33 0.17 0.53 0.12 0.36 0.16 0.55 0.1 0.33
6 Cru. Protein 0.3 0.96 0.02 0.05 0.02 0.64 0.02 0.07 0.07 0.26
7 Crude fibre 0.3 0.9 0.02 0.05 0.02 0.64 0.02 0.07 0.07 0.3
8 C .hydrates 0.34 1.13 0.25 1.09 0.28 1.68 0.47 1.36 0.37 1.12
9 Energy 0.35 0.07 0.43 0.08 0.47 0.09 0.55 0.11 0.39 0.08
10 Sp. Gravity 0.006 0.07 0.004 0.04 0.0043 0.04 0.004 0.05 0.004 0.05
11 Viscosity 0.05 0.06 0.06 0.06 0.05 0.06 0.04 0.05 0.03 0.03
12 Impurities 0.01 25.0 0.01 20.0 0.02 33.0 0.01 16.66 0.01 25.0
13 RI at400C 0.002 0.012 0.003 0.02 0.014 0.03 0.002 0.014 0.002 0.014
14 AV 0.032 0.88 0.017 0.39 0.01 0.9 0.01 0.32 0.01 0.28
15 IV 0.15 0.17 0.02 0.02 0.18 0.21 0.14 0.15 0.06 0.07
16 SV 0.26 0.13 0.15 0.08 0.20 0.11 0.18 0.09 0.24 0.12
17 Un/ Matter 0.1 14.3 0.02 4.54 0.02 3.85 0.04 5.68 0.05 7.55
18 EV 0.2 0.104 0.1 0.05 0.09 0.05 0.05 0.03 0.1 0.05
SD-Standard deviation, CV-Coefficient of variance
ACKNOWLEDGEMENTS
I would like to thanks to Jalgaon oil mills association for providing different groundnut varieties for this research study.
REFERENCES
[1] Abramovic et al (2012), Abramovic H, Klofutar C., The Temperature Dependence of Dynamic Viscosity for Some Vegetable Oils. Acta Chimica Slovenica,
45(1): 69-77.
[2] Akinyeye et al (2011)., Akinyeye RO, Adeyeye EI, Fasakin O, Adedunke AA., Physicochemical Properties and Anti-nutritional Factors of Palm Fruit Products
(Elaeis guineensis jacq.) from Ekiti State, Nigeria. Electronic Journal of Environmental, Agricultural, and Food Chemistry, 10(5): 2190-2198.
[3] Alamu et al (2008)., Alamu OJ, Waheed MA, Jekayinfa SO., Effect of ethanol-palm kernel oil ratio on alkali-catalyzed biodiesel yield. Fuel, 87(8-9):
1529-1523.
[4] Alper et al (2003)., Alper C, Mattes R., Peanut consumption improves indices of cardiovascular disease risk in healthy adults, J. Am. Coll. Nutrition.,
22:133-141.
[5] Asibuo et al (2008)., Asibuo J. Y., Akromah. R., Safo-Kantanka O. O., sei, Adu-Dapaah., Hanskofi O.S and Agyeman A., Chemical Composition of
Groundnut, Arachis hypogaea (L) landraces, African Journal of Biotechnology. 7(13), 2203-2208.
[6] Atasie et al (2009)., V.N.Atasie, T.F. Akinhanmi and C.C. Ojiodu, Proximate Analysis and Physico-Chemical Properties of Groundnut (Arachis hypogaea
L.).Pakistan Journal of Nutrition, 8(2):194-197.
[7] Anyasor et al (2009).,G.N.Anyasor, K.O.Ogunwenmo, O.A.Oyelana, D.Ajayi and J. Dangana, Chemical Analysis of Groundnuts (Arachis hypogaea) Oil,
Pakistan Journal of Nutrition,8(3),269-272.
[8] AOAC (1984, 2000),17thedition, Official Methods 920.212 ,921.08, 920.160 ,933.08, 920.159, Association of Official Analytical Chemists, Arlington, VA.
[9] Ayoola et al (2010).,Ayoola, P. B., and Adeyeye, A., Effect of Heating on the Chemical Composition and Physico-Chemical Properties of Arachis hypogea
(Groundnut) Seed Flour and Oil. Pakistan Journal of Nutrition, 9(8), 751-754.
[10] Barku et al (2012)., Barku V. Y., Nyarko, H. D., and Dordunu, P., Studies on the Physicochemical Characteristics, Microbial Load and Storage Stability of
Oil from Indian Almond Nut (Terminalia Catappal.), Food Science and Quality Management, 8. 9-17.
[11] Campos et al (2009)., Campos - Mondragon MG, Calderon AM, Dela Barca A, Duran-Prado, Campos-Reyes LC, Oliart-Ros RM, Ortega-Garcia J,
Medina-Juarez LA, Angulo O ., Nutritional composition of new peanut (Arachis hypogaea L.) cultivars, Grasos Y. Aceites, 60: 161-167.
[12] CMIE (2000), India’s agricultural sector: A Compendium of statistics, Bombay, India: Centre for Monitoring Indian Economy Pvt. Ltd.
[13] Coates et al (2007)., Coates A, Howe P., Edible Nuts and Metabolic Health. Current Opin. Lipidol, 18: 25-30.
[14] Cuppett (2001)., Cuppett SL, Current Protocols in Food Analytical Chemistry: John Wiley and Sons. Lincoln, NE.
[16] Nagre et al (2011)., Nagre R D, Oduro I, Ellis W O., Comparative Physico-chemical evaluation of Kombo Kernel fat produced by three different processes, African Journal of Food Science and Technology, 2(4): 83-91.
[17] Pearson (1981)., Pearson D., The Chemical Analysis of Food. (8thedition). Longman Group Ltd: 535.
[18] Savage et al (1994)., Savage GP, Keenan JI., The composition and nutritive value of groundnut kernels. In: Smart J. (ed). The Groundnut Crop: Scientific
basis for improvement, London: Chapman and Hall, 173-213. Springer, Netherlands.
[19] Watanapoon (2004)., Watanapoon S.., Improvement of physicochemical properties of palm Oil in Blended with rice bran oil. Ph.D. thesis, Silpakorn University, Thailand.