w w w . i j m r e t . o r g I S S N : 2 4 5 6 - 5 6 2 8 Page 7
AN ANALYSIS ON ENHANCE PRODUCTIVITY THROUGH
OBJECTVE MATRIX (OMAX) METHOD ON
MANUFACTURING LINE
Hernadewita
1, Nunung Fatmawati
2, Hermiyetti
3 1,2(Magister of Industrial Engineering, MercuBuana University,Jakarta, Indonesia)
3
(Faculty of Economic Social Science, Bakrie University, Jakarta Indonesia
Email; [email protected]
ABSTRACT: Productivity is one of the important factors that must be taken into account to company consideration, especially in manufacture based. The study is aims to determine the efficiency and effectiveness of productivity in manufacturing process and at the same time enhance the productivity improvement. It is use reliability test in finding the level of employee involvement in productivity process. By using validity test, it found that the research instrumentsare valid and reliable. Focus Group Discussions (FGDs) also was conducted among stakeholders in gaining to get the information on productivity improvement. Thus, Analytical Hierarchical Process (AHP) was used to determineand calculate the weighted criterion value and Measurement of productivity using objective matrix method (OMAX) to determine the efficiency and effectiveness of resource utility. The level of company productivity is stay in good criteria. Eventually, in some periods the productivity is experiencing a major decline during 2015, mainly in main product criteria. By 2016, productivity decrease on raw material utility. The affecting factors on productivity decrease are determined as: materials, manpower, machinery, methods and environment. These five factors cause the company could not meet target production. The appropriate strategy to improve productivity isnecessary need especially in manufacturing based.
KEYWORDS:Analytical Hierarchy Process, FGD,Objective Matrix, 5W+1H
I. INTRODUCTION
The automotive industry in Indonesia is growth rapidly.As the main support to the transportation sector, PT. INS as one of the manufacturing industries, whichare engage in the manufacturing of Speedometer, Fuel Unit and Speed Sensor for part and components of the motorcycles and automobiles. The company is constantly striving to maintain and improve its diversity in the automotive industry world. Productivity relates to the effectiveness and efficiency of utilization of resources (inputs) in producing the output (Dulange et al., 2014)[1]. The company emphasizes on production operations by maintaining the quality of the products produced, which can increase productivity by improving production by analyzing production results in each production process (Mihaiu, 2010)[2].
The production factors in input aremen,
money, machines, materials, methods and
environment, which affectedto the flow of the production process in gaining to producea quality product (Roghanian. 2012)[3]. As the figure gives from PT INS, lack on production in 2015 is
228,329 units (percentages: 4.3%). Total
production in 2016 was 4,646,568 units, while in 2016 there was a deficit of 311,287 units (percentage: 6.1%). The shortcomings cause the user's unfulfilled demand.
The lack of company constraints to increase productivity on the production floor was generally influenced by factors of nonconforming
resource used during production activities
(Sumanth, 1984)[4]. To improve the production
outcomes, toappliedthe appropriate partial
productivity measurements to improve productivity in the production floor is by using Objective Matrix (OMAX) method (Allender, 1997)[5]. Decreasing in productivity will be solved and improved by this analysis (Allender, 1997)[6].
The objective of this study is to analyze and measure output/input criteria which shown a critical value or less contribution to the productivity of worker in the production section. Theanalysis will becarried out on the efficiency and productivity, either the productivity has increased or decreased. The results of the analysis is
w w w . i j m r e t . o r g I S S N : 2 4 5 6 - 5 6 2 8 Page 8
manufacturing line of PT. INS, and also which leads to increased productivity in the future.
II. PRODUCTIVITY OBJECTIVE MATRIX METHOD
Measurement of productivity is an important management tool at all economic levels(Sumanth, 1997)⦋7⦌. Objective Methods Matrix (Omax) developed by James L. Riggs PE, professor of Industrial Engineering Department at Oregon University, introduced in the 80s in the United States. The OMAX Methodology (Matrix of Goals) measures productivity by evaluating achievements in each part of the company with objective, as well as looking for factors that cause a decrease in productivity if found (Allender, 1997)[5].
According to Balkan(2011)⦋8⦌ OMAX's productivity has traditionally been defined as the ratio between output and input. OMAX is a performance measurement method that evaluates several productivity criteria by weight to get an overall index of enterprise productivity. Using the OMAX method can produce an effective resource(Allender, 1997)[6].
Meanwhile,Pharne and Kande (2016)⦋9⦌; Anis& Islam, (2015){10] and Saaty (1994)[11] proposed that the analytical Hierarchy Process (AHP) used in analysedto evaluatethe weighted. In determination of AHP is by using a questionnaire. The analysis of questionnaireswas used in discussions among managers to define criteria based on degree of importance. Weighting will be used in the determination of productivity index in the OMAX method Balkan(2011)⦋8⦌.
Rahman and Ismail (2004)⦋12⦌, in their study stated that, Matrix Objectives will show the overall ratio of the score. By calculating final score and simplifybenchmark with previous productivity score as current comparison to determine performance whether its productivity increases or
decreasesPharne and Kande (2016)⦋9⦌and (OECD,
2001)[13].
III. METODOLOGY
Theresearch methodology is combining the qualitative and quantitative methods and use descriptive analysis (Arikunto, 2002)[14]. The aim of study focuses on productivity measurement based on material or raw material data (input production), number of labor, effective working hours, actual hourly production, output, idle time, over time, demand and the total production report department, PPIC and Quality Control at PT. INS. The variable investigations to achieve the study objectives are efficiency, effectiveness and inferences of productivity production.
The techniques of analysis data are:
Reliability Testing by Alpha Cronbach method
(Siregar, 2014)[16].
Testing empirical validity by analyzing the relationship between the score of each item on the instrument with a total score using by Product Moment Pearson formulation (Siregar, 2014)[16].
Focus Group Discussions (FGDs) forthe
results on testing of Validity and reliability to be discussed among relevant departments at PT. INS.
Determine the weight ratio by using the
Process of Analytical Hierarchy (AHP) (Safian et.al, (2011)[15] and (Triantaphyllou& Mann , 1995)[16]
Objective Matrix (OMAX) (Balkan,2011)⦋8⦌
IV. RESULT
Based on the result of the alpha Croanbach method data processing by using the SPSS program, the research instrument is reliable, with the value of r11 = 0.727> 0.361 (r table). Validity test is to determine the research instrument is valid and reliable. Determination of weighted
criteria is determined from Focus Group
Discussion (FGD) or based on mutual meetings and joint discussions among the stakeholders.
w w w . i j m r e t . o r g I S S N : 2 4 5 6 - 5 6 2 8 Page 9
Weighted on each criterion was classified as; Criteria 1 is 42.7%, criterion 2 is 14.2%, criterion 3 is 8.5%, criterion 4 is 14.2%, criterion 5 is 14.2% and criterion 6 is 6.1%. So that, the total weight of all criterion = 1 (100%) in accordance with the term used in AHP, where the total figure should be 100. After the calculation, the result of the performance measurement will be obtained based on year 2015 and 2016
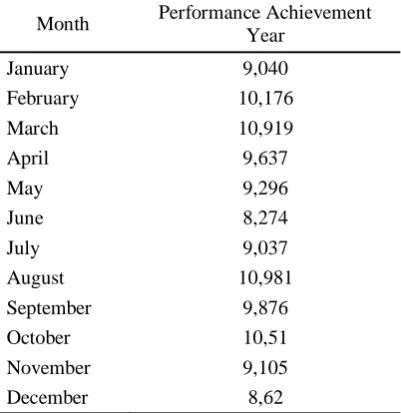
Table 4.1. Performance Achievement on Year 2015
Month Performance Achievement
Year
January 9,040
February 10,176
March 10,919
April 9,637
May 9,296
June 8,274
July 9,037
August 10,981
September 9,876
October 10,51
November 9,105
December 8,62
Performance achievement (2015) will put as a baseline (previous) measurement in June of 8,274. The highest performance achievement is in March at 10,919. The next step the calculation, the result of performance measurement in 2016 will be obtained in the Table 4.2.
Table 4.2. Performance Achievement Year 2016 Month Performance Achievement Year January 5,882
February 5,797 March 6,768 April 5,89 May 4,521 June 8,639 July 6,478 August 5,6 September 9,208 October 7,948 November 8,618 December 8,773
The result from the above data processing, it was shown that the achievement in May is the lowest 4,521 and put as the basis of productivity. The highest achievement was 9,208 in September.
V. DISCUSSION
The movement on increased and
decreased productivityescalation will be shown on the analysis of objective matrix method as bellow Table 5.1:
Table 5.1.Resultof Objective Matrix (OMAX) 2015
Month Produc
tion Plan
Raw material
Lab or
Idle Time
Product Defects
Over Time
Jan 9 8 4 6 2 5 Feb 9 9 9 6 4 5 Mar 9 9 7 8 8 6 Apr 9 9 6 3 5 5 May 9 8 4 6 2 5 Jun 9 9 7 4 1 5 Jul 9 8 0 5 0 5 Aug 9 8 9 4 1 5 Sep 10 9 7 8 5 7 Oct 9 8 5 8 5 8 Nov 10 8 6 8 4 10 Dec 9 8 4 4 0 6
The results from analysis showed that the decline in productivity levels in 2015 occurred in defective products ie January, May, June, July, and November.
Table 5.2.Result of Objective Matrix (OMAX) 2016 Month
Produ ction Plan
Raw materi al
Labor Idle Time
Product
Defects Over Time
Jan 3 8 3 4 7 0 Feb 7 1 7 6 4 6 Mar 8 1 6 8 6 7 Apr 6 1 5 6 8 8 May 4 1 3 5 7 7 Jun 6 8 6 6 7 5 Jul 4 8 9 1 1 5 Aug 5 4 3 0 8 6 Sep 7 8 6 7 7 5 Oct 7 6 6 7 5 3 Nov 8 5 6 8 7 7 Dec 7 7 9 6 4 10
w w w . i j m r e t . o r g I S S N : 2 4 5 6 - 5 6 2 8 Page 10
productivity levels in 2015 occurred at defective products in February, March, April, May.
Objective Matrix (OMAX) method might be used to measure productivity partially on the production line.So that, it will find which criteria is affecting theproductivitydecreasing. The result shown that the measurement used as a means to solve the problems whichoccurred in this research. The 5W+1H method is able to enhanceproductivity improvement. The factors affecting productivity decrease are: Material, Human, Machine, method and environment.The strategy is used to solve the problem in improving productivity by applied 5W and 1H methods. The implementation and operation of 5W+1Hmethods are important in the process to reduce cost of production. Process production will run smoothly as well as the availability of raw material. The appropriate supplies in the process production with an accurate estimation on raw material by taking 3% of order quantity, providing quality raw materials, and no idle of material in anticipating the increase of defective products (increase cost). The improving of manpowerskills of the workforce, the expertise, and the first line of industrial workers should be improve the company productivity. Furthermore, PT INS managements are required to get detail
information on production schedule,total
production, availability of raw materials, the cost that occurred on products defect. It is important to keep process production is running welland fulfillment the customer needs. Safely and comfortable working environment will increase productivity of workforces.
VI. CONCLUSIONS
From the results of the analysis data and discussion conducted, it can be concluded as follows:
1. Determination of the productivity stage in the Speedometer Assyare by measuring the ratio of the production criteria as output, the criterion of input as: raw materials, labor, certain periods, product defects continuously., By applying the objective Matrix method, it will results either the productivity is increase or decrease.
2. Determination of Hierarchy Analysis Process (AHP) based on the interests of all relevant Offices of Expenditure, PPIC and Quality Control and based on the results of Focus
Group Discussion (FGD) decisions at PT. INS. AHP as a weight in the rank of interest.
3. The objective matrix measurement (OMAX)
can measure the productivity of parts in the 2015 release sequence of productivity decrease in product criteria disability and by 2016 there is a decrease in productivity in raw materials.
4. The use of 5W + 1H method can help solve the
problem in Speedometer Assy expenditure to increase productivity.
REFERENCES
⦋1⦌ Dulange, S. R., Pundir, A. K., &Ganapathy, L. (2014). Quantification of Factors Influencing Productivity using AHP Technique: An Approach towards Productivity Improvement. Journal of Business Management & Social Sciences Research (JBM&SSR), 3(3), 55-71.
⦋2⦌ Mihaiu, D. M., Opreana, A., &Cristescu, M. P. (2010).Efficiency, effectiveness and performance of the public sector. Romanian Journal of Economic Forecasting, 4(1), 132-147.
⦋3⦌ Roghanian, P., Rasli, A., &Gheysari, H. (2012).Productivity through effectiveness and efficiency in the banking industry.Procedia-Social and Behavioral Sciences, 40, 550-556.
⦋4⦌ Sumanth, D. J. (1984). Productivity engineering and management: Productivity measurement, evaluation, planning, and improvement in manufacturing and service organizations. McGraw-Hill College.
⦋5⦌ Allender, H. D. (1997).Awakening the power of the objectives matrix. INDUSTRIAL MANAGEMENT-CHICAGO THEN ATLANTA-, 39, 23-25.
⦋6⦌ Allender, H. D. (1997). Objectives matrix provides information balance. Water Engineering & Management, 144(9), 30-33.
⦋7⦌ Sumanth, D. J. (1997). Total productivity management (TPmgt): a systemic and quantitative approach to compete in quality, price and time. CRC Press.
⦋8⦌ Balkan, D. (2011).Enterprise productivity measurement in services by OMAX (Objective Matrix) method and an application with Turkish emergency service.In Reser Conference, Productivity of Services Next Gen–Beyond Output/Input. Hamburg (pp. 1-13).
⦋9⦌ Pharne, M. P., &Kande, G. N. (2016).Application of Benchmarking Method in the Construction Project to Improve Productivity. International Journal of Technical Research and Applications, 4(3), 394-398.
w w w . i j m r e t . o r g I S S N : 2 4 5 6 - 5 6 2 8 Page 11
⦋11⦌ Saaty, T. L. (1994). How to make a decision: the analytic hierarchy process. Interfaces, 24(6), 19-43.
⦋12⦌ Rahman, A. A., &Ismali, N. (2004).Designing individual productivity measures in service sector. In Seminar SainsPemutusan, Holliday Inn Resort, Penang (pp. 1-8).
⦋13⦌ OECD.Publishing. (2001). Measuring productivity-OECD manual: Measurement of aggregate and industry-level productivity growth. Organisation for Economic Co-operation and Development.
⦋14⦌ Arikunto, S. (2002).Research methodology.Publisher PT. RinekaCipta. Jakarta.
⦋15⦌ Safian, M., Ezwan, E., &Nawawi, A. H. (2011). The evolution of Analytical Hierarchy Process (AHP) as a decision making tool in property sectors.
⦋16⦌ Siregar, S. (2014). Parametric statistics for quantitative research are complemented by manual calculations and SPSS version 17 applications. Jakarta: BumiAksara.