Optimization of MRR and TWR on EDM by
using Taguchi’s Method and ANOVA Die Steel
H13
Suresh Kumar Gurjar Mr. Rajeev Kumar
PG Scholar Associate Professor
Department of Mechanical Engineering Department of Mechanical Engineering
Modern Institute of Technology & Research Centre Alwar Rajasthan-India
Modern Institute of Technology & Research Centre Alwar Rajasthan-India
Abstract
Electrical Discharge Machining (EDM) is a non-traditional machining process where intricate and complex shapes can be machined. Only electrically conductive materials can be machined by this process and is one of the important machining processes for machining high strength, temperature-resistant (HSTR) alloys. It is capable of machining geometrically complex or hard materials, that are precise and difficult-to-machine such as heat treated tool steels, composites, super alloys, ceramics, carbides, heat resistant steels etc. These materials are being widely used in die and mould making industries, aerospace, aeronautics and nuclear industries. In this work Die steel H13 tool steel is the material used for the machining purpose. For achieving the best performance of the EDM process, it is crucial to carry out parametric design responses such as Material Removal Rate and Tool Wear Rate. It is essential to consider was used to reduce the total number of experiments. Parts of the experiment were conducted with the L9 orthogonal array based on the Taguchi method. Moreover, the signal-to-noise ratios associated with the observed values in the experiments were determined by which factor is most affected by the Responses of Material Removal Rate (MRR) and Tool Wear Rate (TWR). In the present work, Optimization of MRR and TWR on EDM conducted by using Taguchi and ANOVA.
Keywords: EDM, Optimization Of MRR & Tool Wear Rate, Taguchi’s Method, ANOVA
_______________________________________________________________________________________________________
I.
I
NTRODUCTIONElectrical Discharge Machining (EDM) is a modern machining process, where electrically conductive material is removed by controlled erosion through a series of electric sparks of short duration and high current density between the electrode and t he work piece, both is submerged in a dielectric bath, containing kerosene or distilled water. During this process thousands of sparks per second are generated, and each spark produces a tiny crater in the material along the cutting path by melting and vaporization. Generally the material is removed by erosion process. The top surface of the work piece subsequently resolidifies and cools at a very high rate. The application of this process is mostly found in press tools and dies, plastic moulds, forging dies, die castings, aerospace, automotive, surgical components manufacturing industries etc. The objective of the present work is an attempt for finding feasibility of machining Die steel H13work piece using circular copper electrode and dielectric flushing. The machining parameter selected is discharge current, pulse on time and feed of the tool using Taguchi design approach analyzing the responses MRR and TWR. The Taguchi‟s method is used to formulate the experimental layout, ANOVA method is used to analysis the effect of process parameters on the machining characteristics and find the optimal process parameters of Electric Discharge Machining. Optimization helps for finding an alternative with the most cost effective or highest achievable performance under the given constraints, by Maximizing desired factors and minimizing undesired ones.
II.
L
ITERATURE REVIEWalmost linearly with the increasing current, the SR increases linearly with current for different pulse on time, TWR increased with increasing peak current while decreased when the pulse on time was increased.
Velusamy Senthilkumar [3] evaluates effect of Titanium Carbide particle addition in the aluminum composition EDM process parameters. The Machining of hard materials such as metal matrix composites (Al/TiC) to a high degree of accuracy and surface finish is difficult. Electrical discharge machining (EDM) is an important process for machining difficult-to-machine materials like metal matrix composites. EDM is an effective tool in shaping such difficult-to machine materials. The objective of this work is to investigate the effect of current (C), Pulse On-Time (POT) and flushing pressure (P) on Metal Removal Rate (MRR), Tool Wear Rate (TWR) during electrical discharge machining. A copper tool of diameter 7mm was used to drill the specimen. An L9 orthogonal array (OA), for the three machining parameters at three levels each, was opted to conduct the experiments. Analysis of variance (ANOVA) was performed to find the validity of the experimental plan followed in the present work. An attempt was also made in the present work to study the effect of Tic particle addition on the Electrode Wear Ratio (EWR), a new parameter taking into consideration both MRR and TWR.
III.
M
ETHODOLOGYTaguchi‟s method is a powerful technique for the design of a high quality system. It provides not only, an efficient, but also a systematic approach to optimize designs for performance and quality. Furthermore, Taguchi parameter design can reduce the fluctuation of system performance and quality to the source of variation.
The basic steps for the methodology are: A.
Identify the quality characteristics and select process parameters to be evaluated.
Select the appropriate orthogonal array and assign these parameters to the orthogonal array. Conduct the experiments based on the arrangement of the orthogonal array.
(iv)Analyze the experimental results using the signal to noise(S/N) ratio and analysis of variance (ANOVA).
Experimental Design B.
1) Step1- Selection of process parameters: Process parameters and their ranges were determined by the trial tests. The parameters are identified for the test such as current, pulse-on and feed rate. Which are reported to be the main parameters in the process of EDM machining.
2) Step 2- Selection of orthogonal array: To select an appropriate orthogonal array for the experiments, on the basis of parameter selection and its levels. Here we have three parameters and three levels are selected.
3) Step 3- Recording of responses: Nine experimental runs were conducted as per the Taguchi‟s L9 orthogonal array. The test runs were carried out at random to avoid a systematic error creeping into the experimental procedure.
4) Step 4- Calculation of signal-to-noise ratio: In the Taguchi‟s method, the signal-to-noise ratio is used to measure the quality characteristics and also to evaluate the influence of each selected factor on the responses. The signals indicate the effect of selected factors on the average responses. The noises are measured by the deviations from the average responses, which would reveal the sensitiveness of the experiment output to the noise factors. Therefore, the S/N ratio is the ratio of the mean to the square of the deviation.
5) Step 5- ANOVA analysis: The analysis of variance (ANOVA) is used to discuss the relative importance of all control factors on the machined material quality and also to determine which control factor has the most significant effect. Analysis of variance (ANOVA) is employed to find the optimal process parameter levels and to analyze the effect of these parameters on metal removal rate values and electrode wear rate.
IV.
E
XPERIMENTATIONOrthogonal Arrays (often referred to Taguchi Methods) are often employed in industrial experiments to study the effect of several control factors. In this experimental work which consists of L-9 orthogonal array based on Taguchi design. Orthogonal array will reduce the total number of experiments.
Experimental Setup A.
Fig. 1: EDM machine Working
The work piece and tool were connected to the negative and positive terminals of the power supply, respectively. The dielectric fluid used here is EDM oil. The time taken for machining was recorded. The machining was signaled by the emergence of the dielectric jet through the bottom of the work piece. The experiments were conducted in the order of L9 orthogonal array. At the end of each experiment, the work piece was removed from the machine, washed, dried and weighed on an electronic balance.
Selection of Work Piece B.
Die steel H13 is an important tool and dies material, mainly because of its high strength, high hardness, and high wear resistance. It has a high strength due to that it cannot be easily machinable by conventional machining techniques. EDM is a non-conventional machining process that removes material by thermal erosion, such as melting and vaporization of material. To understand the machining characteristics of Die steel H13 grade steel by EDM is explored in this experimental study.
Die steel H13 material is used for blanking and stamping dies, Punches, Rotary shear blades, Thread cutting tools, Milling cutters, Reamers, Measuring tools, Gauging tools, Wood working tools, Broaches, Chasers. Ideal type oil-hardened steel which is economical and dependable for gauging, cutting and blanking tools as well as can be relied for hardness and good cutting performance. Die steel H13 is an electric-furnace melted, oil-hardened, on-shrinking, general-purpose tool steel. It is chemically composed of approximate
Table - 1
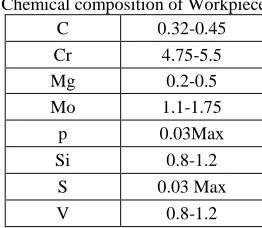
Chemical composition of Workpiece
C 0.32-0.45
Cr 4.75-5.5
Mg 0.2-0.5
Mo 1.1-1.75
p 0.03Max
Si 0.8-1.2
S 0.03 Max
V 0.8-1.2
The hardening temperature of Die steel H13 is between 790 degrees Celsius and 820 degrees Celsius. Die steel H13 is a high carbon Alloy steel which achieves a high degree of hardness with compressive strength and abrasion resistance.
V.
T
AGUCHI’
S DESIGN OF EXPERIMENTMINITAB 16 provides both static and dynamic response experiments in a static response experiment; the quality characteristic of interest has a fixed level. The goal of robust experimentation is to find an optimal combination of control factor settings that achieve robustness against (insensitivity to) noise factors. Which calculates response tables and generates main effects and interaction plots for:-
Signal-to-Noise Ratios (S/N ratios) vs. the Control Factors A.
number of experiments at the later stage. In addition, the comparison of the results would-be simpler. The levels of experiment parameters discharge current (I), Pulse on time (T on) and feed are shown in Table 1 and the design matrix is depicted in Table 2.
Table - 2
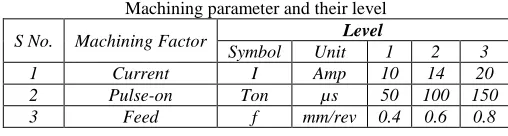
Machining parameter and their level
S No. Machining Factor Level
Symbol Unit 1 2 3
1 Current I Amp 10 14 20
2 Pulse-on Ton µs 50 100 150
3 Feed f mm/rev 0.4 0.6 0.8
VI.
D
ESIGN MATRIX AND OBSERVATION TABLEIn the study, three factors mixed level setup is chosen. This experiment has 3 variables at 3 different settings. A full factorial experiment would require 34 = 81 experiments. We conducted a Taguchi experiment with a L9 (34) orthogonal array (9 tests, 3 variables, 3 levels). The experiment design is shown in table 2.
Design of Experiments and Observation table A.
DOE (design of experiments) helps to investigate the effects of input variables (factors) on an output variable (response) at the same time. Here the input variables are current, pulse on and feed as shown in table 2.These experiments consist of a series of runs, or tests, in which purposeful changes are made to the input variables. Data are collected at each run and the output variables are MRR and TWR. The average results of MRR and TWR from OA L9 replication is calculated is shown in Table 3
Table - 4
The response table for MRR, TWR along with the input factors
Run I (Amp) Pulse on (µs)
Feed (mm/rev)
MRR (mm3/min)
TWR (gm/min)
1 10 50 0.4 11.655 0.01236
2 10 100 0.6 9.861 0.01034
3 10 150 0.8 10.256 0.00768
4 14 50 0.6 10.683 0.01075
5 14 100 0.8 14.245 0.01533
6 14 150 0.4 12.805 0.01275
7 20 50 0.8 12.210 0.01285
8 20 100 0.4 17.094 0.01480
9 20 150 0.6 21.367 0.01825
VII.
R
ESULT AND DISCUSSIONResponse Table A.
The Response Table contains a row for the average signal to noise ratio for each factor level. The response table for MRR and TWR are shown in table 5 and table 9 respectively along with the input factors. In Taguchi designs, ameasure of robustness used to identify control factors that reduce variability in a product or process by minimizing the effects of uncontrollable factors (noise factors). Control factors are those design and process parameters that can be controlled. Noise factors cannot be controlled during production or product use, but can be controlled during experimentation. In a Taguchi designed experiment, the results that identify optimal control factor settings that make the process or product robust, or resistant to variation from the noise factors. Higher values of the signal-to-noise ratio (S/N) identify control factor settings that minimize the effects of the noise factors. The signal-to-noise ratio measures how the response varies relative to the nominal or target value under different noise conditions.
Table - 5
Signal to noise ratio for various response factor MRR, TWR
Exp No S/N ratio MRR S/N Ratio for TWR
1 21.330 38.159
2 19.878 39.709
3 20.219 42.292
4 20.573 39.371
5 23.073 36.289
6 22.147 37.889
7 21.734 37.821
8 24.656 36.594
Influences on MRR B.
The S/N ratios for MRR are calculated as given in Equation.1. Taguchi method is used to analysis the result of response of machining parameter for larger is better criteria.
Larger is better S/N ratio= ∑ i-2) ………(1)
Where the S/N ratios calculated from observed values, yi represents the experimentally observed value of the ith experiment and n=1 is the repeated number of each experiment in L-9 OA is conducted. The analysis of variances for the factors is shown in table 4, is clearly indicates that the current is important fo influencing MRR comparing with pulse on and feed parameters. The delta values are current, pulse on and feed are 3.893, 1.775 and 1.036 respectively, depicted in table 5. The case of MRR, it is “Larger is better”, so from this table it is clearly definite that current is the most important factor then pulse on and feed of the tool.
Table - 6
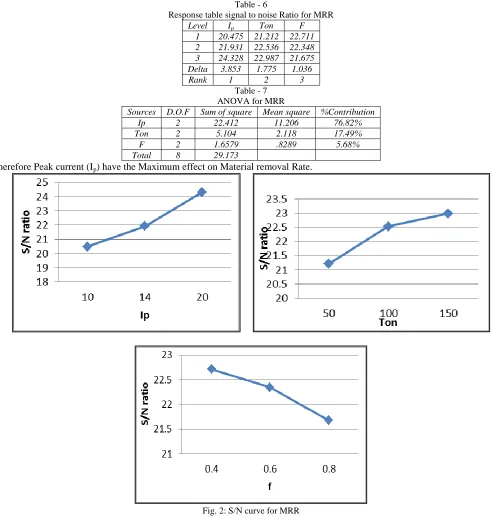
Response table signal to noise Ratio for MRR
Level Ip Ton F
1 20.475 21.212 22.711 2 21.931 22.536 22.348 3 24.328 22.987 21.675 Delta 3.853 1.775 1.036
Rank 1 2 3
Table - 7 ANOVA for MRR
Sources D.O.F Sum of square Mean square %Contribution
Ip 2 22.412 11.206 76.82%
Ton 2 5.104 2.118 17.49%
F 2 1.6579 .8289 5.68%
Total 8 29.173
Therefore Peak current (Ip) have the Maximum effect on Material removal Rate.
Smaller is better S/N ratio== ∑ i2) ………..(2)
The analysis of variances for the factors are current, pulse on , and feed as shown in table 6. The delta values of current, pulse on and feed are 3.658,1.28 and 0.144 respectively, in Table 9. The case of TWR Smaller is better, so from this table it is clearly definite that current (I) is the most important factor then pulse on (Ton) and feed.
Table - 8
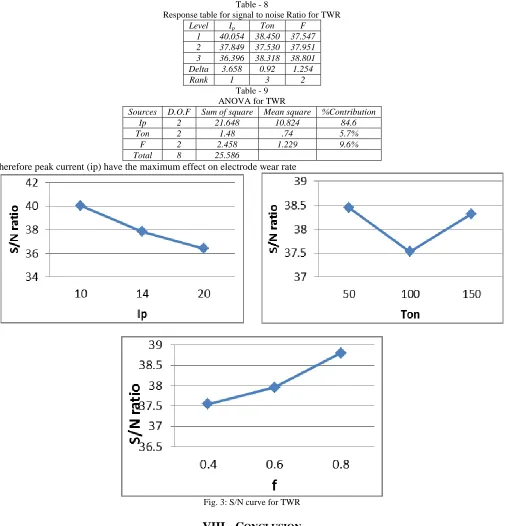
Response table for signal to noise Ratio for TWR
Level Ip Ton F
1 40.054 38.450 37.547 2 37.849 37.530 37.951 3 36.396 38.318 38.801 Delta 3.658 0.92 1.254
Rank 1 3 2
Table - 9 ANOVA for TWR
Sources D.O.F Sum of square Mean square %Contribution
Ip 2 21.648 10.824 84.6
Ton 2 1.48 .74 5.7%
F 2 2.458 1.229 9.6%
Total 8 25.586
Therefore peak current (ip) have the maximum effect on electrode wear rate
Fig. 3: S/N curve for TWR
VIII.
C
ONCLUSIONTWR. Thus, by utilizing experiment results and computed values of the S/N ratios, average effect response value and average S/N response ratios are calculated for MRR and TWR. The S/N ratio response graph for MRR and TWR is shown in Fig 2 and Fig 3.
On the basis of experimental results, calculated S/N ratio, analysis of variance (ANOVA) and „F‟ test values, the following conclusions are drawn for EDM of Die steel H13. Current is the most significant machining parameter for MRR and TWR in EDM of Die steel H13 Based on the analysis of S/N ratio of MRR, the optimal machining performance for MRR is obtained at current of 20 amps (level 1), pulse ON time of 150μs (level 2) and feed of 0.4mm/rev (level 3).
Based on the analysis of S/N ratio of TWR, the optimal machining performance for TWR is obtained at current of 10 amps (level 2), pulse ON time of 50μs (level 2) and feed of 0.8mm/rev (level 3).
Regardless of category of the performance characteristics, a greater S/N ratio value corresponds to a better performance. The optimal value of machining parameters is the level with the greatest S/N ratio value. Based on minimum number of trials conducted to arrive at the optimum cutting parameters, Taguchi‟s method seems to be an efficient methodology to find the optimum machining parameters.
R
EFERENCES[1] Rajmohan T. and Prabhu R., ”Optimization of Machining Parameters in Electrical Discharge Machining (EDM) of 304 Stainless Steel”, Procedia
Engineering 38 (2012) page 1030-1036.
[2] Y.K. Singh, Fundamental of Research Methodology and Statistics, 2nd ed., New Age International Pvt Ltd Publishers, 2006.
[3] Velusamy Senthilkumar, “Effect of Titanium Carbide particle addiction in the aluminium composite on EDM process parameters” Journal of
Manufacturing Processes 13 (2011) page 60-66.
[4] Kumar Sandeep, ”Current Research Trends in Electrical Discharge Machining: A Review” Research Journal of Engineering Sciences, Vol. 2(2), (2013)
page 56-60.
[5] Ajeet Bergaley,” Optimization of Electrical and Non Electrical Factors in EDM for Machining Die Steel Using Copper Electrode by Adopting Taguchi
Technique” International Journal of Innovative Technology and Exploring Engineering (IJITEE) ISSN: 2278-3075, Volume-3, Issue-3, August 2013
[6] S.Gopalakannan, “Modelling and Optimization of EDM Process Parameters on Machining of Al 7075-B4C MMC Using RSM”, Procedia Engineering 38 (
2012 ) page 685 – 690.
[7] Rahman M.M., Khan M.A.R., Kadirgama K., Noor M.M. and Bakar R.A., “Experimental Investigation into Electrical Discharge Machining of Stainless
Steel 304”,Journal of Applied Sciences, 11: 549-554.
[8] S. Gopalakannan, “Application of response surface method on machining of Al–SiC nano-composites” Measurement 46 (2013) 2705–2715
[9] I. Ayesta and B. Izquierdo, “Influence of EDM parameters on slot machining in C1023 aeronautical alloy” Procedia CIRP 6 ( 2013 ) 129 – 134.
[10] I. Puertas and C.J. Luis, “Analysis of the influence of EDM parameters on Surface quality, MRR and EW of W-Co”, Journal of materials Processing Technology 153-154 (2004) page 1026-1032.
[11] S Nizam Sadiq, “Optimization of Milling Parameters of OHNS steel using TiAlN coated cutter by Design of Experiment technique” International Journal
of Mechanical Engineering and Robotics Research, Vol. 3, No. 1,January 2014, ISSN 278 – 0149
[12] M. Kiyak,“Examination of machining parameters on surface roughness in EDM of tool steel”, Journal of Materials Processing Technology 191 (2007) 141–
144.
[13] Sameh S. Habib, “Study of the parameters in electrical discharge machining through response surface methodology approach” Applied Mathematical
Modelling 33 (2009) 4397–4407
[14] S. Assarzadeh, “Statistical modeling and optimization of process parameters in electro-discharge machining of cobalt-bonded tungsten carbide composite
(WC/6%Co)” Procedia CIRP 6 ( 2013 ) 463 – 468.
[15] F. Klocke, “Analysis of material removal rate and electrode wear in sinking EDM roughing strategies using different graphite grades”, Procedia CIRP 6 (
2013 ) 163 – 167.
[16] Sanjeev Kumar, “Surface modification by electrical discharge machining: A review”, Journal of Materials Processing Technology 209 (2009) 3675–3687
[17] C R Kothari,”Research Methodology Methods and Techniques”, 3rd ed., New Age International Pvt Ltd Publishers,2014.