240
Characteristics of Credit Instruments Issued by Stokvels in South Africa Lindiwe Ngcobo, Joseph Chisasa
University of South Africa, Pretoria, South Africa [email protected]
Abstract: Access to formal credit and other financial instruments remains a challenge for the majority of households in South Africa. The objective of this study was, therefore, to determine the characteristics of credit instruments issued by stokvels to households in South Africa. Prior studies have generally focused on mobilization of savings through stokvels while none has paid particular attention to the credit supply function of stokvels. This study attempts to fill this gap by using a self-administered research questionnaire on a sample of 386 respondents. Members of stokvels were surveyed from the cities of Pretoria and Johannesburg in the Gauteng province of South Africa. Data was analysed using descriptive statistics, exploratory factor and correlation analyses. Results show that stokvels issue short-term loans from less than 3 to 6 months. Interest rates are high ranging from 25% to 35% and are charged monthly. Loan sizes are small with approximately two-thirds of the respondents receiving loans above R500 while the remaining third received less than R500. Finally, all loans are secured by the borrower’s identification document or bank card and personal identification number. The results of this study have policy implications for financial institutions in South Africa.
Keywords: Credit, Savings, Stokvel, Households, South Africa, Exclusion 1. Introduction
South Africa still remains one of the countries in the world with the highest income inequality (World Bank Report, 2006). Almost half of the population continues to live under the poverty datum line (Adelzadeh, 2006). During apartheid rule, black South Africans were excluded from utilising most aspects of the formal financial and banking sector. The state severely restricted Africans’ access to formal credit. Moreover, the restriction on private ownership of council-owned homes, low wages and few opportunities for formal entrepreneurship added to the severe restriction of formal credit. The state erected numerous barriers to black home ownership, to accessing finance and to operating licensed business. It is no surprise that there developed a strong demand in urban townships for access to consumer credit. The 2011 census reported that South Africa has about 56 million people consisting of Africans (76,4%), Whites (9,1%), Coloured (8,9%), Asian (2,5%) and Other (0,5%). South Africa has eleven official languages, different cultures and religion. The economy of South Africa is the second largest in Africa after Nigeria. According to Statistics South Africa (2017), South Africa experienced a decrease of 0.7% in GDP during the first quarter of 2017, following a 0.3% contraction in the fourth quarter of 2016. The unemployment rate in South Africa increased to 27.7 percent in the first quarter of 2017 compared to 26.5 percent in the previous period. What is evident from these summary statistics is that innovative solutions are required to avert a further deterioration of the economy, stimulate saving and investment at all levels of society.
241
Stokvels are growing in popularity as a savings vehicle albeit official statistics indicating that South Africa has a very low saving rate (Moyagabo, 2015).
Since stokvels attempt to fill the gap created by formal financial institutions such as commercial banks by providing credit, the objective of this study was to examine the characteristics of credit instruments issued by stokvels to households in South Africa. This is important for South Africa in light of the growing population and rising unemployment, which requires improved access to finance to the poor in order to stimulate entrepreneurship and self-reliance. Findings from this study help South African authorities to develop and implement proper stokvels growth and promotion frameworks that will in the long run infuse into the development agenda of the country. The study also helps to conscientise all economic agents of the meaningful role that stokvels can play in promoting financial inclusion. Through stokvels credit instruments, the previously financially excluded people because they are not employed and they do not possess collateral security to become part of the mainstream economic activities. That is what this paper highlighted, knowledge upon which South African financial and monetary authorities can use to address the triple challenges of unemployment, poverty and inequality. The rest of the paper proceeds as follows. Section 2 presents the theoretical framework upon which this paper is premised. Section 3 discusses the methodology applied. In Section 4, the empirical results are presented and discussed. The conclusion and recommendations flowing from this study are presented in Section 5.
2. Theory of Credit
Economists often frame borrowing as “consumption smoothing” so that poor and unemployed people can continue spending even if income decreases or expenses increase. Most poor and unemployed people engage in borrowing for this reason from time to time (Demirguc-Kunt et al., 2012). They may want to buy or renovate a house, to invest in an education or to pay for a wedding. The lack of funds with which to meet these demands results in people having to borrow in order to bridge this financial deficit. Individuals, government, private firms and banks are some of the suppliers of credit. Banks have tended to see lending as an autonomous activity that precedes savings (FinMark Trust, 2012). They have therefore been reluctant to lend to poor and unemployed households because both collaterals in the form of fixed property and repayment ability has been seen to be lacking. In South Africa, township dwellings and movable assets were inappropriate as security to financial institutions, yet until 1994 poor and unemployed households were prohibited from owning fixed property outside townships. Furthermore, as a rule, few people maintained bank accounts or savings accounts at the Post Office or in building societies (Murray-West, 2017).
Banks and other formal lenders (Mashigo, 2012) consider lending to poor and unemployed people who do not have any significant assets that can be used as collateral for obtaining credit risky. This is because lenders use these assets as a fall-back position should the borrower default on credit repayment. To circumvent this liquidity constraint, households turn to stockvels for credit. An examination of the attributes of credit obtained from stokvels shows that in the absence of steady livelihood options, these poor and unemployed people often purchase items for day-to-day household consumption (both food and non-food) on credit from the local grocery store/spaza shop (Terblanche, 2010). They also seek to obtain small loans from friends, relatives and neighbours for daily subsistence needs and petty transactions of necessity. Consistent with formal banking practice, stokvels require collateral security for credit granted. However, both own funds and non-current assets which can provide security for loans are relatively rare (Schulze, 1997). A borrower has to disclose his assets to the stokvel. These assets will be used as a guarantee for the loan repayment. According to James (2014), stokvel moneylenders hold customers’ ATM cards as collateral. The bank cards are used to withdraw the money owed to the lender at month end before returning them to their owners.
242
charges which banks impose on their clients on transaction made. Banks do not offer easy access to loans to members of stokvel as they save in groups. It is clear that financial institutions are not attractive to the very poor households and unemployed. In addition to transaction costs, a typical credit transaction attracts an interest rate. Interest is paid periodically, say monthly, semi-annually or annually. In South Africa, the current interest rate is 10.25% (SARB, 2017).
3. Methodology
This study follows a survey research design using a quantitative research approach. The quantitative research design for this paper is premised on the use of survey primary data obtained from the stokvels members in the Gauteng province. The quantitative research design is the best for the study because of three reasons. Firstly, the survey data collected is quantitative in nature. Secondly, the approach uses numeric data to generate statistical values and empirical models which can easily be used to describe the characteristics of credit instruments issued by stokvels, consistent with Ivankova (2015). Credit transactions are issued for short-, medium- and long-term. The duration of the loan depends on the purpose for which the credit is required coupled with the borrower’s capacity to repay (Joseph, 2013). The population of the study consisted of stokvel members based in the Gauteng province of South Africa. Three major reasons behind the choice of the target population are as follows the Gauteng province is in close proximity. Main researcher, low travelling costs of collecting data are incurred because the researcher resides in the Gauteng province and lastly because the Gauteng province is the economic hub of South Africa where the credit instruments issued by stokvels are most pronounced. Using purposeful sampling, the respondents were drawn from the Gauteng province’s two major cities of Pretoria and Johannesburg.
Consistent with an earlier argument, these two cities are not only where the largest number of stokvels are concentrated in South Africa but it is where the majority of stokvels avails some form of credit instruments mainly to their members. Primary research was conducted using the self-administered research questionnaires that were given to a sample size of six hundred (600) members of stokvels to fill in. In support of Martinez-Mesa et al. (2014) argument, the larger sample size is normally associated with greater precision. It is against this backdrop that the current study chose a sample size of 600 respondents. However, three hundred and eighty-six (386) questionnaires made the final sample as others did not respond. The final sample or study population is still large enough to ensure precision, meaningful results and conclusions, consistent with Martinez-Mesa et al. (2014) and Kim et al. (2016). Biographical and general information about the members of the stokvels over and above the credit instruments related information offered by stokvels characterised the major information that questionnaires sought to extract. Following Mellor and Moore (2014) and Sullivan and Artino (2013), data was collected using a self-administered questionnaire using a 5-point Likert scale. In order to ensure the validity and reliability of the data, the research instrument was subjected to a pilot test. Results of the pilot test confirmed the reliability of the research instrument with a Cronbach alpha value greater than the threshold of 0.7. Respondents were not compelled to answer the questionnaire. Consistent with Cooper and Schindler (2011), the study kept all the respondent information in confidence.
243
Following Flick (2006), the researcher ensured that the study posed no harm to the respondents. Respondents were not compelled to answer the questionnaire. Consistent with Cooper and Schindler (2011), the study kept all the respondent information in confidence.
4. Results Discussion, Interpretation and Findings
In this section, the empirical results of the study are presented and discussed. First, the demographic characteristics of the respondents are presented and subsequently the results of the descriptive and correlation analyses.
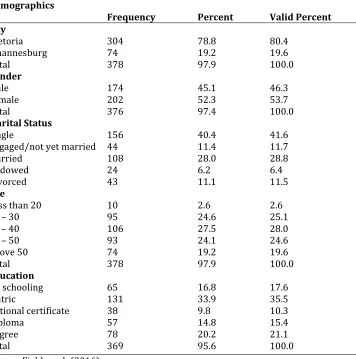
Summary of the Demographic Information: Table 1 below presents the sample demographic information which includes the city in which respondents reside, either Pretoria or Johannesburg, gender, marital status, age and level of education of the respondents.
Table 1: Summary of Demographic Information Demographics
Frequency Percent Valid Percent
City
Pretoria 304 78.8 80.4
Johannesburg 74 19.2 19.6
Total 378 97.9 100.0
Gender
Male 174 45.1 46.3
Female 202 52.3 53.7
Total 376 97.4 100.0
Marital Status
Single 156 40.4 41.6
Engaged/not yet married 44 11.4 11.7
Married 108 28.0 28.8
Widowed 24 6.2 6.4
Divorced 43 11.1 11.5
Age
Less than 20 10 2.6 2.6
21 – 30 95 24.6 25.1
31 – 40 106 27.5 28.0
41 – 50 93 24.1 24.6
Above 50 74 19.2 19.6
Total 378 97.9 100.0
Education
No schooling 65 16.8 17.6
Matric 131 33.9 35.5
National certificate 38 9.8 10.3
Diploma 57 14.8 15.4
Degree 78 20.2 21.1
Total 369 95.6 100.0
Source: Field work (2016)
244
accessible to commute by public transport (train and taxis) with time spent of 30 minutes while it takes 1hour 30 minutes to the city of Johannesburg. The summary results are presented in Table 1 above.
Gender: Males who participated in the survey were 174, representing 45,1% of the total sample (N=386) with females accounting for a majority of 52,3% of the total sample while 2.6% did not indicate their gender. The large number of females participating in stokvels dates back around the 1930s when there was an influx of rural-urban migration particularly amongst women as they arrived in the cities and towns to join their husbands who were working in mines. According to Buijs (2002), most women participated in stokvels because they were poor, uneducated and unemployed. Those who were employed and earned lower income supplemented it with being involved in stokvels (Mboweni, 1990).
Marital Status: An analysis of the marital status shows that most of the respondents were single (40.4%) (N=386), followed by married respondents (28.0%). Those who were either engaged or not yet married constituted 11.4% of the sample while 6.2% were divorced.
Age: Most of the respondents (27.5%) were in the age group of 31-40 years. Interestingly, some of the members of stokvels were young, (less than 30) and constituted 46.4% of the sample. Approximately 24.1% were between 41 and 50 years old while 24.1% were above 50 years old.
Education: The results for education showed that most of the respondents (33.9%) had matric education, followed by degree holders constituting approximately 20.2% of the total sample. A total of fifty-seven (14.8%) respondents were found to be holders of diplomas. Those with no schooling at all were 16.8% of the total sample. Finally, there were 38 respondents (9.8%) who were holders of the national certificate. These results confirm Berg and Karlsen’s (2012) argument that education results in the empowerment of people and enables them to think clearly and act effectively to achieve self-selected goals and aspirations.
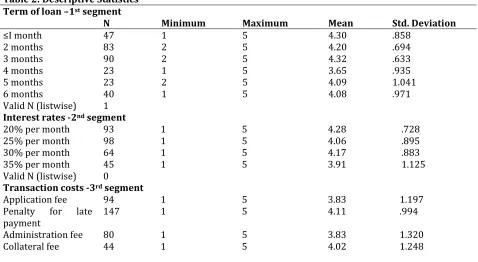
Characteristics of Credit Instruments Issued by Stokvels in South Africa: Descriptive statistics of the term of the loan, interest rates, transaction costs, loan amount, collateral security and the lending process (see Table 2) is the first sub-heading under which the characteristics of credit instruments issued by stokvels are discussed. Correlation analysis of types of collateral (see Table 3) and that of the credit assessment criteria (refer to Table 4) are the other sub-headings which guided the discussion on the characteristics of credit instruments issued by stokvels in South Africa.
Table 2: Descriptive Statistics Term of loan –1st segment
N Minimum Maximum Mean Std. Deviation
≤I month 47 1 5 4.30 .858
2 months 83 2 5 4.20 .694
3 months 90 2 5 4.32 .633
4 months 23 1 5 3.65 .935
5 months 23 2 5 4.09 1.041
6 months 40 1 5 4.08 .971
Valid N (listwise) 1 Interest rates -2nd segment
20% per month 93 1 5 4.28 .728
25% per month 98 1 5 4.06 .895
30% per month 64 1 5 4.17 .883
35% per month 45 1 5 3.91 1.125
Valid N (listwise) 0
Transaction costs -3rd segment
Application fee 94 1 5 3.83 1.197
Penalty for late
payment 147 1 5 4.11 .994
Administration fee 80 1 5 3.83 1.320
245
Valid N (listwise) 27Loan amount -4th segment
≤R200 31 2 5 4.16 .820
201 – 300 26 2 5 3.81 .981
401 – 500 43 2 5 4.23 .684
>500 200 1 5 4.28 .840
Valid N (listwise) 0 Source: Fieldwork, 2016
Term of the loan: Respondents were asked to indicate the term of the loan obtained from their stokvels. The purpose of this question was to determine whether stokvels issue short- or long-term loans as is the case with formal financial institutions. Table 2-first segment presents the descriptive statistics of the responses on term of the loan. The highest mean was “the term of the loan from my stokvel is, 3 months” with a numerical value of 4.32. The lowest mean was “the term of the loan from my stokvel is, 4 months” with a numerical value of 3.65. This implies that, the majority of the respondents agree that participating in stokvels members repay their debt in a certain period, usually three to four months. This finding is consistent with Matuku and Kaseke (2014) whose study noted that as a risk management strategy, the term to maturity of the stokvel loans is very short (usually three to six months).
Interest Rates: The study sought to establish the interest rates levied on credit by stokvels on their members. To this end, respondents were asked to state the interest rate charged by their stokvel when they borrow the money. Table 2, 2nd segment presents the mean and standard deviation for the factor interest rates based on data obtained from sampled respondents. The highest mean was “the interest rate on loans from my stokvel is, 20% per month” with a numerical value of 4.28. The lowest mean was “the interest rate on loans from my stokvel is, 35% per month” with a numerical value of 3.91. This implies that, the majority of the stokvel respondents agree that members repay their debt with interest rate, consistent with Matuku and Kaseke (2014). These results are also in sync with those of Bozzoli, 1991) who opines that stokvel credit is available at low-interest rates to stokvel members and can also be extended to non-members at high-interest rates.
Transaction Costs: Further to the interest rates charged by stokvels, the study sought to establish if stokvel members are charged transaction costs on credit as is the case with formal credit providers. Table 2, 3rd segment shows that stokvels charge application fees, administration fees, the penalty for late payment and collateral fees to all members applying for credit, consistent with Matuku and Kaseke (2014). Details of the means and standard deviations among responses are in Table 2, 3rd segment. Transaction costs such as application and administration fees had the lowest mean, whose numerical value was 3.83. The penalty for late payment was characterised by the highest mean value of 4.11, a reason why most stokvel members pay their debt in time in order to avoid incurring these punitive extra costs.
246
Figure 1: Type of CollateralConsistent with Schreiner (2000) there is no paperwork that is involved in the lending process because the lenders know their clients’ character behaviour and loyalty. Their relationship is based on loyalty and trust as they build a clean repayment or creditworthiness record.
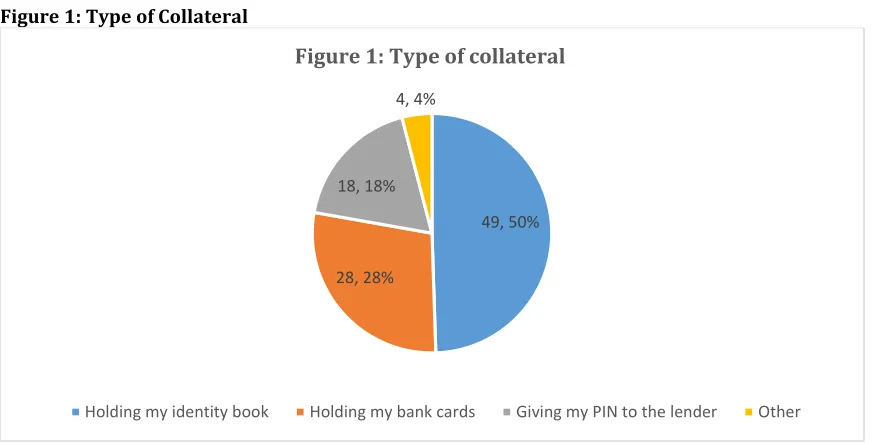
Collateral: When asked to state the type of collateral required by stokvels as a condition for accessing loans, respondents indicated that loans were secured by “holding my identification book” with a mean numerical value of 3.74 (N = 156). The second highest mean was “my loans received from my stokvel were secured by, other” with a numerical value of 3.36 (N = 11). The third highest mean was “my loans received from my stokvel were secured by, holding my bank card(s)” with a numerical value of 3.33 (N = 89). The lowest mean was “my loans received from my stokvel were secured by, giving the PIN to the lender” with a numerical value of 3.18 (N = 57). Literature review states that, there is no paperwork for making an application for credit in stokvel, you need a steady job and bank Automatic Teller Machine (ATM) card with a personal identification number (PIN) that are kept by stokvels money lenders / mashonisa after credit has been granted. Credit repayment can be made next payday or within 30days after taking out the stokvel personal loan. These results confirm that members of stokvels are required to tender collateral security for all loans applied for, consistent with Wilkinson and Birmingham (2013). This implies that, the majority of the stokvel respondents agree that none of the members want to be viewed by others as irresponsible and their mutuality binds them together and improves their joint commitment to the smooth running of their financial activities (Verhoef, 2001; Schreiner, 2000). What is evident from Figure 1 below is that the majority of the respondents agree that when participating in stokvels’ credit granting business, sufficient collateral is required to cover the amount of the loan should a member fail to repay the loan. These results are similar to those of Wilkinson and Birmingham (2013).
Correlation Analysis of Types of Collateral: Respondents were asked to state the form of collateral requested by their stokvels when borrowing and the responses were presented in the form of pairwise relationships. The summary correlation results emanating from these responses are presented in Table 3.
Table 3: Correlation Matrix for Types of Collateral used by Stokvels
Holding my
identification book Holding bank card(s) my Giving the PIN to the lender Other
Holding my
identification book Pearson Correlation 1 0.768
** 0.778** 1.000**
Sig. (2-tailed) 0.000 0.000 .
N 156 25 25 2
49, 50%
28, 28% 18, 18%
4, 4%
Figure 1: Type of collateral
247
Holding my bankcard(s) Pearson Correlation 0.768
** 1 1.000** 1.000**
Sig. (2-tailed) 0.000 0.000 .
N 25 89 24 2
Giving the PIN to the
lender Pearson Correlation 0.778
** 1.000** 1 1.000**
Sig. (2-tailed) 0.000 0.000 .
N 25 24 57 2
Other Pearson
Correlation 1.000
** 1.000** 1.000** 1
Sig. (2-tailed) . . .
N 2 2 2 11
*** Correlation is significant at the 0.01 level (2-tailed). Source: Fieldwork, 2016
Significant positive correlations were observed between (1) holding the borrowing member’s identification book and the borrower’s bank card (p=0.000), (2) holding the borrowing member’s identification book and giving the PIN to the lender and (3) holding borrower’s bank cards and giving the PIN to the lender (stokvel). These results are logical and make theoretical sense because the lender (stokvel) would certainly require the borrower’s bank card together with the PIN in order to withdraw funds from the ATM to recover the outstanding amount, in line with James’s (2014) argument. Furthermore, holding the borrower’s identification document and bank cards restrict the borrower from many other engagements for which an identification document is required, thus compelling the borrower to repay the loan and recover the identification book. This finding resonates with Kibuuka (2006) whose study implied that social collateral and holding of bank cards and identification documents is the most important form of collateral security required by stokvels in the lending process. Last but not least, holding on to the borrower’s identification book and the PIN ensures that the borrower cannot clandestinely change the PIN code without the knowledge of the stokvel.
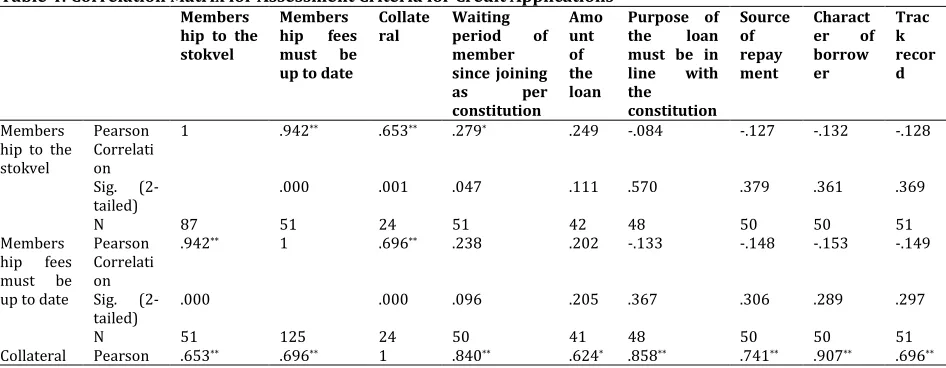
Correlation Analysis of the Credit Assessment Criteria: In order to determine the assessment criteria of credit applications by stokvels in the Gauteng Province, respondents were asked to identify several criteria from a given list guided by literature. The purpose was to establish the difference between the assessment criteria of formal lending institutions from those of stokvels. Results show that in order for a member to access credit from the stokvel, all membership fees must be up-to-date, the borrower must have collateral to hedge the stokvel against default risk and the member needs to have served for a certain time before they can qualify for credit from the stokvel. The correlation matrix for assessment criteria for credit applications is presented in Table 4.
Table 4: Correlation Matrix for Assessment Criteria for Credit Applications
Members hip to the stokvel
Members hip fees must be up to date
Collate
ral Waiting period of member since joining as per constitution Amo unt of the loan
Purpose of the loan must be in line with the constitution Source of repay ment Charact er of borrow er Trac k recor d Members hip to the stokvel
Pearson Correlati on
1 .942** .653** .279* .249 -.084 -.127 -.132 -.128
Sig.
(2-tailed) .000 .001 .047 .111 .570 .379 .361 .369
N 87 51 24 51 42 48 50 50 51
Members hip fees must be up to date
Pearson Correlati on
.942** 1 .696** .238 .202 -.133 -.148 -.153 -.149
Sig.
(2-tailed) .000 .000 .096 .205 .367 .306 .289 .297
N 51 125 24 50 41 48 50 50 51
248
Correlation
*
Sig.
(2-tailed) .001 .000 .000 .001 .000 .000 .000 .000
N 24 24 37 24 24 24 24 24 24
Waiting period of member since joining as per constituti on Pearson Correlati on
.279* .238 .840** 1 .217 .221 .215 .221 .187
Sig.
(2-tailed) .047 .096 .000 .178 .140 .142 .130 .198
N 51 50 24 102 40 46 48 48 49
Amount of the loan
Pearson Correlati on
.249 .202 .624** .217 1 .406** .403** .381* .395*
Sig.
(2-tailed) .111 .205 .001 .178 .009 .009 .014 .011
N 42 41 24 40 51 40 41 41 41
Purpose of the loan must be in line with the constituti on
Pearson Correlati on
-.084 -.133 .858** .221 .406* *
1 .949** .946** .944**
Sig. (2-tailed)
.570 .367 .000 .140 .009 .000 .000 .000
N 48 48 24 46 40 65 48 48 48
Source of repaymen t
Pearson Correlati on
-.127 -.148 .741** .215 .403* *
.949** 1 .974** .986**
Sig.
(2-tailed) .379 .306 .000 .142 .009 .000 .000 .000
N 50 50 24 48 41 48 71 50 50
Character of borrower Pearson Correlati on
-.132 -.153 .907** .221 .381* .946** .974** 1 .982**
Sig.
(2-tailed) .361 .289 .000 .130 .014 .000 .000 .000
N 50 50 24 48 41 48 50 61 50
Track
record Pearson Correlati on
-.128 -.149 .696** .187 .395* .944** .986** .982** 1
Sig.
(2-tailed) .369 .297 .000 .198 .011 .000 .000 .000
N 51 51 24 49 41 48 50 50 70
**. Correlation is significant at the 0.01 level (2-tailed). *. Correlation is significant at the 0.05 level (2-tailed). Source: Fieldwork, 2016
249
5. Conclusion and RecommendationsIn Gauteng province, poor and unemployed households often use loans to cope with health shocks, pay for children school fees, pay for insurance (burial societies and funeral parlour) and put food on the table for families. They contribute their savings monthly. The objective of this paper was to determine the characteristics of credit instruments issued by stokvels to members. The paper has shown that credit is available at low interest to members of stokvels. Stokvels issue short-term loans from 3 to 6 months. Interest rates are high ranging from 25% to 35% and are charged monthly. Loan sizes are small with approximately two-thirds of the respondents receiving loans above R500 while the remaining third received less than R500. The study concludes that households look for alternatives in order to satisfy their financial needs which the formal financial system fails to fulfil. What emerges from this study is that, households prefer financial independence irrespective of the level of income. The poor households of South Africa who do not have access to credit and other financial services, fill this gap by forming stokvels whose prime purpose is to mobilise savings for the benefit of those who are financially excluded.
It is also evident from the results of this study that members of the poor South African society seek convenient and low-cost financial services. Thus, this paper recommends a review of bank product portfolios to include financial services tailor-made for poor households. This will help eliminate financial exclusion to improve bank profitability through appropriately packaged products. The study also urges South African authorities to implement policies that strengthen the participation of the poor in economic activities through promoting stokvels and other pro-poor savings and investment vehicles. One of the limitations of the current study is that it collected data only from the Gauteng province due to financial and time constraints, therefore the results cannot be generalised for the whole country. Subject to time and financial resources availability, future studies should investigate the credit characteristics of stokvels in all provinces of South Africa such that the results can be more useful for national policy formulation. Further research should explore how the government can capacitate and strengthen the stokvels to enable them to play a meaningful role in reducing unemployment, inequality and poverty in South Africa.
Acknowledgement: This research paper is a product of my unpublished Master Degree thesis entitled: The nature and characteristics of credit instruments issued by stokvels in South Africa". My Master Degree thesis is found in the UNISA repository but it is unpublished material. In other words, the high similarity index does not matter because my Master Degree thesis from which the current article is a product is actually an unpublished material.
References
Adelzadeh, A. (2006). Overcoming Unemployment. Strategies for giving the effect to the Right to Work District Six Museum Alternate Information Development Centre. 12-15 June.
Babbie, E. (2007). The Practice of Social Research. 11th Edition. Belmont, California: Wardsworth Publishing Company.
Berg, M. E. & Karlsen, J. T. (2012). An evaluation of Management Training and Coaching. Journal of Workplace Learning, 24(1), 177-199.
Bozzoli, B. (1991). Women of Phokeng: Consciousness, Life Strategy and Migrancy in South Africa. Ravan Press, 144-143.
Buijs, G. (2002). Rotating credit associations: Their formation and use by a poverty-stricken woman in Rhini, Grahams town, Eastern Cape. Africanus Journal of Development Studies, 32(1), 27-42.
Burkett, I. & Sheehan, G. (2009). From the Margins to the Mainstream. The Challenges for Microfinance in Austria. Foresters Community Finance, 1-64.
Cooper, D. & Schindler, P. (2011). Business research methods”. 11th edition, Boston, MA: McGraw-Hill Higher Education.
Creswell, J. (2003). Research design, qualitative, quantitative and mixed methods approach, 2nd Edition. De Cock, C., Fitchett, J. & Volkmann, C. (2005). Constructing the New Economy: A Discursive perspective.
British Journal of Management, 16(1), 37-49.
250
Flick, U. (2006). An Introduction to Qualitative Research. Qualitative Research in Psychology, 4, 259–260. Floro, M. S. & Seguino, S. (2002). Gender effects on Aggregate Saving. Working Paper No. 23, Washington.
Policy Research Report on Gender and Development.
Finmark Trust. (2012). Savings and credit groups – an opportunity for formal financial services providers. Media Release, 04 July.
Greg, C. (2011). Credit reporting base on the pyramid. CGAP, 01 October.
Helms, B. (2006). Access for All: Building inclusive financial systems. Washington, D.C: World Bank. Ivankova, N. V. (2015). Mixed methods applications in action research: From methods to community action.
Thousand Oaks, CA: Sage Publishing.
James, D. (2014). Deeper into a Hole?” Borrowing and Lending in South Africa. Current Anthropology, 55(9), 17-29.
Joseph, C. (2013). Advanced Credit Risk Analysis and Management. Wiley, Finance.
Kibuuka, L. E. (2006). Informal finance for the middle and high-income individuals in South Africa; A case study of high budget “stokvels” in Pretoria. Masters Degree, Unpublished. The University of Pretoria. Kim, H., Ku, B., Kim, J. Y., Park, Y. & Park, Y. (2016). Confirmatory and exploratory factor analysis for validating
the Phlegm pattern questionnaire for healthy subjects. Evidence-Bas Complementary and Alternative Medicine, Article ID 2696019, 1-8.
Martinez-Mesa, J., Gonzalez-Chica, D. A., Bastos, J. L., Bonamigo, R. R. & Duquia, R. P. (2014). Sample size: How many participants do I need in my research? Anais Brasileiros De Dermatologia, 89(4), 609-615. Mashigo, P. & Schoeman, C. (2010). Stokvels as an instrument and channel to extend credit to poor
households in South Africa: An enquiry. University of Johannesburg, 19, 1-11.
Mashigo, M. P. (2012). The lending practices of township micro-lenders and their impact on the low-income households in South Africa: A case study for Mamelodi Township. New Contree, No. 65 (December). Matuku, S. & Kaseke, E. (2014). The role of stokvels in improving people’s lives: The case in Orange Farm,
Johannesburg, South Africa. Social Work, 50(4), 504-515.
Mboweni, T. (1990). Stokvels in South Africa: Informal Savings Schemes by Black for the Black Community. Amagi Books: Johannesburg.
Mellor, D. & Moore, K. A. (2014). The use of Likert scales with children. Journal of Paediatric Psychology, 39(3), 369-379.
Moyagabo, M. (2015). Stokvels: The cash alternative. Financial Mail, July 30.
Murray-West, R. (2017). Back to the future' savings passbook trumps the internet. The Telegraph. Naidoo, N. (2001). The secret world of stokvels. Natal Witness. 7 September.
SARB. (2017). https://www.resbank.co.za/Research/Rates/Pages/CurrentMarketRates.aspx
Schreiner, M. (2000). Informal finance and the design of microfinance. Development in Practice, 11(5), 637-640.
Schulze, W. G. (1997). The Origin and Legal nature of the Stokvel. Part (1) South African Mercantile Law Journal, 9(1), 153-170.
Statistics South Africa Census. (2011). Provinces at a glance: Migration, p.20
Statistics South Africa. (2017). www.statssa.gov.za/publications/P02111stQuarter2017.
Sullivan, G. M. & Artino, A. (2013). Analysing and interpreting data from Likert-Type Scales. Journal of Graduate Medical Education, 5(4), 541-542.
Terblanche, B. (2010). Good business revives spaza shops. Mail & Guardian, 23 August.
Verhoef, G. (2001). Savings and survival in a modern African economy: informal savings organisations and poor people in South Africa. Historia, 46(2), 519-542.