ORIGINAL ARTICLE
Research on the Error Averaging Effect
in A Rolling Guide Pair
Yanbing Ni
*, Haiyang Zhou, Cuiyan Shao and Jinhe Li
Abstract
By studying the effects of geometric precision on kinematic accuracy, an error mapping model has been established, based on the hypothesis that a motion pair and its installation surface are rigid. However, when using this assumption, there is a significant error induced in high-precision computer numerical control (CNC) machine tools as compared with reality. One of the most important reasons for this error is failing to consider the error averaging effect of motion pair elements. Therefore, this work examines a high-precision horizontal machining center as its research object, and analyzes the error averaging mechanism of a rolling guide pair under a deformation of the rolling elements. The car-riage bearing forces caused by guideway straightness errors are obtained by constructing a geometric error model of a single carriage. The relationship between guideway straightness errors and carriage bearing forces is described by a transfer function in the spatial frequency domain, and its characteristics are analyzed. It quantifies the so-called error averaging effect of the rolling guide system and, on this basis, a static model for four carriages is established to reflect the error averaging effect of the rolling guide pair on the position and orientation errors of the motion pair. In addition, it is found that the wavelengths and phase differences of guideway errors affect this error averaging mecha-nism, but the amplitude and preload have little influence thereon. The experiment result shows that the kinematic straightness errors in the x- and y-directions were approximately 1/3 to 1/2 of the guideway straightness errors in the corresponding directions. The results can be used to guide the precision design and assembly of machine tools. Keywords: Rolling guide pair, Error averaging mechanism, Guideway straightness errors, Precision design
© The Author(s) 2019. This article is distributed under the terms of the Creative Commons Attribution 4.0 International License (http://creat iveco mmons .org/licen ses/by/4.0/), which permits unrestricted use, distribution, and reproduction in any medium, provided you give appropriate credit to the original author(s) and the source, provide a link to the Creative Commons license, and indicate if changes were made.
1 Introduction
Geometric accuracy in forward design plays an important role in improving the precision of computer numerical control (CNC) machine tools. There has been significant research into the accuracy of designs from workpieces to machine tools, or from machine tools to motion pairs. However, a tolerance assignment cannot be accurately performed in a process of installing rolling guideways, because the transitive relationship between the pose errors of the motion pair and straightness errors of the guideway depend on the roller deformation produced by the bearing forces of carriages. The deformation causes the errors to equalize, but the error averaging mecha-nism is unknown. The existing methods assume that the rolling guideway pair is a rigid system for tolerance
distribution, resulting in poor precision. Specifically, the error averaging mechanism and analysis method from the motion pair to guideway installation surface become a bottleneck in the geometric accuracy-forward design of machine tools.
Aiming at this critical issue, many scholars have pro-posed modeling methods to predict pose errors of mov-ing parts through guideway straightness errors. There are many studies on hydrostatic guideways. Gao et al. [1] analyzed the static and dynamic characteristics of hydrostatic guides based on a progressive Mengen flow controller. Shamoto et al. [2] constructed a trans-fer function that describes the relationship between a film reaction force and guideway straightness errors to quantify the averaging effect of an oil film on the errors. They proposed an inverse algorithm to estimate guide-way straightness errors with motion errors. The scrap-ing error was then controlled to be within the estimated accuracy for improving motion precision. Park et al. [3]
Open Access
*Correspondence: [email protected]
estimated a film reaction force by static analysis, and a transfer function was established to estimate motion errors. In their analysis, it was found that the ampli-tude of the film force increased as the wavelength of the profile errors increased. Ekinci et al. [4, 5] studied the relationship between motion errors of the carriage and geometric errors of the guideway by a geometric error model and a static equilibrium equation. Khim et al. [6] applied a method that clarified the error averaging effect of an oil film on rolling guideways, and quantified the error averaging mechanism of rolling guideways using an error transfer model based on Hertzian contact theory. Their results showed that a ball preload and error mag-nitudes did not affect this mechanism. Hwang et al. [7] presented a method of estimating the motion and flat-ness errors of an aerostatic planar XY-stage. Shaw et al. [8–10] established a finite element model of contact on a linear rolling guide, to predict the contact stiffness between a slider and the guide. Then, the contact angle and normal deformation between linear rolling guide and ball were obtained according to the Hertz contact theory. Ohta et al. [11] established an elastic deforma-tion model of the rolling guideway, considering the elas-tic deformation of the guideway and carriage. Tao et al. [12] established a contact stiffness calculation model between ball and raceway based on the Palmgren formula and rigid body dynamics, and analyzed the relationship between the contact force between ball and raceway and the ball deformation. Xue et al. [13] analyzed a hydro-static guideway with four pads, and calculated motion errors and averaging coefficients corresponding to differ-ent straightness error compondiffer-ents, based on an analysis of average film thickness. Their research showed that the wavelength of each straightness error component, the length of the pad, and the distance (used to assess motion straightness) were the main factors in the error averag-ing effect. Zha et al. [14] considered the error averaging effect of pressured oil film, and investigated the effect of working position on vertical motion straightness in open hydrostatic guideways. Jeong et al. [15] established eight spring-equivalent models to connect moving parts and guideways, and used a finite element method to analyze the dynamic and static characteristics of the guideway system. Fan [16] proposed a mathematical model to esti-mate the wear of the guide rail by solving for the contact force between the slider and the guide rail, and then pre-dicting the geometric error of the worktable caused by wear after operating the guide rail for a long time. Al-Bender et al. [17] studied the interaction between a fric-tion force and normal load in the pre-sliding zone of a contact surface of a rolling linear guide pair, established a calculation model of tangential force in the pre-sliding zone of the contact surface, and obtained the traction
force by a numerical method. Yuki et al. [18] proposed a new method for measurement of the roll error motion of a slide table in a precision linear slide. The proposed method utilizes a pair of clinometers in the production process of the precision linear slide, and the roll error motion measurement is carried out repeatedly, to con-firm whether the surface form errors of the slide guide-ways in the linear slide are sufficiently corrected by a hand scraping process.
The scholars mentioned above only established map-ping models between two-degree-of-freedom (2-DOF) motion errors and guideway straightness errors. Khim et al. [19] established equilibrium conditions for the forces and moments in the Y- and Z-directions by using geometrical relationships to describe the system. In addi-tion, a mixed sequential two-probe method was used to measure the straightness errors of each guideway, and 5-DOF motion errors were estimated from the measured errors using a transfer function. Ekinci et al. [20] consid-ered the effects of stiffness on the error averaging effect of aerostatic guideways in the modeling process. Hu et al. [21] and Ni et al. [22] established an error model of paral-lel machine tools by considering the influences of slider linear motion error and rotational axes geometric error.
a Monte Carlo simulation method to study a 6-universal joints-prismatic pairs-spherical joints (6-UPS) parallel mechanism. The influences of the support length error and bearing clearance on the position and posture error of the moving platform of the mechanism were selected from among 42 error sources. Ni et al. [29] established the error model of a 3-DOF parallel spindle head. Jia et al. [30] proposed a pre-compensation method for tory error, to reduce a continuous-path running trajec-tory error without sacrificing machining efficiency. Zhao et al. [31] proposed a new four-sensor method with an improved measurement system to separate the straight-ness and tilt errors of a linear slideway from the sensor outputs on-machine, considering the influences of the reference surface profile and zero-adjustment values.
In summary, scholars have undertaken much research into kinematic error estimation and error averaging effects for hydrostatic guideways, but little for rolling guideways. For a rolling guide pair, the error averaging mechanism has not been quantified. The specific averag-ing coefficient and the factors affectaverag-ing it have not been determined. Therefore, this study establishes an error transfer function and an error mapping model for the rolling guide pair of a four-axis horizontal machining center based on Hertzian contact theory, to quantify the error averaging mechanism. The model provides quanti-tative guidance for tolerance distribution and assembly errors.
Section 2 establishes a transfer function of error and force based on Hertzian contact theory, and quantifies the error averaging effect of a rolling guide pair. Further-more, a mapping model between guideway straightness errors and kinematic errors is described. Section 3 ana-lyzes the influences of the error pattern and the guide-way parameter effects on the averaging effect. Section 4 experimentally verifies the error averaging mechanism of the rolling guide pair.
2 Mapping Model between Guideway Straightness Errors and Kinematic Errors
2.1 Analyzed Object
The object of the modeling is the Z-axis of a precision horizontal machining center. The bolted joint between the guideway and its mounting surface is fixed, the joint between the guideway and carriage connected by the rolling elements is movable, and the bolted joint between the carriage and table is fixed. Each joint will produce error averaging in the machine assembly process, causing the kinematic errors of the moving part to be less than the base plane errors (Figure 1).
Here, the guideway straightness errors refer to the errors obtained by coupling guideway manufactur-ing errors and mountmanufactur-ing surface errors. In addition, it
is assumed that the assembly (consisting of a table and four carriages) is ideal, that is, the effect of the bolted connection can be ignored.
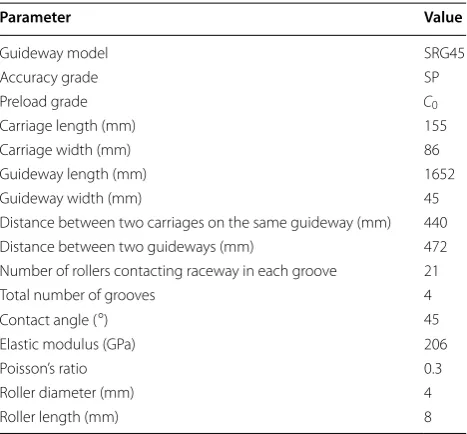
The parameters of the rolling guideway are shown in Table 1. The following analysis is based on this object.
2.2 Error Transfer Function of A Single Carriage
The guideway straightness errors cause the bearing force of the carriage to fluctuate, so the carriage has to deviate from the ideal trajectory to maintain the equi-librium state. That results in kinematic errors. The bearing force can be calculated by way of the Hertzian contact theory. During the analysis, several assump-tions are made:
• The guideway errors are sinusoidal. • Only the guideway has straightness errors. • The rollers are elastic.
Figure 1 Joints and parts of the Z-axis
Table 1 Attribute parameters of rolling guideway
Parameter Value
Guideway model SRG45
Accuracy grade SP
Preload grade C0
Carriage length (mm) 155
Carriage width (mm) 86
Guideway length (mm) 1652
Guideway width (mm) 45
Distance between two carriages on the same guideway (mm) 440 Distance between two guideways (mm) 472 Number of rollers contacting raceway in each groove 21
Total number of grooves 4
Contact angle ( ◦) 45
Elastic modulus (GPa) 206
Poisson’s ratio 0.3
Roller diameter (mm) 4
The geometric model of guideway straightness errors and elastic deformations of rollers is shown in Fig-ure 2. Ar and Ar′ are the initial and actual contact points between the roller and the carriage, respectively, Ab and Ab′ are initial and actual contact points between the roller and the guideway, respectively β0 and β′ are the ideal and actual contact angles, respectively, i and j represent the quadrant of a raceway, and k denotes the number of roll-ers in a single groove.
Figure 2 shows the straightness error eij(z) in four directions. If these errors are symmetrical, there will be no kinematic errors, because the changes in the bearing force will be balanced. Therefore, symmetry errors can be ignored.
ey(z) and ex(z) represent the mean of the straightness errors of four raceway surfaces in the y- and x-directions, respectively. Assuming that the straightness error in four directions of the raceway is equal to the mean:
As it contacts two raceway surfaces at the same time, the roller will generate a bilateral contact deformation upon application of the contact forces. To simplify the (1)
ey(z)=e11(z)|y=e12(z)|y=e21(z)|y=e22(z)|y,
(2) ex(z)=e11(z)|x=e12(z)|x=e21(z)|x=e22(z)|x.
operation, the bilateral deformation is converted into a unilateral deformation. Thus, assuming that the contact point Ab is fixed, then the elastic deformation of the roller is (Figure 2(b)):
where g is the interference size of the roller; lr is the initial distance between Ab and Ar, and Da is the roller diameter not containing the interference.
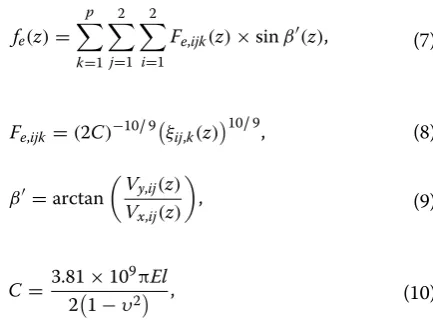
Based on Hertzian contact theory, the carriage bearing force fe(z) produced by the guideway straightness errors in the z-direction can be expressed as
where C is the attribute parameter of the roller, l is the roller length, and E and υ are the elastic modulus and Poisson’s ratio of the guideway and the carriage, respectively.
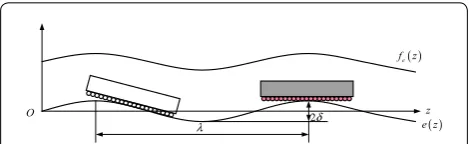
The bearing force at different guideway error frequen-cies can be calculated according to Eq. (7). Figure 3 shows that the pattern of the carriage bearing forces is a sinu-soidal function with the same wavelength and the same (or opposite) phase as the rolling guideway straightness errors; when the guideway has a straightness error in a sinusoidal form, the bearing force will have the same shape (Figure 4).
To analyze the error averaging mechanism of the roll-ing guide pair, a transfer function is introduced, and it is defined as the ratio of the carriage bearing forces fe(z) to the guideway straightness errors e(z) at different wavelength ratios. As the wavelengths of both are the same and their phase difference is 0 or π, the ratio fe(z)/e(z) is constant. Based on this feature, the independent variable is changed (3)
ξij,k(z)=
Vy,ij(z)2+Vx,ij(z)2
cos(β0−β
′
) −
lr−g,
(4)
lr =Da,
(5) Vy,ij(z)=lrcosβ0+(−1)jey,k(z),
(6)
Vx,ij(z)=lrsinβ0+(−1)iex,k(z),
(7)
fe(z)=
p
k=1 2
j=1 2
i=1
Fe,ijk(z)×sinβ′(z),
(8) Fe,ijk =(2C)−10/9ξij,k(z)
10/9 ,
(9)
β′=arctan
Vy,ij(z)
Vx,ij(z)
,
(10)
C=
3.81×10⁹πEl
2
1−υ2 ,
y
x z
( ) 21 e z
( ) 22 e z
( ) 11 e z
( ) 12 e z
1, 2
i= j=
1, 1
i= j=
2, 2
i= j=
2, 1
i= j= '
b
A '
r
A ' β
,
e ijk
F
a
Sketch of section of a carriage under forceb
Geometric relationship between form errors of guideway and roller deformationsto ω to quantify the effect of the wavelength on kinematic errors, and thus, the transfer function is expressed as the ratio of the amplitude of the bearing forces to that of the guideway errors at different frequencies:
Eq. (11) describes the averaging effect of the rollers on the raceway errors at different frequencies.
(11)
K(ω)= fe
(ω) e(ω)
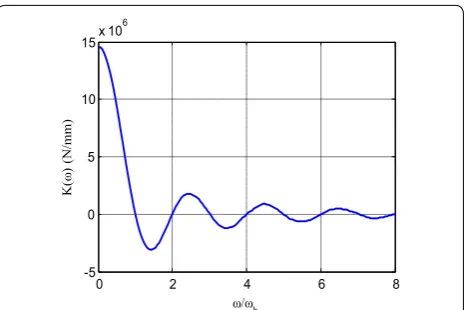
Figure 5 shows the characteristics of the transfer function. ωb is the frequency of the waveform whose wavelength equals the bearing length of the carriage lb, that is, ωb= 2π/lb, and it is used as the fundamen-tal frequency to normalize ω. The horizontal axis also represents the guideway error wavelength to the car-riage length ratio lb/λ. In a certain frequency range, the transfer function decreases gradually towards zero with increasing guideway error frequency (Figure 5). The reason is that the elastic deformation of the rollers caused by the troughs can compensate for the deforma-tion caused by crests. The shorter the guideway error wavelength λ, the more crests and troughs are con-tained in a carriage, the smaller the difference of the roller deformation, and the smaller the carriage bearing force fluctuations. Therefore, the transfer function will decrease.
Figure 6 shows why the transfer function tends to zero (ω/ωb= 1, 2, 3, …), and why its symbol is negative:
0 20 40 60 80 100 120 -4
-2 0 2 4 6 8 10 12
x 10-3
Positionz /mm
sr
orr
es
se
nth
gia
rts
ya
we
diu
G
e
(
z
m
m/) ω/ωb=1.5
ω/ωb=2 ω/ωb=2.5
a
Rolling guideway straightness errors0 20 40 60 80 100 120 -2
-1 0 1 2 3 4x 10
4
Positionz /mm
sec
rof
gni
rae
b
eg
air
ra
C
fe
(
z
N/)
ω/ωb=1.5 ω/ωb=2 ω/ωb=2.5
b
Carriage bearing forcesFigure 3 Phase relationship between the rolling guideway straightness errors and the carriage bearing forces
z
( )
e f z
( )
e z O
λ 2δ
Figure 4 Bearing force caused by the sinusoidal straightness error in the rolling guideway
0 10 20 30 40
-2 -1.5 -1 -0.5 0 0.5 1 1.5
2x 10 7
ω/ωb
)
m
m/
N()
ω(
K (1.5,-3093000)
(2,0)(2.5,1765000)
Figure 5 Characteristics of the transfer function
/ b 1.5 ω ω =
/ b 2
ω ω =
/ b 2.5 ω ω =
0
φ= φ π=
• For ω/ωb= 1.5, the overall deformation of rolling ele-ments is downwards when φ= 0, and upwards when φ=π. As the deformation varies from negative to positive, the bearing force of the carriage varies from positive to negative. Thus, their phases are opposite, and the transfer function is negative.
• For ω/ωb= 2, the overall deformation of the rollers is very small, resulting in small bearing forces. There-fore, the transfer function approaches zero, and the carriage length is an integral multiple of the error wavelength.
• For ω/ωb= 2.5, when the overall deformation of the rollers varies from positive (φ= 0) to negative (φ= π), the bearing force of the carriage changes from posi-tive to negaposi-tive, so their phases are the same, and the transfer function is positive.
Figure 7 shows why the transfer function reaches a maximum when ω/ωb=lb/λ= 0, 21, 42,…. As lb= 21τDa (i.e., 21 is the number of rollers contained in a single groove, and τDa is the distance between two adjacent roller centers), the distance, τDa, is an integral multiple of the guideway error wavelength λ when ω/ωb=lb/λ= 0, 21, 42,…. This means that all rollers are located at the peaks, and produce large, equal contact forces, which cannot be offset. Consequently, the error averaging effect is not evident.
In fact, the high-frequency component of the guideway errors is often overlooked, as the guideway is very close to its mounting surface, and so the next analyses ignore frequencies greater than 8ωb (Figure 8).
2.3 Error Transfer Function of Four Carriages
Figure 9 shows a static balance model of the system. The elastic deformation of the table is ignored. The static stiff-ness and geometric size of the four carriages are assumed to be the same. These carriages will pass through the same position one-by-one. Therefore, if the relationship between the bearing force of a single carriage and the guideway errors is known, the kinematic errors of the table will be obtained, based on the geometric relation-ship between the carriages.
The system maintains the force balance under the influ-ence of the guideway straightness error. This error is expanded to a Fourier series with the period equal to the guideway length L:
where au and bu are the Fourier coefficients. Then, the bearing force of each carriage is obtained in terms of the transfer function:
The positioning accuracy of the machine tool is mainly determined by the drive and control units, but the other five kinematic errors of the machine tool (including
(12) e(z)=
∞
u=1
aucos
2uπ
L (z)+busin 2uπ
L (z)
,
(13) feik(z)=fe(z+Zk)
= ∞
u=1 K
2uπ
L
aucos 2uπ
L (z+Zk)+busin
2uπ
L (z+Zk)
.
/ b 21
ω ω =
b
a D τ
Figure 7 Relationship between the number of rollers and the guideway error with ω/ωb=21
0 2 4 6 8
-5 0 5 10 15x 10
6
ω/ωb
)
m
m/
N(
)
ω(
K
Figure 8 Relationship between the wavelength and error averaging effect of a single carriage
horizontal straightness error, vertical straightness error, roll error, pitch error, and yaw error) are mainly determined by the guideway straightness errors. The equations describing the force and moment balance are as follows:
where fx,jk(z) and fy,jk(z) are the resultant forces of the car-riage in the x- and y-directions, respectively; fex,jk(z) and fey,jk(z) are the contact forces on the carriage in the x-and y-directions, respectively; Kx(0) and Ky(0) are the static stiffness of the carriage in the x- and y-directions, respec-tively; m is the number of carriages; and Xi, Yc, and Zk are the distances between the centers of the carriage and the table in the x-, y-, and z-directions, respectively. Xi and Zk are determined as follows:
where lx and lz are the distances between the carriage centers in the x- and z-directions, respectively.
δx(z) and δy(z) represent table straightness errors in the x- and y-directions, respectively, and εx(z), εy(z), and εz(z) are the roll, pitch, and yaw errors, respectively. Then, xik(z) and yik(z), the respective displacements of the carriage in (14) m i=1 m
k=1
fx,ik(z)=0,
(15)
fx,ik(z)=fex,ik(z)−Kx(0)xik(z),
(16)
m
i=1
m
k=1
fy,ik(z)=0,
(17) fy,ik(z)=fey,ik(z)−Ky(0)yik(z),
(18)
m
i=1
m
k=1
fx,ik(z)Yc+fy,ik(z)Xi=0,
(19) m i=1 m
k=1
fy,ik(z)Zk =0,
(20)
m
i=1 m
k=1
fx,ik(z)Zk =0,
(21) Xi=lx
i−
(m+1) 2
,
(22)
Zk=lz
−k+
(m+1) 2
,
the x- and y-directions caused by the guideway straightness errors, are:
Thus, the equations describing the table kinematic errors are:
The table kinematic errors (δx(z), δy(z), εx(z), εy(z), and εz(z)) can be calculated from Eq. (25), and if these errors are measured, the guideway straightness errors will also be deduced by back-substitution.
To describe the relationship between the guideway straightness errors and the table kinematic errors, Eq. (25) is transformed into a mapping model:
that is,
(23) xik(z)=δx(z)+Ziεy(z)+Ycεz(z),
(24) yik(z)=δy(z)−Ziεx(z)+Xiεz(z).
(25)
K1 0 0 0 0
0 K2 0 0 0
0 0 K3 0 K4
0 0 0 K5 0
0 0 K6 0 K7
δy(z) εx(z) εz(z) εy(z) δx(z)
=
1 0 0 0 0 0 1 0 0 0
0 0 1 0 Yc
0 0 0 1 0 0 0 0 0 1
M1 M2 M3 M4 M5 ,
K1=2mKy(0), K2=Ky(0) m
i=1
m
k=1
Zk2
K3=2mYc2Kx(0)+Ky(0) m
i=1
m
k=1
Xi2,
K4=2mYcKx(0), K5=Kx(0) m
i=1
m
k=1
Z2k,
K6=2mYcKx(0), K7=2mKx(0), M1=
m
i=1
m
k=1
fey,ik(z), M2= −
m
i=1
m
k=1
fey,ik(z)Zk,
M3=
m
i=1
m
k=1
fey,ik(z)Xi, M4=
m
i=1
m
k=1
fex,ik(z)Zk,
M5=
m
i=1
m
k=1
fex,ik(z)
(26)
or
The following conclusions are obtained according to Eq. (28).
(1) The model directly reflects the relationship between the guideway straightness errors and the table kin-ematic errors. When the guideway straightness errors are known, the table pose errors can be obtained, and vice versa.
(2) δx(z) and δy(z) are determined only by the guideway straightness errors in their respective directions. εx(z) and εz(z) are affected by the guideway straight-ness errors in the y-direction. εy(z) is influenced by the guideway straightness error in the x-direction. (3) The spans of the table have an important effect on
pose errors when the guideway straightness errors are constant. The longer that 2Zk (representing the span between two carriages on a same guideway) and 2Xi (representing the span of two guideways) are, the smaller the kinematic errors (involving εx(z), εy(z), and εz(z)) will be.
(27)
δy(z) εx(z) εz(z) εy(z) δx(z)
=
1 0 0 0 0 0 1
|Z1| 0 0 0
0 0 1
|X1| 0 0
0 0 0 1
|Z1| 0
0 0 0 0 1
∗
fey,12(z)+fey,11(z)+fey,21(z)+fey,22(z)
−fey,12(z)+fey,11(z)+fey,21(z)−fey,22(z)
4Ky(0)
fey,12(z)+fey,11(z)−fey,21(z)−fey,22(z)
Ky(0)+4Kx(0)YC
fex,12(z)+fex,11(z)−fex,21(z)−fex,22(z)
4Kx(0)
fex,12(z)+fex,11(z)+fex,21(z)+fex,22(z)
,
δy(z)
εx(z)
εz(z) εy(z)
δx(z)
=
1 0 0 0 0
0 1
|Z1| 0 0 0
0 0 1
|X1| 0 0
0 0 0 1
|Z1| 0
0 0 0 0 1
∗ (28)
Ky(w)�ey,12(z)+ey,11(z)+ey,21(z)+ey,22(z)�
Ky(w)(−ey,12(z)+ey,11(z)+ey,21(z)−ey,22(z)) 4Ky(0)
Ky(w)(ey,12(z)+ey,11(z)−ey,21(z)−ey,22(z))
Ky(0)+4Kx(0)YC
Kx(w)(ex,12(z)+ex,11(z)−ex,21(z)−ex,22(z)) 4Kx(0)
Kx(w)�ex,12(z)+ex,11(z)+ex,21(z)+ex,22(z)�
.
3 Factors Affecting Error Averaging
The guideway straightness errors are decomposed into components with different wavelengths. Assuming that the form of each error component is such that e(z) = Acos((2π/λ)z), then the table kinematic errors (δx(z), δy(z), εx(z), εy(z), and εz(z)) caused by different compo-nents are calculated by way of Eq. (28). ne is defined as the ratio of the kinematic error to the guideway error, as the averaging coefficient to characterize the error averag-ing effect of the rollaverag-ing guide pair:
Eq. (29) is used to analyze the factors affecting the table linearity error δy(ω). Analyses of other table kin-ematic errors are based on their respective averaging coefficients.
(1) Wavelength
The influence of the guideway error wavelength on the error averaging effect of the rolling guide pair is analyzed when each error component has the same amplitude and phase. Defining the wavelength ratio as the ratio of the carriage length lb to the guideway error wavelength λ, as ωb=2π/lb and ω= 2π/λ, this wavelength ratio lb/λ is equal to the ratio ω/ωb. Figure 10 shows that the guideway error wavelength
exerts a significant influence on the error averaging, but when the wavelength ratio lb/λ = 0, 21, 42, …, the averaging coefficient ne is very large (Figure 7). The distance between two adjacent roller cent-ers, τDa, is integral multiple of the guideway error wavelength λ under these wavelength ratios, and causes each roller (at peak) to generate equal forces that cannot be offset.
(29)
ne=
δy(ω)
e(ω).
0 10 20 30 40
0 0.2 0.4 0.6 0.8 1
Wavelength ratiolb/λ=ω/ωb
st nei cif fe oc gni gar ev A ne
Figure 11 shows that the error averaging effect of the rolling guide pair is large when lb/λ > 0.5. In this wavelength range, the averaging coefficients ne decrease periodically with increasing wavelength ratio lb/λ, but the averaging coefficients ne increase monotonically towards unity with decreasing wave-length ratio lb/λ when lb/λ< 0.5, and ne reaches a maximum when lb/λ is approximately 1/3. The rea-son for this is that a situation where a crest and a trough are both contained in a carriage is impossi-ble for lb∈(0, 0.5λ). The carriage bearing forces vary greatly in this wavelength range, and therefore the error averaging effect is not evident.
(2) Phase difference
The influence of the phase difference is analyzed when each error component has the same ampli-tude. The phase difference between the straight-ness errors of two guideways, φ, is set to 0, 0.5π, π, and 1.5π, respectively. As shown in Figure 12, the averaging coefficient ne is maximized at φ= 0 (Eq. (27) illustrates the reason for this). The kinematic errors are determined by the difference between the bearing force variations on the carriages when they are arranged symmetrically; the greater the differ-ence, the greater the kinematic errors. When φ= 0, the bearing force variations on the symmetrically arranged carriages are equal in size and opposite in direction, so the absolute value of the difference and the averaging coefficient ne are maximized. However, the bearing force variations on the sym-metrically arranged carriages are always equal in both size and direction when φ= 1.5π. Thus, the table kinematic error is very small and the averag-ing coefficient ne tends to zero.
(3) Amplitude
The influence of the guideway error amplitude is analyzed when each error component has the same
phase. The amplitude δ is set to 2, 5, and 10 μm, respectively. Figure 13 shows that the averaging coefficients ne are almost equal at different ampli-tudes. Therefore, the amplitude exerts little influ-ence on the error averaging effect of the rolling guide pair.
(4) Roller preload
The influence of the roller preload is analyzed when the other factors are kept constant. The preload g is set to 2, 4, and 8 μm, respectively. Figure 14 shows that the roller preload rarely influences the error averaging effect of the rolling guide pair. In fact, preloading can improve the guideway rigidity to a certain extent, but excessive preloading reduces the life of the guideway.
4 Experiment
The experimental set-up consists of a bed, two guide rails, four carriages, a table, etc. (Figure 15). To verify the error averaging effect of the rolling guide pair in the machine assembly process, the guideway mounting surface must be able to be scraped repeatedly, and the core parts must
Figure 11 Averaging coefficient curves for different wavelengths
Figure 12 Averaging coefficient curves for different phases
be able to be disassembled many times. Table 2 shows the key experimental parameters.
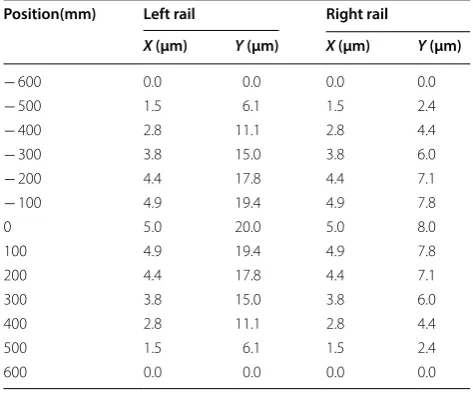
In step 1, the mounting surfaces were scraped in terms of the specific data on errors. The error pattern was arcu-ate. One guideway had large straightness errors, and the other had small straightness errors. This arcuate error function was:
where Δ was the straightness error, depending on the error pattern. The scraping data on the mounting sur-faces are listed in Table 3.
(30)
g = −�·(z/600)2+�,
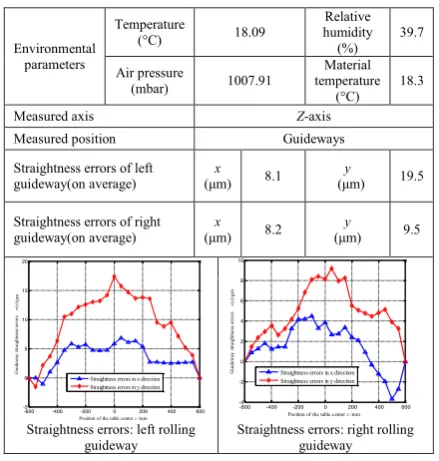
In step 2, the guideways were installed, and the bolts were tightened. Then, the errors of four raceway sur-faces of the guideway were measured with a micrometer and high-precision flat ruler (Figure 16). The measured guideway straightness errors are summarized in Table 4.
In step 3, the table was installed and the bolts were tightened, and then the straightness errors of the table were measured with a collimator (Table 5).
The error transfer relationship between core compo-nents was thus obtained for this the machine tool assem-bly process (Table 6).
Therefore, the averaging coefficients for the kinematic straightness errors in the x- and y-directions were, respectively:
Figure 14 Averaging coefficient curves for different roller preloads
Figure 15 Experimental set-up
Table 2 Experimental parameters
Parameter Value
Table (mm) 560 × 550 × 45
Guideway model SRG45R2QZZZCO+1650LSR-II Span (mm) x-direction: 474, y-direction: 443 Bed (mm) Length: 600, Width: 1800, Height: 485
Table 3 Experimental parameters
Position(mm) Left rail Right rail
X (μm) Y (μm) X (μm) Y (μm)
− 600 0.0 0.0 0.0 0.0
− 500 1.5 6.1 1.5 2.4
− 400 2.8 11.1 2.8 4.4
− 300 3.8 15.0 3.8 6.0
− 200 4.4 17.8 4.4 7.1
− 100 4.9 19.4 4.9 7.8
0 5.0 20.0 5.0 8.0
100 4.9 19.4 4.9 7.8
200 4.4 17.8 4.4 7.1
300 3.8 15.0 3.8 6.0
400 2.8 11.1 2.8 4.4
500 1.5 6.1 1.5 2.4
600 0.0 0.0 0.0 0.0
It was found that the kinematic straightness errors in the x- and y-directions were approximately 1/3 to 1/2 of the guideway straightness errors in the corresponding directions. Accordingly, the error averaging effect of the rolling guide pair in the machine assembly process was verified.
5 Conclusions
(1) The transfer function for a single carriage, estab-lished by this research, quantified the averaging effect of the rolling guide pair. The averaging mech-anism is such that the carriage bearing forces pro-duced by the guideway errors are repro-duced owing to roller elastic deformation, which absorbs some guideway error.
(2) A mapping model between guideway straightness errors and table kinematic errors is developed to predict the kinematic accuracy from known guide-way errors. The algorithm is also proposed to obtain (by inversion and back-substitution) the guideway scraping precision from the measured kinematic errors.
(3) The wavelength of the guideway errors and the phase difference exert a significant influence on the error averaging effect of the rolling guide pair, but the amplitude and the roller preload are insignifi-cant in this regard. For the rolling guide pair ana-lyzed here, the averaging coefficient ne is maximized at λ= (10/3)lb. In addition, the averaging coefficient
ne is maximized when the phase difference φ= 0 for the same error component. However, ne tends to zero when φ= 1.5π.
(31)
nex=4.2/((8.1+8.2)/2)=0.52,
(32)
ney=4.8/((19.5+9.5)/2)=0.33.
Table 4 Straightness errors of the left and the right rolling guideways
Environmental parameters
Temperature
(°C) 18.09
Relative humidity
(%) 39.7
Air pressure
(mbar) 1007.91
Material temperature
(°C) 18.3
Measured axis Z-axis
Measured position Guideways
Straightness errors of left
guideway(on average) (μm)x 8.1 (μm)y 19.5
Straightness errors of right
guideway(on average) (μm)x 8.2 (μm)y 9.5
-600 -400 -200 0 200 400 600 -5
0 5 10 15 20
Position of the table center z /mm
Gu
id
eway
st
ra
ightne
ss
erro
rs
e
(z
)/
µ
m
Straightness errors in x direction Straightness errors in y direction
-600 -400 -200 0 200 400 600 -4
-2 0 2 4 6 8 10
Position of the table center z /mm
Gu
id
eway
st
ra
ightne
ss
er
ro
rs
e
(
z
)/
µ
m
Straightness errors in x direction Straightness errors in y direction
Straightness errors: left rolling
guideway Straightness errors: right rolling guideway
Table 5 Straightness errors of the table
Environmental parameters
Temperature
(°C) 18.00
Relative humidity
(%) 39.71 Air pressure
(mbar) 1007.28
Material temperature
(°C) 17.82
Measured axis Z-axis
Measured position Table
Straightness errors
(on average) (μm)x 4.2 (μm)y 4.8
-600 -400 -200 0 200 400 600 -1
0 1 2 3 4 5
Position of the table center z /mm
Ta
bl
e
stra
ightne
ss
er
ro
rs
e
(
z
)/µ
m
Straightness errors in x direction Straightness errors in y direction
Straightness error detection Straightness errors of the table
Table 6 Error transfer values for each mounting surface from bottom to top
Straightness errors (μm) x y Straightness errors (μm) x y
Left rail mounting surface 5.9 20.8 Right rail mounting surface 5.7 8.3
Left rail 12.0 12.0 Right rail 12.0 12.0
Left rail after installation 8.1 19.5 Right rail after installation 8.2 9.5
Authors’ contributions
YN was in charge of the whole trial; HZ established the error mapping model and analysed the influence of different guideway error parameters on the error averaging effect; CS designed and completed the experiment. JL assisted with experimental and data analysis. All authors read and approved the final manuscript.
Authors’ information
Yanbing Ni, born in 1964, is currently a professor at Key Laboratory of Mecha-nism Theory and Equipment Design of Ministry of Education, Tianjin University, China. His research interests include mechatronics engineering and robotics.
Haiyang Zhou, born in 1993, is currently a master candidate at Key Labora-tory of Mechanism Theory and Equipment Design of Ministry of Education, Tianjin University, China.
Cuiyan Shao, born in 1991, is currently a master candidate at Key Labora-tory of Mechanism Theory and Equipment Design of Ministry of Education, Tianjin University, China.
Jinhe Li, born in 1962, is currently an engineer at Key Laboratory of Mecha-nism Theory and Equipment Design of Ministry of Education, Tianjin University, China.
Acknowledgements
The authors sincerely thanks to Professor Zhang of Tianjin University for his critical discussion and reading during manuscript preparation.
Competing interests
The authors declare that they have no competing interests.
Funding
Supported by National Science and Technology Major Project of China (Grant No. 2015ZX04005001), and Tianjin Provincial Nature Science Foundation of China (Grant No. 16JCZDJC38400).
Received: 21 June 2018 Revised: 21 June 2018 Accepted: 8 August 2019
References
[1] D R Gao, D Zheng, Z C Zhang. Theoretical analysis and numerical simula-tion of the static and dynamic characteristics of hydrostatic guides based on processive Mengen flow controller. Chinese Journal of Mechanical Engineering, 2010, 23(6): 709–716.
[2] E Shamoto, C H Park, T Moriwaki. Analysis and improvement of motion accuracy of hydrostatic feed table. CIRP Annals-Manufacturing Technology, 2001, 50(1): 285–290.
[3] C H Park, Y J Oh, C H Lee, et al. Theoretical verification on the motion error analysis method of hydrostatic bearing tables using a transfer function.
International Journal of Precision Engineering and Manufacturing, 2003, 4(2): 64–70.
[4] T O Ekinci, J R R Mayer. Relationships between straightness and angular kinematic errors in machines. International Journal of Machine Tools & Manufacture, 2007, 47(12–13): 1997–2004.
[5] T O Ekinci, J R R Mayer, G M Cloutier. Investigation of accuracy of aero-static guideways. International Journal of Machine Tools & Manufacture, 2009, 49(6): 478–487.
[6] G Khim, C H Park, E Shamoto, et al. Prediction and compensation of motion accuracy in a linear motion bearing table. International Journal of Precision Engineering and Manufacturing, 2011, 35(3): 393–399.
[7] J Hwang, C H Park, S W Kim. Estimation method for errors of an aerostatic planar XY stage based on measured profiles errors. The International Journal of Advanced Manufacturing Technology, 2010, 46: 877–883. [8] D Shaw, W I Su. Study of stiffness of a linear guideway by FEA and
experi-ment. Structural Longevity, 2011, 5(3): 129–138.
[9] D Shaw, W L Su. Theoretical study of contact angles of a linear guideway.
Structural Longevity, 2011, 5(3):139–145.
[10] D Shaw, W L Su. Stiffness analysis of linear guideways without preload.
Journal of Mechanics, 2013, 29(2): 1–6.
[11] H Ohta, K Tanaka. Vertical stiffness of preloaded linear guideway type ball bearing incorporating the flexibility of the carriage and rail. Journal of Tribology-Transactions of the ASME, 2010, 132(1): 1–9.
[12] W J Tao, Y Zhong, H T Feng, et al. Model for wear prediction of roller linear guides. Wear, 2013, 305(1–2): 260–266.
[13] F Xue, W H Zhao, Y L Chen, et al. Research on error averaging effect of hydrostatic guideways. International Journal of Precision Engineering and Manufacturing, 2012, 36(1): 84–90.
[14] J Zha, Z W Wang, F Xue, et al. Effect of working position on vertical motion straightness of open hydrostatic guideways in grinding machine.
Chinese Journal of Mechanical Engineering, 2017, 30(1): 46–52. [15] J Jeong, E Kang. Equivalent stiffness modeling of linear motion
guide-ways for stage systems. International Journal of Precision Engineering and Manufacturing, 2014, 15(9): 1987–1993.
[16] K C Fan, H M Chen, T H Kuo. Prediction of machining accuracy degrada-tion of machine tools. Precision Engineering, 2012, 36(2): 288–298. [17] F Al-Bender, M K De. On the relationship between normal load and
friction force in pre-sliding frictional contacts. Part 1: Theoretical analysis.
Wear, 2010, 269 (3–4): 174–182.
[18] S Yuki, K Satoshi, et al. High resolution clinometers for measurement of roll error motion of a precision linear slide. Chinese Journal of Mechanical Engineering, 2018, 31: 92, https ://doi.org/10.1186/s1003 3-018-0294-6. [19] G Khim, J S Oh, C H Park. Analysis of 5-dof motion errors influenced by
the guide rails of an aerostatic linear motion stage. International Journal of Precision Engineering and Manufacturing, 2014, 15(2): 283–290. [20] T O Ekinci, J R R Mayer, G M Cloutier. Investigation of accuracy of
aero-static guideways. International Journal of Machine Tools & Manufacture, 2009, 49: 478–487.
[21] P H Hu, J K Zhang, X Q Ma, et al. Analysis of slider motion error on 3-PUU parallel coordinate measuring maching. Chinese Journal of Mechanical Engineering, 2015, 51(18): 1–6. (in Chinese)
[22] Y B Ni, X C Liu, et al. Geometric error measurement and identification for rotational axes of a five-axis CNC machine tool. Strojniski Vestnik-Journal of Mechanical Engineering, 2018, 64(5): 290–302.
[23] D Jastrzebski, P Pawełko, G Szwengier. Modeling the effect of geometric errors on the static characteristic of guide rail systems. Advances in Manu-facturing Science and Technology, 2010, 34(4): 23–33.
[24] P Majda. Modelling of geometric errors of linear guideway and their influence on joint kinematic error in machine tools. Precision Engineering, 2011, 36: 369–378.
[25] P Majda. Relation between kinematic straightness errors and angular errors of machine tool. Advances in Manufacturing Science and Technology, 2012, 36(1): 47–53.
[26] P Majda, Szwengier G, Jastrzebski R. New approach to modeling geomet-ric errors in precision manufacturing machines. Advances in Manufactur-ing Science and Technology, 2013, 37(3): 33–44.
[27] P Pawełko, S Berczyński, Z Grządziel. Modeling roller guides with preload.
Archives of Civil and Mechanical Engineering, 2014, 14: 691–699.
[28] X L Cui, W Li. Error analysis of 6-UPS parallel mechanisms based on Monte Carlo simulation. Machinery Design & Manufacture, 2016(6): 89–92. [29] Y B Ni, B Zhang, Y Sun, et al. Accuracy analysis and design of A3 parallel
spindle head. Chinese Journal of Mechanical Engineering, 2016, 29(2): 239–249.
[30] Z Y Jia, D N Song, et al. Pre-compensation for continuous-path running trajectory error in high-speed machining of parts with varied curvature features. Chinese Journal of Mechanical Engineering, 2017, 30(1): 37–45. [31] L Zhao, K Cheng, H Ding, et al. On-Machine measurement of the
straight-ness and tilt errors of a linear slideway using a new four-sensor method.