R E S E A R C H
Open Access
Music selection interface for car audio system
using SOM with personal distance function
Ning-Han Liu
Abstract
Devices such as smart phones and tablet PCs of various sizes have become increasingly popular, finding new applications, including in-car audio systems. This paper proposes a new car audio system. In the architecture, music data is stored in an online database, which users are then able to select a genre of music or a playlist from through a 2D interface. Self-organizing map, depending on a personalized distance function and music contents, is utilized to map music tracks to the interface. With this data model and interface, drivers can easily select the type of music they want to listen to without interfering with their driving. Artificial neural networks record and analyze user preference, allowing the system to select and order the music tracks to be played automatically. Experiments have shown that the system satisfies user requirements.
Keywords:Car audio system; Music database; Self-organizing map; User interface
1. Introduction
New vehicle telecommunication systems are constantly being developed. The problem of combining multimedia player technology with in-car systems has recently attracted significant attention. Among car-based multi-media systems, personal music and radio are less distracting for drivers and are thus the oldest and most popular types of in-car entertainment. The wide avail-ability of third generation (3G) mobile networks has also enhanced car audio systems. A new type of Internet radio for vehicles has recently been released. It offers advanced radio functionalities including: AM/FM radio, CD, and MP3 playback, along with Internet radio. In the not-too-distant future, it is predicted that music will be stored in the cloud [1], in contrast to how it is currently stored locally, and will be accessed over wireless net-works. However, this creates a new problem. The driver's primary focus needs to be on driving. If the driver spends too much time and attention on selecting music, there is an increased risk of accidents. Therefore, design-ing a new user interface to facilitate the selection of music from large databases is an important research topic.
The original method to select a track on a car audio system is achieved using the ‘Next,’ ‘Previous,’ and ‘Random’ buttons. Newer music players often have a touch screen to let users look through albums or folders and find the desired songs. The former method is time-consuming, and the latter involves a number of interac-tions, distracting the driver and creating a safety issue, especially when the number of tracks is large. In this paper, a novel music selection interface is proposed, which utilizes the self-organizing map (SOM) to map tracks to one or two discrete grids. Users only need to press the appropriate spot on a touch screen corresponding to a particular type of music or slide their finger on a curve to create a playlist. A content-based method is adopted that uses musical content as the basis for the SOM clustering. Since each individual perceives the variation between cer-tain music tracks differently, a dynamically adjustable measure is proposed. From here on the variation in music tracks perceived by the user is referred to as a distance function. The proposed method can calculate the users' implicit distance functions based on the ratings they give for the distances between music tracks. The distance func-tion is then used to quantify the music similarity and is needed for the music clustering process. The superior clustering capability provided by the SOM is used to cre-ate a personalized index and interface for each user. In addition, an artificial intelligence technique is adopted to Correspondence:[email protected]
Department of Management Information Systems, National Pingtung University of Science and Technology, 1, Shuefu Road, Neipu, Pingtung 912, Taiwan
select tracks automatically to recommend to users. This car audio system and interface is implemented in experi-ments, to test the influence of the personalized distance function on the clustering performance, and the tracks re-trieved. The clustering method and interface design are suitable for the next generation of car audio systems according to the experimental results.
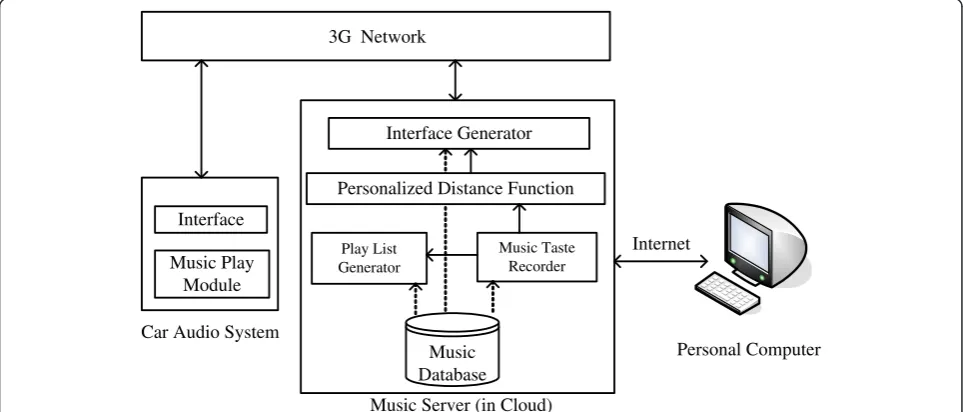
The proposed car audio system is illustrated in Figure 1. All music data are stored in the music ser-ver. The system first utilizes the Internet to estimate the user's perception of ‘music distance’, which will then be used to generate a personalized distance function. The SOM clustering method is applied, with this distance function, to generate a personal-ized interface that is transferred to the in-car system through a 3G connection. The user will select the type of songs to play on the car system. This choice is sent to the playlist generator on the server side, which finds appropriate songs to transmit to the car.
The rest of this paper is organized as follows: Section 2 discusses related work. Section 3 discusses feature extraction from the music content and the method used to generate the distance function. Section 4 describes the design of the music clustering method and the user interface. Experimental results are presented and discussed in Section 5, while Section 6 concludes the work.
2. Related works
As more and more electronic devices are installed in modern vehicles, the I/O systems become increasingly important. The use of car navigation systems is an example of this. In Kern et al. [2], it was found that
input and output device controls should be in the mid-dle of the steering wheel for safety and suggested that multi-touch screens be used. However, it is not clear how the content of the screen was to be kept horizontal. Although a round screen that adjusts content along with the rotation of the steering wheel can be used [3], the cost is too high to commercialize and also prevents the installation of airbags. A study of car audio system inter-faces [4] proposed mapping the control commands to a similar system as the fingerings of chords. The buttons on the steering wheel when pressed in certain patterns could then implement complex controls. In Schnitzer et al. [5], the design of a music player interface using the travelling salesman problem algorithm to sort tracks from most similar to least similar, circling round to more similar again, was demonstrated. In this way, tracks are arranged in an optimal and non-repetitive circular order, forming the interface. In Prescher et al. [6], a method was proposed to cleanly partition the touch-screen area. The interface needs to be convenient and easy to use and the touch-screen area should display information clearly. In Alonso et al. [7], the complexity of touch-screen interfaces was discussed, where it was suggested that it is better to use fewer steps for
inter-action. Rauber et al. [8] used ‘islands of music’ to
visualize music based on a distribution of features. However, they did not address the problem of playlist generation.
The SOM, which was first proposed by Kohonen, is one of the best known unsupervised artificial neural network models [9,10]. The SOM is a competitive learn-ing algorithm, which looks for similar patterns, features, and relations among samples. The SOM can be used for
Interface
Music Play Module
Car Audio System
Interface Generator
Personalized Distance Function
Music Server (in Cloud)
Play List Generator
Music Taste Recorder
3G Network
Personal Computer Internet
Music Database
data classification or clustering. After clustering using the SOM algorithm, an arbitrary dimensional input vector can be mapped to a lower discrete grid (usually one- or two-dimensional (2D)). The SOM retains most of the distance relations which were present in the original data in this lower discrete grid. There is a large body of research on the SOM. Some studies focus on improved algorithms for faster convergence, such as the fast SOM method proposed by Su and Chang [11], who added thek-means algorithm to obtain an initial cluster-ing, which was used to speed up the convergence of the SOM learning. In Su et al. [12], it was proposed to use grid partitions to replace k-means. A hierarch-ical self-organizing map (HSOM) [13] uses a multi-layer architecture that splits the original single multi-layer neuron network into multiple layers. After the upper layer, parent neurons are trained, their child neurons are trained, etc. Due to the superior clustering per-formance of the SOM on high-dimensional data, it has been employed for music data clustering, recommen-dation, and querying. The SOM-enhanced JukeBox, pro-posed by Rauber et al. [8] automatically creates an organization of music archives based on audio similarity. In Dickerson [14], the SOM was used to describe the properties of music and created a query-by-content sys-tem that operates independent of the user's query style.
Concurrent recommendation systems can be catego-rized into content-based filtering (CBF) recommenda-tion, collaborative filtering (CF) recommendarecommenda-tion, and hybrid recommendation, based on the underlying algo-rithm. Research has focused on implementing effective music management and categorization using features such as metadata. Others proposed content-based me-thods [15,16] generate recommendations by identifying preferred content features and extracting items similar to previous choices. Lyric feature analysis [17] is used to find similar items, focusing on lyrics that describe race conflicts and social issues. The authors proposed a con-tent that features analysis-based customer playlists, generated according to user profile and feedback infor-mation [18]. The CF mechanism uses rating and user profile information to identify users with similar inter-ests. Users with common interests recommend items to each other. The CF mechanism is a widely applied rec-ommendation technology [15,19] where user preferences are obtained from visitor records or browsing behavior. Although the CF mechanism is widely used, it has many unsolved problems, such as the cold-start problem and sparse information, which affect performance during sys-tem initialization. Several researchers have proposed recommendation methods that combine both CBF and CF approaches to build a recommendation system. The hybrid approach is able to partially solve some of the problems associated with recommendation loss. For
example, collaborative user groups are constructed based on tagged labels [16,20]. Users who have tagged the same label are included into the same group. The initial grouping can reduce calculation time. Further analysis is based on music content and is aimed at providing mutual recommendations.
For playlist generation, a popular method allows the user to specify some tracks as seeds. The algorithms then find similar music and make a list [21]. A similar example [22] creates playlists with an inherent sequen-tial order to have a smooth transition between the start and end of each song. Another approach to playlist generation populates the playlist according to a set of user-specified constraints about the desired content [23]. A third method generates a playlist according to user preferences and situations [24]. The system pro-duces a playlist for users in similar situations using content-based retrieval on the playlists. These three methods rely on examining metadata attached to music tracks. Another method uses the listening his-tory of the user and generates a listener model for the user's preferences. For instance, the system proposed by Andric and Haus [25] records the frequency of two music tracks being played together to find the relevance between them. A vector space is constructed where each vector represents a track. The vectors are then grouped such that each grouping of the tracks indi-cates different listening situations. The music playlist is then generated according to the situation indicated by the user. Another method to generate a playlist was proposed based on users' interests and time parameters, utilizing personalized neural networks in Liu and Hsieh [26].
3. Music features and personalized distance function
The results of music clustering are often affected by the distances between them. In this paper, we design a mechanism to build a personalized distance function for each user. Simple surveys are used to record user per-ceptions of the distances between songs in order to achieve personalization. The personalized distance func-tion forms the basis for generating the personalized interface.
3.1. Extracted features
which can accurately record pitch and tone. Only the MIDI data for the main melody of the track are used, which are usually monophonic. The following features are extracted from the main melody [30]:
1. Average pitch indicates whether the piece of music is of high or low pitch.
2. Pitch entropy indicates the degree of variation in the piece of music.
3. Pitch density represents the number of different pitches that occur in the piece of music.
4. Average duration describes the rhythm of the piece of music, for example fast or slow.
5. Duration entropy indicates the degree of variation in rhythms present in the piece of music. The pitch interval represents the difference between consecutive pitches. It is commonly used in key-invariant music query systems, which are not based on pitch. Extracting features from a pitch interval string is useful since two melodies with the same pitch contour may be considered identical even when they have different pitch scales.
6. Pitch interval entropy represents the degree of vari-ation in the piece of music under key-invariant condi-tions. Refrains in pop music are common. They often form the basis by which people decide if they like a music track. Therefore, the same set of features is extracted from refrains. In total, 12 features are utilized from MIDI files. For audio files, the features are extracted from the frequency domain, which include formants and Mel-frequency cepstral coefficients (MFCCs). As pop music is the most common, the tone color (or timbre) of the singer's vocals is a possible feature in determining whether the user accepts the recom-mendations. The vocal sections are manually identi-fied (usually in the refrain) for formants.
7. MFCC is the best-known feature in the area of speech and speaker recognition, based on human per-ception sensitivity in terms of audio frequencies. In this system, the input signal of the entire track is segmented into 20 ms frames with an optional overlap of 1/2 the frame size. Only the first five bins of MFCCs are extracted; this avoids high-dimensional data. The aver-age and the standard deviation of each bin are calculated as features.
8. Formant. Vocals are usually evaluated based on for-mants. Formants are the frequencies that have higher energy or amplitude in the spectrum. For example, the formant of a female voice is typically higher than a male voice. To limit the number of features, only the first (F1), the second (F2), and the third (F3) formants are used because they are more useful for distinguishing be-tween different sound sources. The mean and standard
deviation of F1, F2, and F3 within a window are calcu-lated for use as the features of the specific vocalist.
A total of 16 features are extracted from the audio file, and together with the features extracted from the corre-sponding MIDI file, the feature vector of a piece of music contains 28 dimensions.
Normalization is applied on each dimension to fix the values between zero and one:
Nd¼ d−Dmin
Dmax−Dmin ð
1Þ
where dis the value to be normalized,Dmax is the max-imum value for this dimension, andDminis the minimum value in the dimension.
In a music clustering system, the distance formula usu-ally determines the performance. Therefore, a method to personalize the distance formula is proposed. This is the subject of the following subsection.
3.2. Weighted squared Euclidean distance function generated from maximum likelihood estimation
Most research on content-based music recommenda-tion has adopted the Euclidean distance funcrecommenda-tion [31] (Euclidean distance is a special case of the Minkowski distance). When using the Euclidean distance to measure music similarity, each dimension is given the same portance. However, each music feature has a different im-pact on the similarity measure. For example, rhythm is usually more important in similarity calculations for rock music than it is for classical music [32]. Taking the weight of each dimension into consideration in the Euclidean distance calculation gives the weighted Euclidean distance. To limit the computation, the square root is not calcu-lated. Instead, the weighted squared Euclidean distance is used as the music distance. As every user has a different rating, the weight is separately computed for each.
Before the system can compute the weight for each dimension, it needs to obtain information from the user. To achieve this, the user is asked to rate the similarity between some tracks from 1 to 10. User-specific weights are calculated using maximum likelihood estimation (MLE). Assume that the seed track randomly selected
by the system is Q; it can be deemed a point in the
d-dimensional feature space. For any track X in data-base, the weighted squared Euclidean distance betweenX andQis as follows:
D Xð ;QÞ ¼X d n¼1
wnðxn−qnÞ
2 ð
2Þ
wherexnandqnare thenth-dimensional values of the
fea-ture vectors of tracksXandQ, respectively.
The initial weight for each dimension, wk, is 1. k-NN
closest tracks to Q. Suppose M is the set of k tracks closest to Q found using k-NN, M = {Si | Si∈k-NN of
Q, i = 1,2,…,k}. Users are then asked to rate the
simi-larity between Si and Q. The user assigns a rating
only if they feel Si and Q are similar to some degree.
Suppose ri is the similarity rating, where a higher ri
signifies a higher similarity between Si and Q. Assume
Mp is the set of non-empty scores, Mp = {mi | mi∈M
and ri≠ϕ}. According to [33], mi is an independent
event. The probability for the set of events Mp can be
represented by the following formula:
P M pjW;Q¼ ∏ mi∈Mp
P mð ijW;QriÞ
W ¼hw1;w2; ::;wdi ð3Þ where ri is the user's rating for mi. A larger ri has a
higher impact on the probability. The weight for each dimension is adjusted in vector W such that P(Mp|W,
Q) is maximized:
W0 ¼arg max
W P MpjW;QÞ
ð4Þ
Assume that P(mi|W,Q) follows a Gaussian
distribu-tion:
P mð ijW;QÞ ¼ 1 2π ð Þd
2
ffiffiffiffiffiffiffiffiffiffiffiffiffi Yd
n¼1 1 wn v u u t
exp −1
2D mð i;QÞ
ð5Þ
The partial derivatives of P(Mp|W,Q) with respect to
eachwican be computed as:
∇ P MpjW;Q
;W
≡ ∂P MpjW;Q
∂w1 ;
∂P M pjW;Q
∂w2 ; :::;
∂P M pjW;Q
∂wd
ð6Þ
For W to maximizeP(Mp|W,Q), the partial derivative
for each dimension should be zero. In order to simplify this calculation, the log ofP(Mp|W,Q) is taken:
lnP M pjW;Q
¼ ∑
mi∈M ri
1 2
Xd
n¼1
ln wn−D mð i;QÞ−d ln 2ð Þπ
!
" #
ð7Þ
and,
∂lnP M pjW;Q
∂wn ¼
0 ð8Þ
Thus:
∑
mi∈Mp ri
1−wn mi;n−qn
2
2wn ¼
0 ð9Þ
wheremi,nis the nth-dimensional value ofmi, and qnis
thenth-dimensional value ofQ.
Finally, the new weightw’nfor thenth dimension is as
follows:
w0n¼wn¼
∑
mi∈Mp ri
∑
mi∈Mp
ri mi;n−qn
2 ð10Þ
A single question does not provide enough data to estimate the user's preferences in terms of music dis-tance. The above process is repeated several times to compute weights that are more representative. Suppose
the user provides T independent responses, then the
final weight of thenth dimension is:
wn¼
XT
t¼1 w0n;t
T ð11Þ
wherew’n,tis the re-weighted value of thenth dimension
ofWin roundt.
After recording the user's perception of distances through surveys, the above formula is utilized to obtain the personalized distance function. This function forms the basis for music clustering in the next step.
4. Music selection interface using SOM index
The SOM is capable of mapping multi-dimensional data into one- or two-dimensional neurons and is hence ideal for selecting music and generating playlists. First, the personal distance function obtained in the previous sec-tion is used to select the winner neurons in the SOM and cluster all the songs according to their feature values. This two-dimensional space is then displayed on the touch screen of the car audio system. Users can press or slide their finger on the touch screen to select songs or playlists.
4.1. SOM and HSOM clustering
The competitive learning procedure of the SOM with a personalized distance function is as follows [34]:
Step 1: Initialization. Set initial synaptic weights of neuronsv∈V(Vis the set of neurons) to small random values, in the interval [0, 1]. Assign a small positive value to the learning rate parameterα. Setjandkas the linear decay functions.Ris the radius used for determin-ing neighbors.
neuronjxat iterationtusing the minimum personal
dis-tance (weighted squared Euclidean disdis-tance):
jX ¼ arg min v∈V X
−v
k k ð12Þ
Step 3: Learning. Foru in neighbor (jx,R), update the
synaptic weights as:
Ciuðpþ1Þ ¼Ciuð Þ þp ΔCiuð Þp ð13Þ whereΔCiu(p) = α× [xi−Ciu(p) × wiis the weight
cor-rection in iterationp.wi is the weight of dimensioni in
the personal distance function.
Step 4: Iteration. Update the learning rate and radius as:
a¼ka ð14Þ
R¼jR ð15Þ
Increase p by 1, return to Step 2 and continue until the criterion is satisfied, or no noticeable changes occur in the feature map.
Suppose there aren×nneurons in a two-dimensional SOM. After the SOM clustering is complete, the tracks in the database will be clustered based on content, into
at most n × n clusters. As shown in the example of
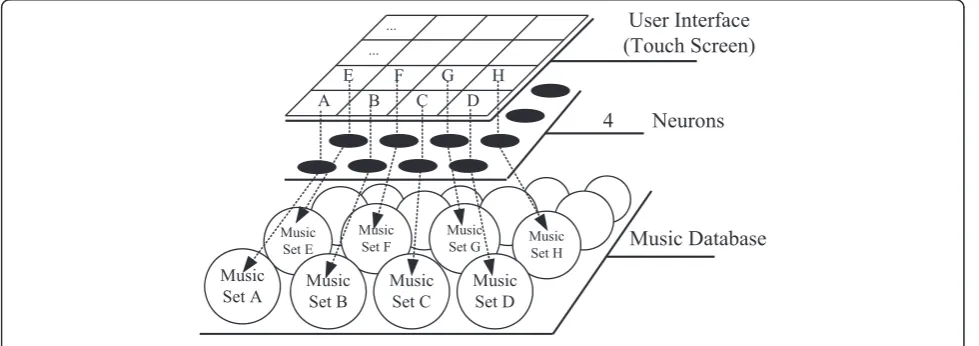
Figure 2, the SOM has 4 × 4 neurons, resulting in a division into a maximum of 16 clusters (the SOM with 4 × 4 neurons is only an example for illustration purposes, and in the actual experiments, a 10 × 10 grid was utilized). To generate the user interface, the screen area is divided into n × n regions, i.e., one for each neuron. When the user presses a particular region of the touch screen, a cluster of tracks corre-sponding to that neuron will be retrieved. For ex-ample, if the user selects region A, the system will play tracks from Music Set A. If region B is selected, the system will play tracks from Music Set B, etc. The
system randomly chooses tracks from the selected music set to play.
There are two problems that need to be solved in the above design. (1) According to the characteristics of the SOM clustering, some neurons may not be win-ner neurons of any tracks. Therefore, when a user se-lects that region, there will be no tracks to play. (2) Some clusters may have a large number of tracks, which may have widely varying characteristics. To ad-dress these problems, two strategies are proposed as follows.
The neurons after the SOM clustering have a property, i.e., the sets corresponding to nearby neurons are usually closer than the sets corresponding to far away neurons. Taking Figure 2 as an example, the distance between Music Set A and Music Set B is smaller than the dis-tance between Music Set A and Music Set G because their corresponding neurons are closer. Using this prop-erty, if the selected neuron has no relevant tracks, the closest neurons are checked in order until a neuron is found that has relevant tracks.
In Figure 3, an example with 5 × 5 neurons is shown. Suppose that the user pressed region T, and region T contains no tracks. To find a track to play, the neighbor-ing regions are searched in their numbered order, until a region with tracks is found. If several regions in the same level all have tracks, the distances between the neuron vectors of these regions and the vector of neuron T are calculated, and the tracks are selected in the nearest neuron as candidates. If more than one neuron is equally close, a neuron is picked at random.
The formula for selecting the replacement region is as follows:
Assume Vn is the neuron set in level n for the
se-lected neuron X, and the music set belonging to the
neuron of Vn is not empty. The replacement region
of X is as follows:
RX¼ arg min
v∈Vn kX−vk ð
16Þ
The weighted squared Euclidean distance function is used in the formula.
Since many tracks may be clustered to the same neuron, those tracks are clustered further in the next layer. In other words, the multi-layer clustering algo-rithm, HSOM, is adopted for clustering songs.
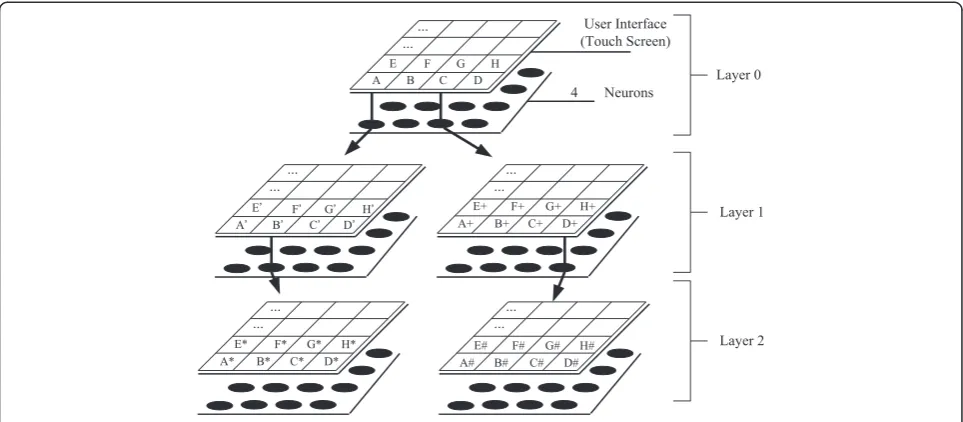
Assume that the maximum number of tracks that can be clustered to a neuron is m. If there is a cluster with size larger thanm after the upper layer SOM clustering is complete, another round of SOM clustering for those tracks is performed in the next layer, as shown in Figure 4. In layer 0, the A and C clusters have more
than m tracks, so they are further clustered in the
next layer. In layer 1, B’ and D+ also have too many
tracks, and so they are also further clustered. The limit of tracks that can be in each cluster can be dif-ferent for each layer.
With the music index generated by the HSOM, an easy method for selecting tracks is provided to the driver, which avoids the effort needed for browsing mul-tiple layers of neurons. The operation is as follows: the user selects a neuron in the upper layer SOM. If the user double clicks the region of that neuron and it has a lower layer SOM clustering, then the lower layer is displayed. This process is repeated until the user does not double click any more or the bottom layer of the HSOM is reached. Finally, tracks belonging to the last
neuron are treated as candidates. The selection of music from candidates can be randomized or be made using artificial intelligence. The artificial intelligence-based method is discussed in subsection C.
4.2. Playlist generator
In addition to pressing regions of the touch screen, the driver can also draw paths on the screen. The system will then use these paths to generate a playlist. Figure 5 shows an example. The user draws three paths on the screen. The system can arrange songs in the playlist according to the types forming the paths. In this example, the types are ordered as follows: A->G->H->I->E->P->L->W->S->T. If the region covered contains no tracks, the procedure is processed as discussed in the previous section.
If the user does not want to generate a playlist in the first layer, they can make more detailed selections on the lower layers.
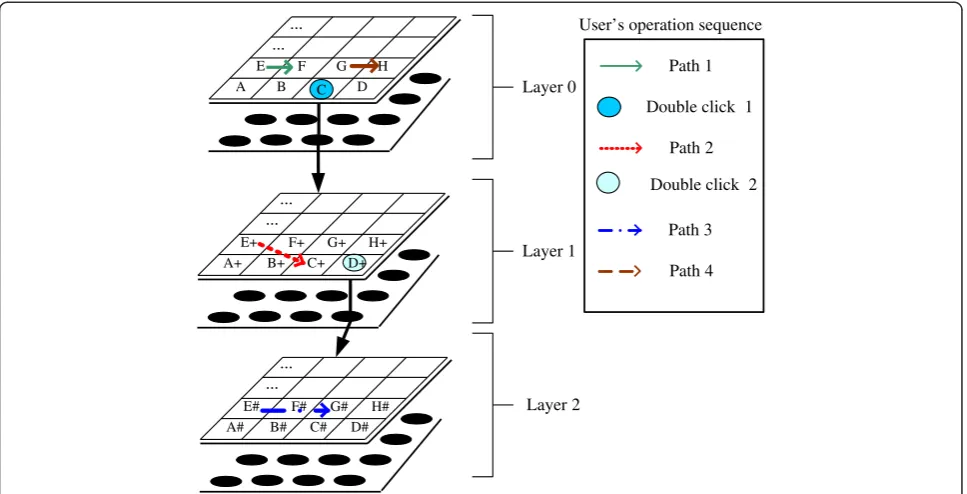
Take Figure 6 as an example. The user first draws a path going through regions E and F on layer 0, then double clicks region C. The system will display the next layer of clustering on the screen. The user continues to draw a path going through the E+F+B+C+ sub-clusters, which all belong to cluster C. Next, the user double clicks region D+. The sub-clusters of D+ are displayed on the interface, and the user draws a path through the F#E#G# regions. Next, the user returns to layer 0 (two-finger slide input is defined as returning to the last layer) and draws a path through the G and H regions. The above operations will generate a playlist with tracks in this order: E->F-> E+−>F+−>B+−>C+−> F#-> E#->G#->G->H.
4.3. Strategies of music selection from clusters
In the previous section, how to select certain categories of tracks is discussed. When there are too many music in some categories, the SOM clustering can be applied multiple times, but it takes longer for the driver to select tracks if there are too many layers. Therefore, the num-ber of layers in the HSOM is limited. For tracks in the same categories, two strategies are designed to select the tracks to be played. The first strategy is fast and does not require data to be collected beforehand. The second one uses artificial intelligence to select the tracks.
4.3.1. Strategy I: random selection
This method selects tracks randomly. When a type (i.e., a cluster) of tracks is selected, the probability of a track m being played is as follows:
P mð Þ ¼1=ðsize of the clusterÞ ð17Þ
4
2
1
2
4
3
1
T
1
3
4
2
1
2
4
5
4
3
4
5
4.3.2. Strategy II: selection by artificial neural networks The above method is simple, but it does not take user preferences into consideration and may play a track that the user does not like, which may distract the driver into changing the music. To address this problem, an intelli-gent mechanism should be developed. This mechanism can select tracks that the user will likely want to be played based on past user preferences. Typically, this kind of intelligent mechanism requires collecting user preferences, i.e., the driver would need to rate the tracks played. However, as it is not easy to rate music when driving, the ratings are recorded when the vehicle is stationary. For example, when the driver uses a PC at home or another hand-held device to listen to music, they can rate the music. The decision about not allowing drivers to rate music while driving is made in the inter-est of safety. The input data for music selection engine
includes the attributes of the music features. After the engine evaluates these inputs through an intelligent mech-anism, it outputs the predicted value, which dictates user preference for the musical piece. This value can be regarded as the class label in the prediction process, a type of classification. Artificial neural networks (ANN) have been adopted as the core of the music selection engine in this work due to its ability to classify continuous values (i.e., the values of input features).
Training data of artificial neural networks. In order to enable the neural networks to learn user preferences, the system lists scores with the associated music file name (or ID). As shown in Table1.
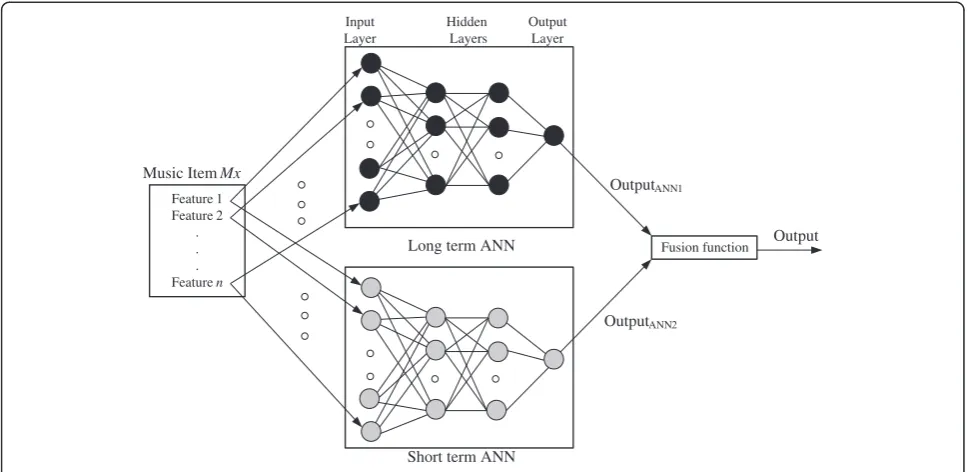
The kernel of the playlist generator: a mixed ANN. The previous method from [30] is utilized. The training time of the ANN can be higher than normal in two cases: firstly, when the training set data for an ANN have higher dimensionality or consist of a larger amount of training samples, and secondly, when the prediction does not satisfy the user requirement and hence new feedback is recorded to retrain the ANN. Retraining the system takes time if all the user data are used as the training sample. To reduce the retraining time, the structure is modified as shown by Figure7. This structure includes two ANNs: ashort-term ANN andlong-term ANNto record the user's short- and long-term preferences, respectively.
Both the long-term and short-term ANNs are multi-layer feed-forward neural networks with two hidden layers. To predict a user's preference for a musical piece
U
V
W
X
Y
P
Q
R
S
T
K
L
M
N
O
F
G
H
I
J
A
B
C
D
E
Path 1
Path 2
Path 3
Figure 5User interface and sample operations.
Mx, the features of Mx form the input vector of the input units for the two ANNs. Two output values are
obtained, namely OutputANN1 and OutputANN2, which
are combined to form a single value using a fusion function. The output of this fusion function is the predicted user score for the music. The fusion func-tion is defined as:
FðOutputANN1;OutputANN2Þ
¼w1OutputANN1þw2OutputANN2 ð18Þ
where w1+ w2= 1.
The two weight parametersw1andw2can be adjusted
by the user. If the user increases the value ofw2, prefer-ence is given to musical tracks that the user has recently heard and given higher scores to. Conversely, if the user increases the value of w1, preference is given to tracks that the user heard in the past and gave higher scores to. The system builds a personal mixed ANN for each user. The scores recorded in the user's profile provide the basis of the training data for the personal mixed neural networks, i.e., the long-term and short-term ANN. The score record contains the music ID, score,
and playing date. Through a database search using the music ID, the system first obtains the music features that are associated with it. These features form training data input, which include the basic music features that the user has assigned the score to. It is intuitive to say that the output is the associated score value. The date of the training data for the long-term ANN will be older. The training process uses supervised learning. The bias weight adjustment uses error back-propagation.
If the trained personal mixed ANN does not satisfy the user, and the user decides to rebuild the bias weights, the short-term ANN is first retrained with the user-modified score table. The long-term ANN will only be retrained if the resultant short-term ANN cannot satisfy the user.
Once the user selects the music type in the SOM interface, the above mechanism to calculate the scores for the tracks in that cluster is used. To avoid playing just the highest scoring track every time, the scores are used as the probabilities of the tracks that will be played. In other words, for a Music Set C, if songs has a score F(s), then the probability thatsis played is as follows:
P sð Þ ¼ ∑F sð Þ s0∈CF s
0
ð Þ ð19Þ
5. Experiment and evaluation
To study the mobility and stability of a car audio system, a tablet is used as the client side platform for the car Table 1 Score table in the user profile
Music ID Score Date
20 10 2011/11/4
101 8 2011/11/5
252 3 2011/11/5
A B C D
E F G H
Layer 0
Layer 1
Layer 2
A+ B+ C+ D+
E+ F+ G+ H+
... ...
... ...
A# B# C# D#
E# F# G# H#
... ...
Path 1
Double click 1
Path 2
Double click 2
Path 3
Path 4 User’s operation sequence
audio system. Storing the music files, finding the person-alized distance function, and the generation of the user interface and other computations all take place on the server side. The client side provides the interface to select the music cluster, handles the data transmission, and plays the music. The simulated car audio system is shown in Figure 8.
In the experiment, 560 MP3 music files and associated MIDI files are loaded into the music database. The music genres included rock and roll, blues, country, dance, heavy metal, and pop. Features with 28 dimen-sions are extracted from the audio and MIDI files. There are 20 enlisted undergraduate students to take part in the experiment. The age of the test subjects ranged from
Input Layer
Hidden Layers
Output Layer
Long term ANN
Short term ANN
Fusion function Output
Music Item Mx
Feature 1 Feature 2
. . . Feature n
OutputANN1
OutputANN2
Figure 7The structure of a personal mixed ANN.
(a)
(b)
19 to 23. They had not been trained in music theory and listened to all types of music. The server side is based on an SQL server that records user profiles and rating results. The number of neurons in the SOM is 100, i.e., 10 × 10. The maximum number of songs in the first layer of the HSOM is 50. It halves in the second layer to 25, and so on.
Due to some of the features in our system that require manual annotation, it is not easy to be implemented in a large music database. Therefore, in the following experi-ment, we compare the effectiveness of using all the features, and only those features that can be extracted automatically (i.e., MFCCs). Moreover, the first experi-ment is also used for the selection of n and k for the weighted squared Euclidean distance. In the proposed method, users are asked to rate the similarity betweenn tracks from the database andkcandidate tracks for each
of those n tracks. The weighted squared Euclidean
distance is then calculated for each user. The system employs the personalized distance function to cluster tracks using the SOM. In the experiment, two tracks are randomly selected in the same cluster and then played to the user. The user decides whether it is appropriate to put them in the same cluster. The number of randomly selected pairs is 20, which means the subject has to listen to 40 tracks for this experiment. In addition to the user determining whether songs are related, another method of judging whether songs are similar is to see if
they belong to the same genre. The performance of the clustering system is defined as:
precision¼Na
N ð20Þ
where N is the number of pairs selected, and Na is the
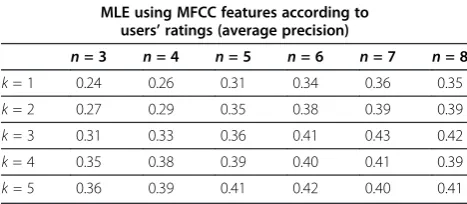
number of pairs with positive ratings (for human judg-ment) or with the same genre label (for system judgjudg-ment). The experiment shows how different values ofnandk used in the survey affect the clustering performance when using different feature sets. Users have a web page where they listen to music and answer the survey ques-tions. The method is called MLE. Experimental results are shown from Tables 2, 3, 4, and 5. The average preci-sion is calculated across the 20 users. The average precision using the traditional squared Euclidean dis-tance as the music disdis-tance measure for recommenda-tion is 0.35 using all of the features. Moreover, the average precision is 0.23 only using MFCCs features.
The proposed method outperforms the simple squared Euclidean distance as long as there are a sufficient num-ber of ratings. This suggests that it is unreasonable to treat each dimension equally when calculating music similarities. Initially, the precision of the proposed method improved asnand kincreased. However, after a threshold, the precision increase is insignificant and may even decrease. When users are presented with too many questions, they may lose patience and not give objective Table 2 Clustering performance of the MLE using all
features according to users' ratings
MLE using all features according to user's ratings (average precision)
n= 3 n= 4 n= 5 n= 6 n= 7 n= 8
k= 1 0.37 0.39 0.41 0.42 0.44 0.45
k= 2 0.37 0.42 0.43 0.45 0.47 0.46
k= 3 0.38 0.45 0.48 0.52 0.53 0.51
k =4 0.41 0.49 0.53 0.61 0.67 0.62
k =5 0.45 0.51 0.54 0.59 0.62 0.61
Table 3 Clustering performance of the MLE using MFCC features according to users' ratings
MLE using MFCC features according to users’ratings (average precision)
n= 3 n= 4 n= 5 n= 6 n= 7 n= 8
k= 1 0.24 0.26 0.31 0.34 0.36 0.35
k= 2 0.27 0.29 0.35 0.38 0.39 0.39
k =3 0.31 0.33 0.36 0.41 0.43 0.42
k= 4 0.35 0.38 0.39 0.40 0.41 0.39
k =5 0.36 0.39 0.41 0.42 0.40 0.41
Table 4 Clustering performance of the MLE using all features according to the genre label
MLE using all features according to the genre label (average precision)
n= 3 n= 4 n= 5 n= 6 n= 7 n= 8
k= 1 0.18 0.21 0.24 0.26 0.26 0.25
k= 2 0.21 0.24 0.23 0.25 0.28 0.31
k= 3 0.24 0.24 0.26 0.31 0.33 0.29
k =4 0.26 0.29 0.32 0.37 0.38 0.38
k =5 0.32 0.31 0.34 0.36 0.36 0.35
Table 5 Clustering performance of the MLE using the MFCC features according to the genre label
MLE using the MFCC features according to the genre label (average precision)
n= 3 n= 4 n= 5 n= 6 n= 7 n= 8
k= 1 0.15 0.15 0.14 0.16 0.21 0.19
k= 2 0.18 0.21 0.23 0.22 0.24 0.24
k= 3 0.19 0.23 0.24 0.28 0.31 0.29
k =4 0.20 0.23 0.27 0.32 0.32 0.31
ratings. In addition, many candidate tracks have to be rated for each one, and it becomes harder to give clear ratings. Unclear ratings negatively affect the recommen-dation performance.
Comparing the precision of different feature sets, the precision obtained when only using MFCCs is inferior to that obtained when using all features. This result indi-cates that human input is required to improve the accur-acy of clustering, even though it takes more time to process the retrieved information.
In addition, the use of different methods to measure precision will lead to different results. If we calculate precision according to whether the music belongs to the same genre, we find that the average precision is lower than when the user decides if the music belongs to the same cluster. From this, we find that most music that is classified as belonging to the same genre is actually per-ceived very differently by the user.
Aside from the above experiments, we carry out a similar experiment on whether there is a common dis-tance function that all users are able to use. This experi-ment is different from the first experiexperi-ment as it uses the estimated distance provided by all users to calculate a weighted squared Euclidean distance function. However, the average precisions obtained from the distance func-tion are less than 0.3. In addifunc-tion, the variafunc-tion in the multi-dimension parameters for each user's distance function is quite large, indicating the necessity of per-sonalizing the distance function.
The second experiment measured the effect of the number of HSOM layers on precision. In the experi-ment, the maximum number of layers for HSOM is established. When the maximum number of layers is established, even if too many songs are clustered in the same layer, we do not add another layer. In addition, when the experiment selects a pair, it is always chosen from the lowest cluster. According to the previous tables, the values ofnand kused for calculating the per-sonalized distance function are 7 and 4, respectively. All
of the features are used in this experiment. The experi-mental result is shown in Table 6.
Table 6 shows that a higher maximum number of layers lead to more effective segmentation. However, when considering the ease of use of the user interface, too many layers may lead to users spending excessive time controlling the car audio system. However, if we only use a single-layer SOM, the similar characteristics of the songs may lead to their grouping in certain clusters, making it difficult for the user to select the type of song they would like to hear. Therefore, in subsequent experiments on the operation of the car audio system, the number of HSOM layers is deter-mined by the total number of songs. In other words, when too many songs are grouped in one cluster, we created a new level.
As the personal mixed ANN has several parameters that are not easy for the user to determine, including the time period of training data for the short term as well as the weighing of short-term and long-term ANN (i.e., w1 and w2), we tested, under different pa-rameters, the proportion of the songs recommended by the personal mixed ANN using different clusters that the user could accept.
The performance of the recommendations generated by the personal mixed ANN is defined as:
Rprecision¼Pa
P ð21Þ
where P is the number of tracks recommended by the
system andPais the number accepted by the user.
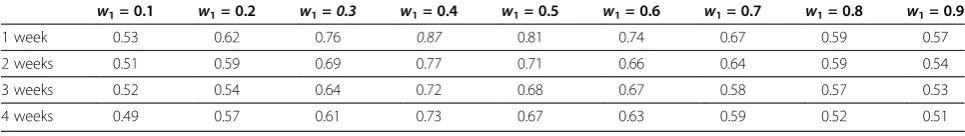
In the experiment, ten songs were recommended to each user under different parameters before the average R_precision value was calculated. The results are shown in Table 7.
From Table 7, it is clear that the best results are obtained when the time period of training data for the short-term ANN is set to 1 week andw1= 0.4,w2= 0.6. The results show that users are more interested in songs that they have recently awarded high scores.
The next experiment investigates the time the driver spent operating the audio system while driving. A con-ventional car audio system was used. Some of the com-mon options offered included selecting a music file using folder selection or file selection. The music files Table 6 The clustering performances of different
maximum layers using HSOM
Layers of the HSOM 1 2 3 4 5
Average precision 0.47 0.53 0.61 0.64 0.68
Table 7 Recommendation performance of different parameters values in the personal mixed ANN
w1= 0.1 w1= 0.2 w1=0.3 w1= 0.4 w1= 0.5 w1= 0.6 w1= 0.7 w1= 0.8 w1= 0.9
1 week 0.53 0.62 0.76 0.87 0.81 0.74 0.67 0.59 0.57
2 weeks 0.51 0.59 0.69 0.77 0.71 0.66 0.64 0.59 0.54
3 weeks 0.52 0.54 0.64 0.72 0.68 0.67 0.58 0.57 0.53
4 weeks 0.49 0.57 0.61 0.73 0.67 0.63 0.59 0.52 0.51
were manually categorized prior to the experiment to provide hierarchical menu lists. One choice for the menu list type is designed to categorize the music files by album. The user can choose a specific album or songs to play via the user interface. Another choice of menu list is designed to categorize music files based on the genres, including classical, folk, opera, jazz, pop, blues, rock, R and B. The user can choose music files within a category or outside a category. The user can choose whether to activate the repeat or random options when selecting the category. The third type of menu list com-bines the features in the previous two. The user can categorize the music files based on the album and then sort the album based on the genres. The user can have a menu list that contains three layers.
In our approach (personal mixed ANNs named as PMANNs), the values ofnandkused for calculating the personalized distance function are 7 and 4, respectively. The weights for long-term and short-term ANN are set as 0.4 and 0.6, respectively, and the time period of train-ing data for the short-term ANN is set to 1 week. The user also controls the timing for retraining the personal
mixed ANNs. Due to a limited number of devices, the experiment was not performed on real cars, and instead, a simulator was used. The experiment procedure is as follows: the user listens to tracks on the simulated car audio system 1 h every day. To allow a fair comparison of the operation time, each song is cropped to 2 min. When the user hears a song that is not desired, or when a song has finished playing, the user needs to operate the car audio system to select the next song to play. We then perform statistical analysis of the average operation time for each interface for the car audio system within 1 h.
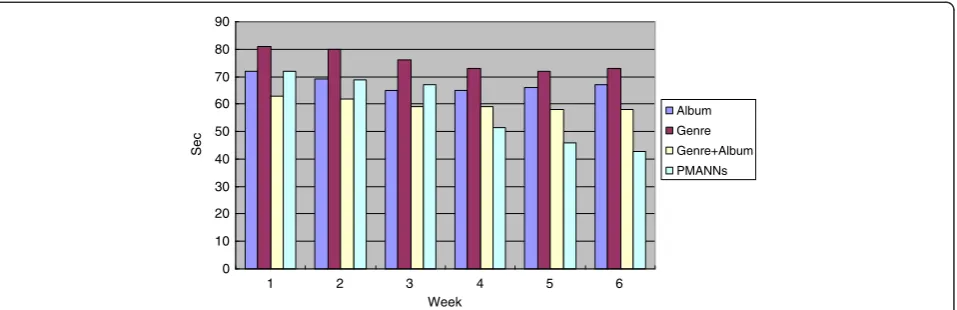
Figure 9 shows the experiment conducted over 6 weeks.
It can be seen from the experimental data that the time spent on each method has reduced as the number of weeks increased. The users gradually became familiar with each interface, which helped to speed up the time taken to locate the desired music files. The method we proposed had poor performance in the first 3 weeks; however, from week 4 onwards, the time the user spent on operation was significantly less than that of the other
Sec
0 10 20 30 40 50 60 70 80 90
1 2 3 4 5 6
Week
Album Genre Genre+Album PMANNs
Figure 9Average time spent in operating car audio system in 1 h over 6 weeks.
0 10 20 30 40 50 60 70 80 90
1 2 3 4 5 6
Week
Se
c
Album Genre Genre+Album PMANNs
methods. The reason is that after several weeks of data collection, the PMANNs are seen to be able to infer user preferences more accurately. The time spent on oper-ation using conventional interfaces stabilized after 3 weeks. The method using both the Genre + Album required less time. Visual ability is not required when operating the audio system, since the user would have already memorized the interface. Our third experiment uses a camera to measure the time the user takes their eyes off the road to look at the car audio. Figure 10 shows the experiment result.
It can be seen from the experiment data that during the first week, the user needs to look at the audio inter-face in order to operate it. However, starting from the second week, the user can reduce the time spent on the monitor based on the memories of previous operations. Our method allows the user to select music files using 2D images. The user can rapidly complete the operation by touching specific locations on the touch panel. In contrast, for a conventional operating interface, the user would need to spend an extended period of time interacting with the monitor in order locate a specific song from a long list of the file names, since each genre category contains a large number of songs. Observation of the results from the two experiments described above demonstrates that our proposed method requires the least operation time and requires the least time for the user to look at the monitor. The reduced time allows the driver to concentrate on the road while driving, which reduces the risk of an accident.
6. Conclusions
Along with the rapid development of telecommunica-tions technology and tablet PCs, next-generation car audio systems are being investigated. Making future car audio systems more useful is an important research topic. A new method for music clustering is proposed, and a user interface is designed for such a system, which reduces the interaction needed, while still providing the required music output. First, a personalized music distance function is estimated for each user based on their preferences. This function is then used to perform personalized SOM clustering and generate a personal-ized user interface by utilizing the ability of the SOM to map data from high-dimensional space onto a two-dimensional plane. The experiments demonstrated that this new interface reduced the average operating time. In addition, ANNs are used to learn user preferences for music and automatically select tracks according to those preferences. This artificial intelligence-based method can reduce the risk of accidents occurring from drivers oper-ating the audio system while in motion. There is still much room for improvement in this car audio system, for example, improving the music distance functions.
Further work is also needed to develop a better user interface, in contrast to using a simple grid.
In this system, the user needs to complete a question-naire on similar music tracks, which may create an unreasonable burden. In the future, we plan to increase the number of experimental subjects to establish whether information of the distance function obtained from certain users can be used for the music clustering of other users. For drivers, being able to listen to the music they want to hear without having to operate the car stereo system is our ideal scenario. In the future, we will also carry out research on recommendation systems, for example, the use of collaborative filtering methods to create music streaming schedules.
Competing interests
The author declares that he has no competing interests.
Acknowledgements
This work was supported in part by the NSC in Taiwan under the contact numbers NSC102-2218-E-020-002 and NSC101-2221-E-020-025.
Received: 1 March 2013 Accepted: 2 July 2013 Published: 10 July 2013
References
1. A Paya, DC Marinescu, A cloud service for adaptive digital music streaming, (Proceedings of the 8th International Conference on Signal Image Technology and Internet Based Systems, Naples, 25-29 Nov 2012), pp. 910–917 2. D Kern, A Schmidt, J Arnsmann, T Appelmann, N Pararasasegaran, B Piepiera,
Writing to your car: handwritten text input while driving, inProceedings of the 27th International Conference Extended Abstracts on Human Factors in Computing Systems(Boston, 4-9 Apr 2009), pp. 4705–4710
3. M Pfeiffer, D Kern, J Schöning, T Döring, A Krüger, A Schmidt, A multi-touch enabled steering wheel: exploring the design space, inProceedings of the 28th International Conference Extended Abstracts on Human Factors in Computing Systems. Atlanta28, 3355–3360 (Apr 2010)
4. FE Sandnes, YP Huang, YM Huang, An eyes-free in-car user interface interaction style based on visual and textual mnemonics, chording and speech, inProceedings oftheInternational Conference on Multimedia and Ubiquitous Engineering of ACM. Busan24–26, 342–347 (Apr 2008) 5. D Schnitzer, T Pohle, P Knees, G Widmer, One-touch access to music on
mobile devices, inProceedings of the 6th International Conference on Mobile and Ubiquitous Multimedia of ACM. New York12–14, 103–109 (Dec 2007) 6. D Prescher, G Weber, M Spindler, A tactile windowing system for blind
users, inProceedings of the 12th International ACM SIGACCESS Conference on Computers and Accessibility. New York25–27, 91–98 (Oct 2010)
7. F Alonso, S Frutos, C Montes, RJ Navajo, A generic blind user interface model. Syst Man Cybern2, 1133–1138 (1998)
8. A Rauber, E Pampalk, D Merkl, The SOM-enhanced JukeBox: organization and visualization of music collections based on perceptual models. J New Music Res32(2), 193–210 (2003)
9. T Kohonen, Self-organized formation of topologically correct feature maps. Biol Cybern43, 59–69 (1982)
10. T Kohonen,Self-organizing maps. Volume 30 of Springer Series in Information Sciences, 3rd edn. (Springer, Berlin, 2001)
11. MC Su, HT Chang, Fast self-organizing feature map algorithm. IEEE Trans. Neural Networks11(3), 721–733 (2000)
12. MC Su, TK Liu, HT Chang, Improving the self-organizing feature map algorithm using an efficient initialization scheme. Tamkang Journal of Sci Eng5(1), 35–48 (2002)
13. A Duarte, D Neto, JAF Costa, MLA Netto, Hierarchical SOM applied to image compression, inProceedings of the International Joint Conference on Neural Networks. Washington, DC15–19, 442–447 (Jul 2001)
15. O Celma, P Lamere, If you like radiohead, you might like this article. AI Mag 32(3), 57–66 (2011)
16. H Wang, W Wang, J Yang, PS Yu, Clustering by pattern similarity in large data sets, inProceedings of ACM Special Interest Group on Management of Data. Madison3–6, 394–405 (Jun 2002)
17. D McEnnis, SJ Cunningham, Sociology and music recommendation systems, (Proceedings of the International Conference on Music Information Retrieval, Vienna, Sept 2007), pp. 185–186
18. S Pauws, S Wijdeven, User evaluation of a new interactive playlist generation concept, (Proceedings of the International Conference on Music Information Retrieval, London, 11-15 Sept 2005), pp. 638–643
19. JL Herlocker, JA Konstan, Content-independent task focused recommendation. IEEE Internet Comput5(6), 40–47 (2001) 20. CS Firan, W Nejdl, R Paiu, The benefit of using tag-based profiles,
(Proceedings of the Latin American Web Conference, Washington DC, 31 Oct-2 Nov 2007), pp. 32–41
21. X Zhu, YY Shi, HG Kim, KW Eom, An integrated music recommendation system. IEEE Trans. Consum Electron52(3), 917–924 (2006)
22. A Flexer, D Schnitzer, M Gasser, G Widmer, Playlist generation using start and end songs, (Proceedings of the 9th International Conference on Music Information Retrieval, Philadelphia, 14-18 Sept 2008), pp. 173–178 23. JJ Aucouturier, F Pachet, Scaling up music playlist generation, inProceedings
of IEEE International Conference on Multimedia and Expo. New York26–29, 105–108 (Aug 2002)
24. K Kaji, K Hirata, K Nagao, A music recommendation system based on annotations about listeners’preferences and situations, (Proceedings of the First International Conference on Automated Production of Cross Media Content for Multi-Channel Distribution, 30 Nov-2 Dec 2005), pp. 231–234 25. A Andric, G Haus, Automatic playlist generation based on tracking user’s
listening habits. Multimedia Tools and Appl29(2), 127–151 (2006) 26. NH Liu, SJ Hsieh, Intelligent music playlist recommendation based on user
daily behavior and music content. Lect Notes Comput Sci5879, 671–683 (2009)
27. J Foote, S Uchihashi, The beat spectrum: a new approach to rhythm analysis, inProceedings of the International Conference on Multimedia Expo. Tokyo22, 881–884 (Aug 2001)
28. G Tzanetakis, P Cook, Music genre classification of audio signals. IEEE Trans. Speech Audio Process10, 293–302 (2002)
29. NH Liu, HY Kung, JoMP: a mobile music player agent for joggers based on user interest and pace. IEEE Trans. Consum Electron55(4), 2225–2233 (2009) 30. NH Liu, SJ Shieh, CF Tsai, An intelligent music playlist generator based on
the time parameter with artificial neural networks. Expert Syst Appl37(4), 2815–2825 (2010)
31. J Foote, M Cooper, U Nam, Audio retrieval by rhythmic similarity, (Proceedings of the International Society for Music Information Retrieval Conference, Paris, 23-30 Sept 2002), pp. 265–266cbrs
32. B Shao, DD Wang, T Li, M Ogihara, Music recommendation based on acoustic features and user access patterns. IEEE Trans Audio Speech Lang Process17(8), 1602–1611 (2009)
33. CC Chiang, JY Wu, MT Yang, WK Tai, Independent query refinement and feature re-weighting using positive and negative examples for
content-based image retrieval. Multimedia Tools and Appl41(1), 27–53 (2009) 34. M Negnevitsky,Artificial Intelligence: A Guide to Intelligent Systems, 2nd edn.
(Addison-Wesley, New York, 2002)
doi:10.1186/1687-4722-2013-20
Cite this article as:Liu:Music selection interface for car audio system
using SOM with personal distance function.EURASIP Journal on Audio,
Speech, and Music Processing20132013:20.
Submit your manuscript to a
journal and benefi t from:
7Convenient online submission 7Rigorous peer review
7Immediate publication on acceptance 7Open access: articles freely available online 7High visibility within the fi eld
7Retaining the copyright to your article