O R I G I N A L R E S E A R C H
Open Access
A semi-automatic technique to quantify
complex tuberculous lung lesions on
18
F-fluorodeoxyglucose positron emission
tomography/computerised tomography
images
Stephanus T. Malherbe
1,2*, Patrick Dupont
3,4, Ilse Kant
4, Petri Ahlers
1,2, Magdalena Kriel
1,2, André G. Loxton
1,2,
Ray Y. Chen
5, Laura E. Via
5,6, Friedrich Thienemann
6,7, Robert J. Wilkinson
6,7,8,9, Clifton E. Barry III
1,2,5,6,
Stephanie Griffith-Richards
10, Annare Ellman
4, Katharina Ronacher
1,2,11, Jill Winter
12, Gerhard Walzl
1,2,
James M. Warwick
4and the Catalysis Biomarker Consortium
Abstract
Background:There is a growing interest in the use of18F-FDG PET-CT to monitor tuberculosis (TB) treatment response. However, TB causes complex and widespread pathology, which is challenging to segment and quantify in a reproducible manner.
To address this, we developed a technique to standardise uptake (Z-score), segment and quantify tuberculous lung lesions on PET and CT concurrently, in order to track changes over time. We used open source tools and created a MATLAB script. The technique was optimised on a training set of five pulmonary tuberculosis (PTB) cases after standard TB therapy and 15 control patients with lesion-free lungs.
Results:We compared the proposed method to a fixed threshold (SUV > 1) and manual segmentation by two readers and piloted the technique successfully on scans of five control patients and five PTB cases (four cured and one failed treatment case), at diagnosis and after 1 and 6 months of treatment. There was a better correlation between the Z-score-based segmentation and manual segmentation than SUV > 1 and manual segmentation in terms of overall spatial overlap (measured in Dice similarity coefficient) and specificity (1 minus false positive volume fraction). However, SUV > 1 segmentation appeared more sensitive. Both the Z-score and SUV > 1 showed very low variability when measuring change over time. In addition, total glycolytic activity, calculated using segmentation by Z-score and lesion-to-background ratio, correlated well with traditional total glycolytic activity calculations. The technique quantified various PET and CT parameters, including the total glycolytic activity index, metabolic lesion volume, lesion volumes at different CT densities and combined PET and CT parameters. The quantified metrics showed a marked decrease in the cured cases, with changes already apparent at month one, but remained largely unchanged in the failed treatment case.
(Continued on next page)
* Correspondence:[email protected]
1DDST-NRF Centre of Excellence for Biomedical Tuberculosis Research and
South African Medical Research Council Centre for Tuberculosis Research, Cape Town, South Africa
2Division of Molecular Biology and Human Genetics, Faculty of Medicine and
Health Sciences, Stellenbosch University, Cape Town, South Africa Full list of author information is available at the end of the article
(Continued from previous page)
Conclusions:Our technique is promising to segment and quantify the lung scans of pulmonary tuberculosis patients in a semi-automatic manner, appropriate for measuring treatment response. Further validation is required in larger cohorts.
Keywords:18F-fluorodeoxyglucose (FDG) positron emission tomography (PET)/computed tomography, Tuberculosis, Image analysis, Lesion segmentation, Lesion quantification
Background
Positron emission tomography/computerised tomog-raphy (PET-CT) is well established in the diagnostic workup, treatment planning and response assessment of cancer and various inflammatory and infectious diseases [1,2]. The most commonly used PET tracer is18 F-fluor-odeoxyglucose (FDG). It reflects glucose metabolism and shows increased uptake in areas of inflammation. PET scanners measure the radiopharmaceutical concentration in tissue [3–5].
Uptake intensity in tissue is variable and influenced by numerous patient-, timing- and equipment factors, which is why the lesion-to-background ratio is often considered a more robust measure than absolute uptake [6]. Several semi-quantitative measurements of PET voxel intensity have been developed, of which standar-dised uptake value (SUV), is most commonly used. It compensates for variation in body size, injected activity and radioactive decay.
The metabolic lesion volume (MLV), maximum and mean SUV within the lesion (SUVmaxand SUVmean) and
the total glycolytic activity (TGA = MLV × SUVmean) are
the PET parameters most commonly used for lesion quantification [3,4,7–9].
The borders of the MLV can be delineated visually or using various semi-automated techniques, however no single technique has proven optimal for all applications [6]. In most cases lesion delineation is still performed manually, based on visual interpretation of PET or CT im-ages. This is prone to inter- and intra-operator variation, especially for PET due to its lower spatial resolution and inherent noise [8–15]. Multiple methods are used and proposed to decrease variation in lesion segmentation. These include using reference values to normalise the lesion- to- background uptake intensity by comparison to liver or mediastinal blood pool uptake [16–18] and the use of automated segmentation techniques. Automated segmentation techniques include thresholding techniques, gradient-based techniques and stochastic- and learning-based computerised methods [6]. Thresholds may be fixed or adaptive. Adaptive thresholds utilises image parameters, such as lesion-to-background ratio, mean background intensity and estimated lesion intensity in algorithms to define the threshold.
Some studies also focused on the quantification of im-ages from CT scanners, which measure the density of
anatomical structures and lesions in Hounsfield units (HU). It is not a functional scan and is less prone to interscan variability. Only a few studies have evaluated densometric quantification of CT scans in diffuse lung disease; however, it appears to be reproducible and cor-relate well with other disease markers [19–22]. Joint segmentation of fused PET and CT images has shown improved robustness compared to methods using only data from PET [23].
The shortcomings of sputum culture to accurately in-dicate when TB treatment has achieved sterilising cure [24–26] escalate the cost to develop improved TB treat-ment options. This has led to a growing interest to use PET-CT imaging to monitor TB treatment response [27–29]. In animal models, FDG PET-CT has been used to accurately describe disease progression and response to treatment in pulmonary tuberculosis (PTB) [30–35]. Human studies have also shown PET-CT of promise to monitor the effect of treatment using simple descriptive techniques [27, 31, 36–41]. We recently reported PET-CT findings in PTB patients, before, during and after therapy, and found strikingly complex and hetero-geneous lesion responses [42].
Reproducible segmentation and quantification be-comes particularly important in diseases with heteroge-neous morphology, vague borders and multi-focal distribution throughout an organ or system, such as TB or sarcoidosis [31,41] (example shown in Fig.1). This is especially important when accurate tracking of changes over time is required. In most animal model PET-CT studies, the authors used manual lesion delineation to track changes throughout the lungs, or in individual lesions [30–35]. Two separate human studies imple-mented whole lung quantification of PET (using fixed thresholds of SUV > 1 and SUV > 2, respectively) and semi-quantitative CT reader scores [31,41]. These found that quantified PET images were more robust than reader-based CT scores, and seemed to accurately meas-ure changes in disease burden over time. To account for the spatially complex lesions, two studies successfully utilised computer-aided segmentation, respectively, based on affinity propagation and both interactive region growing and adaptive thresholding, in PET images of TB-infected small animal models [43,44].
quantification to standardise and segment widespread and heterogenous lesions throughout the lung and re-producibly measure disease burden over time.
Methods Study design
The method was optimised on a training set of 15 lesion-free lung scans obtained from patients undergoing PET-CT scans for non-pulmonary clinical indications, as well as scans from five PTB patients showing residual lung lesions after treatment.
As a proof of concept, we applied the methodology to quantify disease burden on an independent test set of PET-CT scans from five controls and serial scans from the first five patients participating in the PTB cohort study, mentioned above [42]. The controls were from
the same communities (Cape Town, South-Africa), and had contact with PTB patients, but were sputum culture negative for Mycobacterium tuberculosis and had no active lesions visible on PET-CT scan. PTB cases were all diagnosed with drug-sensitive TB strains and were HIV negative. Cases underwent scans at time-points within 1 week from initiation of treatment (Dx), after 1 month of treatment (M1) and after 6 months of treat-ment (M6), corresponding with the duration of standard TB therapy. At the end of treatment, four of the PTB cases were sputum culture negative and classified as cured by healthcare providers in charge of treatment, while one was still sputum culture positive and diag-nosed as a failed treatment outcome. The study design is summarised in Table1.
PET-CT imaging
PET-CT scanning was performed with a Philips Gemini Big Bore time-of-flight scanner according to internation-ally accepted guidelines [45]. Patients fasted for 6 h before FDG administration, but were encouraged to hy-drate well. According to body weight, participants received 185–259 MBq of18
F-FDG intravenously 60 min before scan acquisition. PET images were reconstructed to 4 × 4 × 4 mm voxels using an iterative algorithm including time-of-flight information and corrections for random events, scatter, deadtime, attenuation and decay. The CT scan parameters were set at 120 kV, 100 mAs, without dose modulation with 1.17 × 1.17 mm pixels and a 3 mm slice thickness.
Pre-processing
We exported images from the PET-CT workstation in DICOM format and converted to ANALYSE file format [46] using MRIConvert [47]. To ensure reproducibility and facilitate direct comparison, we co-registered each patient’s follow-up scans with the baseline CT, using Statistical Parametric Mapping (SPM8) [48] with MATLAB 2013b (Mathworks Inc.). During the
Fig. 13D rendered anterior view of fused18F-FDG-PET-CT scan,
performed at diagnosis on a patient with sputum culture positive pulmonary tuberculosis. It shows a wide distribution of lesions with complex morphology, including a large cavity in the left upper lobe with surrounding nodular infiltrates and patches of consolidation in the left lower lobe
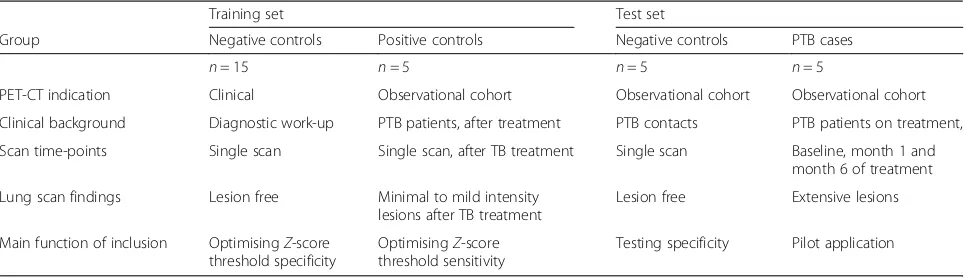
Table 1Study design for method development and pilot application
Training set Test set
Group Negative controls Positive controls Negative controls PTB cases
n= 15 n= 5 n= 5 n= 5
PET-CT indication Clinical Observational cohort Observational cohort Observational cohort
Clinical background Diagnostic work-up PTB patients, after treatment PTB contacts PTB patients on treatment,
Scan time-points Single scan Single scan, after TB treatment Single scan Baseline, month 1 and month 6 of treatment
Lung scan findings Lesion free Minimal to mild intensity lesions after TB treatment
Lesion free Extensive lesions
Main function of inclusion OptimisingZ-score threshold specificity
OptimisingZ-score threshold sensitivity
co-registration (using within-subject rigid-body model), CT images were re-sliced to the voxel matrix of the cor-responding PET scan (using trilinear interpolation). This allowed direct voxel-based comparison of each patient’s PET and CT images.
Lung masks for PET and CT
For each series of co-registered CT studies, we generated a volume of interest (VOI) as a lung mask (Fig. 2a), in MRICro version 1.39 [49] on overlaid CT images, using the 3D region-growing, gradient-based tool. This allowed setting the origin, radius and difference from
origin and edge gradient on the overlaid CT images. We combined this with manual corrections, to avoid the ex-clusion of dense lesions extending into the pleura from the VOI. The lung mask excluded the lung hila and main pulmonary vessels, but included smaller vessels. As a final adjustment, we created a VOI of organs around the lungs that included in the lung fields by misregistration [usually the liver, spleen and mediastinum (Fig. 2b)], with the region-growing tool on the PET scans, and then deleted overlapping voxels from the lung mask. We con-verted the mask to a binary image and filled any holes in the mask, using ImageJ software [50] (Fig.2c).
PET quantification: background reference
We selected two areas of normal lung parenchyma (NL) as a reference VOI to standardise uptake in lung voxels (Fig. 2d) [50]. Each NL volume consisted of spheres 15 to 25 mm in diameter that visually appeared lesion-free on all co-registered scans. To enhance the representivity of the sample, the spheres were selected in opposite lungs or in some cases in different ipsilateral lobes, depending on the distribution of lung pathology.
PET image quantification
We then quantified the pre-processed series of PET-CT images, using a MATLAB script developed in-house. The script quantified disease burden from the PET images by assigning aZ-score to all voxel counts within the lung mask based on the equation below:
Z¼counts−μNL
σNL
in whichμNLandσNLare the mean and standard deviation
of PET counts within the normal volume for each study. The Z-score provided a statistical way to standardise relative intensity of FDG uptake throughout the lungs. All lung voxels exceeding a defined Z-score threshold were defined as part of FDG-avid lesions. We then exported im-ages of segmented lesion volumes to view alongside the original images for visual quality assessment.
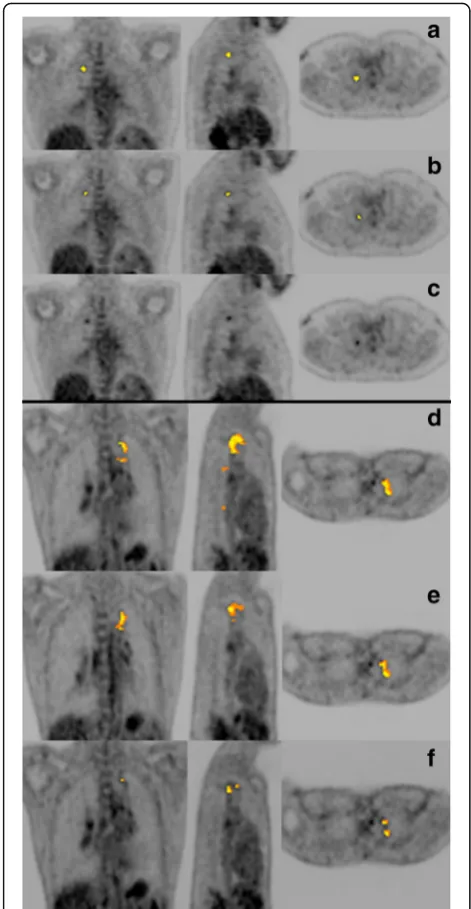
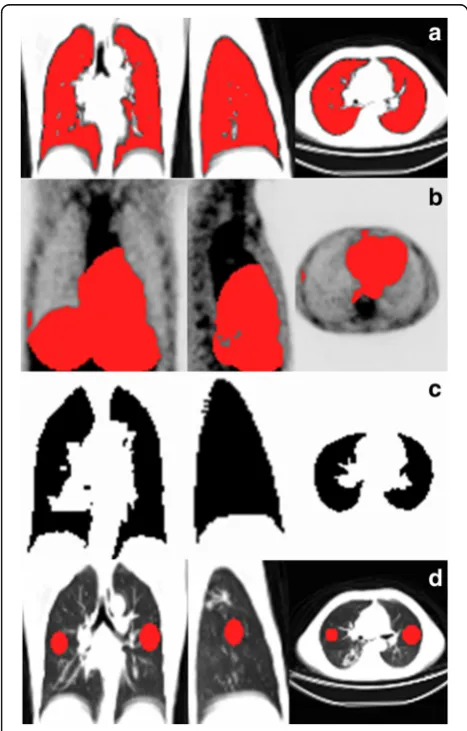
To determine the optimal Z-score threshold, we proc-essed a set of 15 lesion-free lung scans with reiterations of increasing Z-score thresholds, to minimise false positive findings. As expected, at a lowZ-score threshold, the vol-umes segmented as abnormal in these healthy lungs were high, but decreased to a value close to zero for Z ≥ 8 (Fig.3). To minimise false negative findings, we also tested increasing Z-score thresholds on scans that showed re-sidual lesions with minimal or mild intensity and complex morphology, obtained from five PTB patients after treat-ment. Intensity was graded using an adaptation of the Deauville classification [18,42]. A threshold ofZ= 8 delin-eated all lesions with minimal FDG avidity, while Z= 9
delineated all lesions with mild FDG avidity, but failed to detect some lesions with minimal FDG avidity (Fig.4). We thus chose a cut-off ofZ= 8 based on its low false positive and false negative rates.
For comparison, two readers manually delineated FDG-avid lung lesions of diagnosis (Dx) and M6 scans, based on visual assessment. We also applied different thresholds for automated segmentation within the lung mask, namely SUV > 1 and T40%. SUV > 1 is a fixed threshold, used in previous TB studies [41] to delineate lung lesions on PET, while T40% refers to 40% of the maximum intensity in a VOI, previously used in cancer studies [6].
CT density quantification
Concurrently with the PET segmentation and using the same lung mask, the MATLAB script also segmented the CT images into five categories based on the density of each voxel compared to set values obtained from literature [21,41]: (1) low density (<−950 HU), attributed to cavita-tion or extremely hyper-inflated lung tissue (Vlow); (2)
nor-mal density, between −950 HU and −500 HU; (3) soft lesion volume (Vsoft), from−500 HU to−300 HU, usually
tree-in-bud lesions or nodules, but may also include regular, medium to large vasculature; and (4) medium le-sion volume (Vmedium) from−300 HU to−100 HU. This
category should include very little normal lung tissue and usually consists of nodular infiltrates, but may also include hard lesions in early progression or partial resolution; (5) hard lesion volume (Vhard), above −100 HU, are usually
due to consolidation, cavity walls, bronchial thickening or calcified fibrosis.
We performed visual checks of the accuracy of CT lesion delineation, based on these fixed density thresholds. For lesions with increased density (Vsoft, Vmedium, Vhard), the segmented areas corresponded
well to lesion morphology. However, using −950 HU as the upper limit for low-density lesions was not specific enough for cavitation and the segmented areas in some cases included bullae, bronchiectasis, and severe emphysema. This necessitated an add-itional step to measure the volumes of individual cavities for each scan. This was done using the MRICro’s 3D region-growing tool (boundary-based segmentation).
PET lesion intensity quantification
After segmentation, the program quantified the follow-ing PET parameters: (1) MLV, (2) the mean Z-score in the MLV (Zmean), (3) TGA (MLV × SUVmean), (4) total
glycolytic activity index (TGAI): the product of the MLV and mean lesion-to-background intensity (TGAI= MLV×mean lesion counts/mean counts in normal lung). In addition, the program also measured the total lung volume [TLV (ml)] and the volumes of each abnormal density category on CT, i.e., Vlow, Vsoft, Vmedium, and Vhard, as well as a combined PET-CT metric:
MLVabN[the intersection of MLV and area with
in-creased density on CT (≥500 HU)].
Re-slicing of the CT to the corresponding PET allowed the program to compare CT density and PET intensity, directly per voxel.
Manual segmentation
The two manual readers are clinicians, with experi-ence in the diagnosis and treatment of pulmonary tuberculosis. They are also clinical trial investigators and trained in PET-CT evaluation for a phase 3 clinical trial that aims to use PET-CT parameters to guide TB treatment duration [28]. Manual segmentation of
FDG-avid PET lesions in PTB scans took roughly 30– 90 min per scan.
Statistical analysis
Volumetric comparisons were performed using the dice similarity coefficient (DSC), a validated approach to measure spatial overlap [51, 52]. In addition, the true positive volume fraction (TPFV) was calculated to indi-cate segmentation sensitivity and one minus the false positive volume fraction (1-FPVF) to indicate specificity. Statistical analysis was performed using Statistica Ver-sion 13©. For numerical variables we report median, range and 25th and 75th percentiles to accommodate the modest sample size included in this pilot project. Agreement measures are reported using a Bland-Altman plot showing only bias and values and not confidence in-tervals and standard deviations. We report the correl-ation coefficient and p values for correlations between numerical variables.
Results
Application of technique
We successfully implemented the quantification method-ology in all controls and cases. Creating the masks re-quired knowledge of lung anatomy, while the other steps required basic computer literacy. The user input required for quantification could be divided into (1) file manage-ment (including the selection, indexing and formatting of image files) and (2) creating VOIs for lung masks, background references and areas affected by motion misregistration. The time required to quantify scans ranged approximately from 10 min for a lesion-free lung scan at one time-point, to 45 min for a three time point series of extensively diseased lungs. Where applicable, cavity volumes were easily measured with MRICro’s 3D region-growing tool on CT, taking less than 1 min per scan.
The auto-segmented MLV for each scan corresponded well with visual assessment of the PET scans. No false positive segmentation was noted on control scans. In the PTB lung scans, all auto-segmented MLVs corresponded to areas that appeared FDG avid. No visually FDG-avid lesions were missed by auto-segmentation.
FDG-avid lesions were also segmented using T40%. However, when max lesion SUV decreased during treat-ment, the MLVs became progressively more inclusive and did not correspond well to visual assessment. As such, we abandoned T40% as a method to monitor treat-ment response in a whole lung VOI.
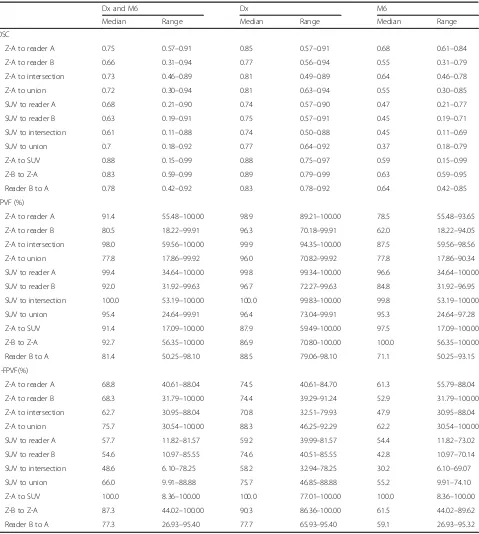
Table 2 shows a summary of DSC values (Table 2), true positive volume fraction (TPVF; Table 2), 1-false positive volume fraction (1-FPVF; Table 2), between readers and automated thresholds at Dx, M6 and com-bined. Individual segments corresponded better at Dx
than M6, independent of which segmentation method used. DSC between manual and Z-score segmentations (Z-A to reader A and Z-A to reader B) was slightly lower than between the manual readers (reader B to reader A), but higher than DSC between manual and SUV > 1
segmentations. The same trends were noted in regard to 1-FPVF(%) values. In contrast, SUV > 1 segments per-formed better in regard to TPVF comparison than either Z-score or manual segmentation. The same behaviour was also observed when comparing to either unions or Table 2Summary of comparisons between independent readers, reader A and reader B, and automated thresholding
segmentations using theZ-score (Z-A and Z-B) and SUV > 1 (SUV). Values for dice similarity coefficient (DSC), true positive volume fraction (TPVF) and 1 minus false positive volume fraction (1-FPVF) are shown
Dx and M6 Dx M6
Median Range Median Range Median Range
DSC
Z-A to reader A 0.75 0.57–0.91 0.85 0.57–0.91 0.68 0.61–0.84
Z-A to reader B 0.66 0.31–0.94 0.77 0.56–0.94 0.55 0.31–0.79
Z-A to intersection 0.73 0.46–0.89 0.81 0.49–0.89 0.64 0.46–0.78
Z-A to union 0.72 0.30–0.94 0.81 0.63–0.94 0.55 0.30–0.85
SUV to reader A 0.68 0.21–0.90 0.74 0.57–0.90 0.47 0.21–0.77
SUV to reader B 0.63 0.19–0.91 0.75 0.57–0.91 0.45 0.19–0.71
SUV to intersection 0.61 0.11–0.88 0.74 0.50–0.88 0.45 0.11–0.69
SUV to union 0.7 0.18–0.92 0.77 0.64–0.92 0.37 0.18–0.79
Z-A to SUV 0.88 0.15–0.99 0.88 0.75–0.97 0.59 0.15–0.99
Z-B to Z-A 0.83 0.59–0.99 0.89 0.79–0.99 0.63 0.59–0.95
Reader B to A 0.78 0.42–0.92 0.83 0.78–0.92 0.64 0.42–0.85
TPVF (%)
Z-A to reader A 91.4 55.48–100.00 98.9 89.21–100.00 78.5 55.48–93.65
Z-A to reader B 80.5 18.22–99.91 96.3 70.18–99.91 62.0 18.22–94.05
Z-A to intersection 98.0 59.56–100.00 99.9 94.35–100.00 87.5 59.56–98.56
Z-A to union 77.8 17.86–99.92 96.0 70.82–99.92 77.8 17.86–90.34
SUV to reader A 99.4 34.64–100.00 99.8 99.34–100.00 96.6 34.64–100.00
SUV to reader B 92.0 31.92–99.63 96.7 72.27–99.63 84.8 31.92–96.95
SUV to intersection 100.0 53.19–100.00 100.0 99.83–100.00 99.8 53.19–100.00
SUV to union 95.4 24.64–99.91 96.4 73.04–99.91 95.3 24.64–97.28
Z-A to SUV 91.4 17.09–100.00 87.9 59.49–100.00 97.5 17.09–100.00
Z-B to Z-A 92.7 56.35–100.00 86.9 70.80–100.00 100.0 56.35–100.00
Reader B to A 81.4 50.25–98.10 88.5 79.06–98.10 71.1 50.25–93.15
1-FPVF(%)
Z-A to reader A 68.8 40.61–88.04 74.5 40.61–84.70 61.3 55.79–88.04
Z-A to reader B 68.3 31.79–100.00 74.4 39.29–91.24 52.9 31.79–100.00
Z-A to intersection 62.7 30.95–88.04 70.8 32.51–79.93 47.9 30.95–88.04
Z-A to union 75.7 30.54–100.00 88.3 46.25–92.29 62.2 30.54–100.00
SUV to reader A 57.7 11.82–81.57 59.2 39.99–81.57 54.4 11.82–73.02
SUV to reader B 54.6 10.97–85.55 74.6 40.51–85.55 42.8 10.97–70.14
SUV to intersection 48.6 6.10–78.25 58.2 32.94–78.25 30.2 6.10–69.07
SUV to union 66.0 9.91–88.88 75.7 46.85–88.88 55.2 9.91–74.10
Z-A to SUV 100.0 8.36–100.00 100.0 77.01–100.00 100.0 8.36–100.00
Z-B to Z-A 87.3 44.02–100.00 90.3 86.36–100.00 61.5 44.02–89.62
the intersections. The DSC between MLV segmented using theZ-score and the MLV intersection between the readers was 0.73 (range 0.46–0.94), while the DSC be-tween the readers’ MLV union was 0.72 (range 0.3– 0.94). The median DSC between the MLV segmented using SUV > 1 and the readers’ segments intersection was 0.61 (range 0.11–0.88) and 0.7 (range 0.18–0.92) when compared to the union of the manual segments.
Inter-user Z-score segmentation (created by different spheres and lung mask) and inter-reader manual segmentation showed similar variability at single time-points, with a median DSC of 0.83 and 0.78 re-spectively (Table 2). However, there was a much better agreement in percentage change from diagnosis to M6 for inter-user Z-score segmentation than for manual inter-reader segmentation. The difference between the percentage change from Dx to M6 in MLV lesions volume ranged from −3.69 to 0.96 for inter-user Z-scores and −8.44 to 21.51 for inter-reader MLV change (Fig.5).
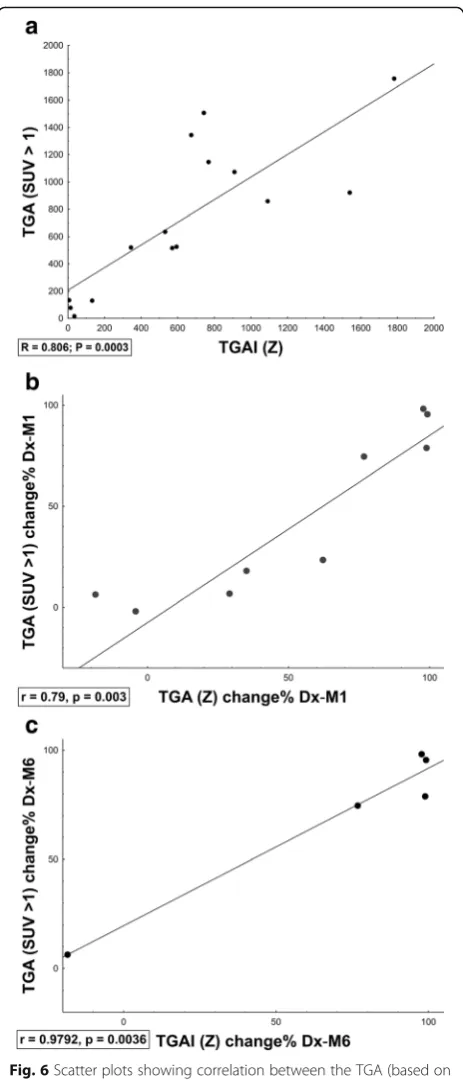
Z-score segmentation correlated well with SUV > 1 (me-dian DSC = 0.88). In addition, there was a high correlation between TGA (product of SUVmeanand MLV in SUV > 1)
and TGAI (product of mean lesion-to-background intensity and MLV inZ-score > 8) across time-points (Dx, M1, M6, Fig.6a), which improved when assessing change in inflam-matory burden over time (Fig.6b, c).
Response to therapy
Representative quantification patterns of scans from a control case and PTB patients before, during, and after treatment, with an overlay of the segmented MLV and a scatterplot representing the voxels from each scan, are shown in Fig. 7. The scatter plot of a control scan is shown in Fig. 7a. The cured patients’values (Fig. 7b, c) change toward normal at follow-up, while for the patient who failed treatment the pattern remains clearly abnor-mal on the density and intensity axes (Fig.7d).
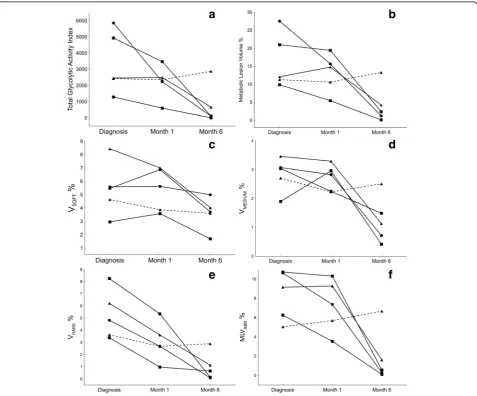
Figure 8 demonstrates the dynamics of different scan parameters during treatment of the five PTB cases, in relation to clinical outcome. The segmented TGAI (Fig. 8a) of three out of four cured cases already showed partial reduction (30–62%) at M1 and continued to de-crease markedly toward the end of treatment. The fourth cured patient showed a slight increase by M1, but sig-nificant reduction by M6. After 6 months of treatment, all the cured patients showed marked reduction (80– 99%), but only one patient showed nearly complete metabolic resolution. The patient that failed treatment remained unchanged over the first month and deterio-rated by M6. The MLV for this patient (Fig.8b) showed very similar patterns during treatment.
The combined lung volume with increased density (Vsoft + medium + hard) followed a similar trend, although
the decrease from Dx to M6 was less marked (41– 83%) than MLV changes and the failed treatment patient showed only slightly decreased values from Dx to M6. In the breakdown of lesions of different density (Fig.8c–e), all cured patients showed a marked volume decrease in hard lesions, already noted by M1 (35–71% reduction) and continued toward M6 (81–98% reduction). The vol-umes of medium and soft lesions were more variable, and a relatively large residual lesion volume was present at M6 for most cases.
After 1 month of treatment, in cured patients, MLVabn (Fig. 8f ) decreased modestly in two and
remained stable in the other two. The failed treat-ment case showed a 13% increase. At M6, however, all cured cases’ MLVabn had decreased markedly (82–
98%), while the failed treatment case showed a further increase.
Discussion
In this paper, we present a technique to reproducibly quan-tify pulmonary tuberculosis lesions on PET and CT. We used patient-specific reference volumes to reduce
intra-and interscan variability on PET intra-and auto-delineation to re-duce inter-reader and inter-user variability when assessing multiple widely distributed lesions with complex morph-ology. The technique quantifies lesions throughout the lungs in order to measure the central trend of disease progression or resolution, thus compensating for the vari-able response of individual lesions during PTB treatment.
The technique introduced some novel concepts in PET-CT analysis including the use of a patient-specific reference volume to standardise lung uptake (lesion-to--background), whole lung automated segmentation of CT lesions and bivariate quantification of PET and CT im-ages. It also reapplies concepts previously used in other settings, such as co-registration of corresponding scans at different time-points, whole organ (semi-)automated segmentation of PET uptake, and joint segmentation of PET and CT [23].
Optimal adaptive thresholds for auto-segmentation of PET scans were determined using a set of control lung scans and scans containing lesions with minimal to mildly increased uptake. Density thresholds for CT scans were de-termined using values previously reported in literature [41]. We compared the Z-score delineation to manual de-lineation by two independent readers and a fixed thresh-old previously used in a TB trial (SUV > 1) [41]. There was better correlation between the Z-score and manual segmentation when compared to the fixed threshold. We also found decreased inter-user variability when measuring response to treatment when compared to manual segmentation. However, there was still some inter-user variability at single time-points, which would not apply when using a fixed threshold (SUV > 1). Both automated thresholding techniques saved time and ap-peared highly sensitive. We also applied a gradient-based threshold (T40%); however, it did not appear to be ap-propriate to measure response to treatment in whole lung VOIs. After treatment, agreement between all thresholding techniques and readers were lower than previous reports only focussing on diagnosis [6]. How-ever, this was expected in highly complex lesions at the very edge of FDG avidity, found after treatment.
There was good correlation between TGA (based on mean SUV and volume) and TGAI (normalised to back-ground lung activity), especially when measuring changes over time.
We tested whether the technique was accurate enough to measure changes over time, by applying it to inde-pendent pilot sets of control cases and PTB cases during treatment. The quantified variables detected marked changes within 1 month of treatment. The metrics cor-responded well with visual scan interpretation, clinical outcomes and the qualitative classification allocated dur-ing analysis for the parent study. It also provided a range of additional information.
Some challenges and potential drawbacks were encoun-tered during this pilot application. While using the 3D region-growing tool in MRIcro was user friendly and eas-ily reproducible, some manual input was required when drawing the lung mask, to include dense lesions extending into the chest wall, and areas of motion misregistration. In the future, computer-assisted drawing tools or fully
automated lung atlas segmentation and correction of mis-registration should decrease inter-user variability and time requirements of any automated technique.
Co-registering baseline and follow-up scans allowed the user to generate a single-lung mask and reference volume to use across all time points. This reduced inter-scan variability and saved time. It did not, however, allow
(See figure on previous page.)
Fig. 7This shows coronal (left), sagittal (middle) and transverse (right) views of different CT images with the auto-delineated metabolic lesion volume as an overlay and a scatterplot representing the CT density (Yaxis, HU) and the PET uptake intensity (Xaxis;Z-score) of the voxels held within the lung maskaLesion-free lungs from control participant.b–dDx, M1 and M6 PET-CT scans for PTB patients.bCured patient with an improved scan response and moderate uptake still present at M6.cCured patient, with a resolved scan response. Only minimal intensity residual lesions and thin-walled cavities still present at M6.dFailed treatment case, with a mixed scan response pattern and multiple lesions with very high uptake present at M6
Fig. 8These graphs represent the case-profiles of five different PTB patients and the changes of various auto-segmented PET-CT parameters at Dx, M1 and M6 (Xaxis). A straight line represents a cured outcome and the broken line indicates treatment failure.aTotal glycolytic activity index. bMetabolic lesion volume as a percentage of total lung volume.cVsoft(−500 HU:−300 HU) CT lesion volume as a percentage of total lung volume.
dVmedium(−300 HU:−100 HU) CT lesion volume as a percentage of total lung volume.eVhard(>−100 HU) CT lesion volume as a percentage of total
for the measurement of changes in total lung volume over time, which may occur after lesion resolution with associated fibrosis. Re-slicing allowed direct voxel com-parison of PET and CT components using a single VOI. A disadvantage is that there was a smoothing effect on the CT images. Using a density threshold was not specific enough to delineate cavity volume, and an add-itional manual step was required to perform this function.
Using the mean and standard deviation of reference volumes to standardise lesion-to-background activity should decrease interscan and inter-patient variability compared to techniques that normalise the uptake to reference volumes from other organs or a theoretical whole body concentration. Thus, the Z-score takes into account the variability of FDG uptake in normal lung tissue and does not depend on dose or weight. The advantage of the latter is that changes in weight induce changes in SUV, while not necessarily inducing a change in FDG uptake.
Semi-automatic delineation of the whole lung allowed for segmentation of multiple lesions with widespread distribution and variable intensity, size and morphology. This shows promise to reduce inter-reader variability, especially in a self-controlled study measuring changes after interventions.
Conclusions
This technique to auto-segment and quantify multi-focal and complex lung lesions on PET and CT images shows great promise in a pilot set of subjects and required limited operator input. This study was only a small pilot study as proof-of-concept. Valid-ation in a larger cohort, and comparison of scan met-rics to clinical outcomes and biomarkers is required to determine indicators of prognosis and cure. Ultim-ately this methodology, or features thereof, could be incorporated into standard clinical analysis pipelines and research protocols.
Abbreviations
CT:Computed tomography; Dx: Diagnosis; HU: Hounsfield units; M1: Month 1; M6: Month 6; MLV: Metabolic lesion volume with high density (>−500 HU); MLVabn: Metabolic lesion volume with high density (>−500 HU) and
high intensity (> Z-score 8); NL: Normal lung parenchyma; PET: Positron emission tomography; PTB: Pulmonary tuberculosis; TGA: Total glycolytic activity (SUVmean× lesion volume); TGAI: Total glycolytic activity index (mean
lesion-to-background × lesion volume); TLV: Total lung volume;Vhard: Hard
lesion volume (>−100 HU);Vlow: Hypodense lesion volume (>−950 HU);
Vmedium: Medium lesion volume (−300 HU to−100 HU); VOI: Volume of
interest;Vsoft: Soft lesion volume (−500 HU to−300 HU);Z: Z-score/
standardised score;Zmean: Mean standardised intensity
Acknowledgements
We thank our participants for their willingness to take part in this study. Further, we acknowledge the staff at the Stellenbosch University Immunology Research Group, the Western Cape Academic PET-CT Centre, Ithemba LABS, and Tygerberg Academic Hospital’s Nuclear Medicine
Department and Pulmonology Unit, as well as the managers and health care providers from the City of Cape Town Health Department.
The Catalysis Biomarker Consortium: Stephanus T. Malherbe1,2, Patrick
Dupont3,4, Ilse Kant4, Katharina Ronacher1,2, Magdalena Kriel1,2, André G. Loxton1,2, Ray Y. Chen5, Laura E. Via5,6, Friedrich Thienemann6,7, Robert J.
Wilkinson6,7,8,9, Clifton E. Barry III1,2,5,6, Stephanie Griffith- Richards10, Annare
Ellman4, Jill Winter11, Gerhard Walzl1,2, Nelita Du Plessis1,2, Caroline G.G.
Beltran1,2, Lani Thiart1,2, Gerard Tromp1,2, Lance A. Lucas1,2, Bronwyn Smith1,2, Kim Stanley1,2, David Alland12, Shubhada Shenai12, Lori E. Dodd13, and James
M. Warwick4 .
1. Department of Science and Technology/National Research Foundation Centre of Excellence for Biomedical Tuberculosis Research and South African Medical Research Council Centre for Tuberculosis Research.
2. Division of Molecular Biology and Human Genetics, Faculty of Medicine and Health Sciences, Stellenbosch University, Cape Town, South Africa.
3. Laboratory for Cognitive Neurology, Department of Neurosciences, KU Leuven, Belgium.
4. Division of Nuclear Medicine, Department of Medical Imaging and Clinical Oncology, Faculty of Medicine and Health Sciences, Stellenbosch University, Cape Town, South Africa.
5. Tuberculosis Research Section, Laboratory of Clinical Infectious Diseases, Division of Intramural Research, National Institute of Allergy and Infectious Diseases, National Institutes of Health, Bethesda, MD, USA.
6. Wellcom Centre for Infectious Diseases Research in Africa, Institute of Infectious Disease and Molecular Medicine, Faculty of Health Science, University of Cape Town, Observatory 7925, Republic of South Africa
7. Department of Medicine, Groote Schuur Hospital, Faculty of Health Science, University of Cape Town, Cape Town, South Africa. 8. The Francis Crick Institute, Midland Road, London NW1 2AT, UK 9. Department of Medicine, Imperial College London W2 1PG, UK 10. Division of Radiodiagnosis, Department of Medical Imaging and
Clinical Oncology, Faculty of Medicine and Health Sciences, Stellenbosch University, Cape Town, South Africa. 11. Catalysis Foundation for Health, Emeryville, CA, USA.
12. Center for Emerging Pathogens, Department of Medicine, Rutgers-New Jersey Medical School, Rutgers Biomedical and Health Sci-ences, Newark, NJ, USA.
13. Biostatistics Research Branch, National Institute of Allergy and Infectious Diseases, National Institutes of Health Bethesda, Maryland, USA.
Funding
Funding was provided by the Catalysis Foundation for Health, the Division of Intramural Research, National Institute of Allergy and Infectious Diseases, the South African National Research Fund and the South African Medical Research Council’s Clinician Scholarship Program, as well as the National Institute of Allergy and Infectious Diseases, International Collaborations in Infectious Disease Research. RJW is supported by the Francis Crick Institute, which receives its core funding from Cancer Research UK (FC00110218), the UK Medical Research Council (FC00110218) and the Wellcome Trust (FC00110218). He also receives support from the Wellcome Trust (104803 and 203135) and the South African MRC Strategic Health Innovations Partnership. STM receives funding from the EDCTP2 programme supported by the European Union (grant number CDF1576). The views and opinions of the authors expressed herein do not necessarily state or reflect those of the EDCTP.
Availability of data and materials
Datasets would be made available on request to the author.
Authors’contributions
involved in study design, patient recruitment and edited the manuscript. PA, AE and SG-R performed the visual scan analysis and edited the manuscript. All authors reviewed and agreed to the manuscript content.
Ethics approval and consent to participate
Ethical approval was obtained for all study-related activities from the Stellenbosch University Human Research Ethics Committee (reference numbers N10/01/013 and N14/10/155). All participants signed the informed consent.
Consent for publication
This manuscript does not contain any personal sensitive data and is therefore not applicable.
Competing interests
The authors declare that they have no competing interests.
Author details 1
DDST-NRF Centre of Excellence for Biomedical Tuberculosis Research and South African Medical Research Council Centre for Tuberculosis Research, Cape Town, South Africa.2Division of Molecular Biology and Human Genetics, Faculty of Medicine and Health Sciences, Stellenbosch University, Cape Town, South Africa.3Department of Neurosciences, Laboratory for Cognitive Neurology, KU Leuven, Belgium.4Division of Nuclear Medicine, Department of Medical Imaging and Clinical Oncology, Faculty of Medicine and Health Sciences, Stellenbosch University, Cape Town, South Africa. 5
Tuberculosis Research Section, Laboratory of Clinical Infectious Diseases, Division of Intramural Research, National Institute of Allergy and Infectious Diseases, National Institutes of Health, Bethesda, MD, USA.6Wellcome Centre for Infectious Disease Research in Africa, Institute of Infectious Disease and Molecular Medicine, Faculty of Health Science, University of Cape Town, Observatory 7925, Republic of South Africa.7Department of Medicine, Faculty of Health Science, Groote Schuur Hospital, University of Cape Town, Cape Town, South Africa.8The Francis Crick Institute, Midland Road, London NW1 2AT, UK.9Department of Medicine, Imperial College London, London W2 1PG, UK.10Division of Radiodiagnosis, Department of Medical Imaging and Clinical Oncology, Faculty of Medicine and Health Sciences, Stellenbosch University, Cape Town, South Africa.11Translational Research Institute, Mater Research Institute–The University of Queensland, Brisbane, QLD, Australia. 12Catalysis Foundation for Health, Emeryville, CA, USA.
Received: 5 April 2018 Accepted: 8 June 2018
References
1. Maldonado A, González-Alenda FJ, Alonso M, Sierra JM. PET-CT in clinical oncology. Clin Transl Oncol. 2007;9(8):494–505.
2. Hess S, Hansson SH, Pedersen KT, Basu S, Høilund-Carlsen PF. FDG-PET/CT in infectious and inflammatory diseases. PET Clin. 2014;9(4):497–519. 3. Cheebsumon P, van Velden FHP, Yaqub M, Frings V, de Langen AJ, Hoekstra
OS, et al. Effects of image characteristics on performance of tumor delineation methods: a test-retest assessment. J Nucl Med. 2011;52(10):1550–8. 4. Huang W, Zhou T, Ma L, Sun H, Gong H, Wang J, et al. Standard uptake
value and metabolic tumor volume of18F-FDG PET/CT predict short-term
outcome early in the course of chemoradiotherapy in advanced non-small cell lung cancer. Eur J Nucl Med Mol Imaging. 2011;38(9):1628–35. 5. Dibble EH, Alvarez ACL, Truong M-T, Mercier G, Cook EF, Subramaniam RM.
18F-FDG metabolic tumor volume and total glycolytic activity of oral cavity and oropharyngeal squamous cell cancer: adding value to clinical staging. J Nucl Med. 2012;53(5):709–15.
6. Foster B, Bagci U, Mansoor A, Xu Z, Mollura DJ. A review on segmentation of positron emission tomography images. Comput Biol Med. 2014;50:76–96. 7. Fletcher JW. PET/CT standardized uptake values (SUVs) in clinical practice
assessing response to therapy. Semin Ultrasouns CT MRI. 2010;31(6):496–505. 8. Lowe VJ, Hoffman JM, DeLong DM, Patz EF, Coleman RE. Semiquantitative and visual analysis of FDG-PET images in pulmonary abnormalities. J Nucl Med. 1994;35(11):1771–6.
9. Hatt M, Cheze-Le Rest C, Aboagye EO, Kenny LM, Rosso L, Turkheimer FE, et al. Reproducibility of 18F-FDG and 3′-deoxy-3′-18F-fluorothymidine PET tumor volume measurements. J Nucl Med. 2010;51(9):1368–76.
10. Boellaard R, O’Doherty MJ, Weber WA, Mottaghy FM, Lonsdale MN, Stroobants SG, et al. FDG PET and PET/CT: EANM procedure guidelines for tumour PET imaging: version 1.0. Eur J Nucl Med Mol Imaging. 2010;37(1):181–200. 11. Fogh SE, Bs JK, Bs AF, Intenzo C, Axelrod R, Mccue P, et al. Pathological
correlation of PET/CT based auto contouring for radiation planning of lung cancer. Bodine J. 2010;78(3):202–3.
12. Dann EJ, Bar-Shalom R, Tamir A, Epelbaum R, Avivi I, Ben-Shachar M, et al. A functional dynamic scoring model to elucidate the significance of post-induction interim fluorine-18-fluorodeoxyglucose positron emission tomography findings in patients with Hodgkin’s lymphoma. Haematologica. 2010;95:1198–206. 13. Delbeke D, Stroobants S, de Kerviler E, Gisselbrecht C, Meignan M, Conti PS.
Expert opinions on positron emission tomography and computed tomography imaging in lymphoma. Oncologist. 2009;14(Suppl 2):30–40. 14. Firouzian A, Kelly MD, Declerck JM. Insight on automated lesion delineation
methods for PET data. EJNMMI Res. 2014;4(1):1–12.
15. Boellaard R, Krak NC, Hoekstra OS, Lammertsma AA. Effects of noise, image resolution, and ROI definition on the accuracy of standard uptake values: a simulation study. J Nucl Med. 2004;45(9):1519–27.
16. Chien D, Lodge M, Wahl R. Reproducibility of liver and mediastinal blood pool F-18 activity as normal reference tissues. J Nucl Med. 2011;52:536. abstract 17. Higashi K, Ito K, Hiramatsu Y, Ishikawa T, Sakuma T, Matsunari I, et al.
18F-FDG uptake by primary tumor as a predictor of intratumoral lymphatic vessel invasion and lymph node involvement in non-small cell lung cancer: analysis of a multicenter study. J Nucl Med. 2005;46(2):267–73.
18. Barrington SF, Qian W, Somer EJ, Franceschetto A, Bagni B, Brun E, et al. Concordance between four European centres of PET reporting criteria designed for use in multicentre trials in Hodgkin lymphoma. Eur J Nucl Med Mol Imaging. 2010;37(10):1824–33.
19. Chong D, Brown MS, Kim HJ, van Rikxoort EM, Guzman L, McNitt-Gray MF, et al. Reproducibility of volume and densitometric measures of emphysema on repeat computed tomography with an interval of 1 week. Eur Radiol. 2012;22(2):287–94.
20. Colombi D, Dinkel J, Weinheimer O, Obermayer B, Buzan T, Nabers D, et al. Visual vs fully automatic histogram-based assessment of idiopathic pulmonary fibrosis (IPF) progression using sequential multidetector computed tomography (MDCT). PLoS One. 2015;10(6):e0130653. 21. Karimi R, Tornling G, Forsslund H. Lung density on high resolution
computer tomography (HRCT) reflects degree of inflammation in smokers. Respir Res. 2014;15(23):1–10.
22. Shin KE, Chung MJ, Jung MP, Choe BK, Lee KS. Quantitative computed tomographic indexes in diffuse interstitial lung disease: correlation with physiologic tests and computed tomography visual scores. J Comput Assist Tomogr. 2011;35(2):266–71.
23. Bagci U, Udupa JK, Mendhiratta N, Foster B, Xu Z, Yao J, Chen X, Mollura DJ. Joint segmentation of anatomical and functional images: applications in quantification of lesions from PET, PET-CT, MRI-PET, and MRI-PET-CT images. Med Image Anal. 2013;17(8):929–45.
24. Hu Y, Mangan JA, Dhillon J, Sole KM, Mitchison DA, Butcher PD, et al. Detection of mRNA transcripts and active transcription in persistent Mycobacterium tuberculosis induced by exposure to rifampin or pyrazinamide. J Bacteriol. 2000;182(22):6358–65.
25. Boshoff HI, Barry CE 3rd. Tuberculosis—metabolism and respiration in the absence of growth. Nat Rev Microbiol. 2005;3(1):70–80.
26. Mitchison DA. Basic mechanisms of chemotherapy. Chest. 1979;76(6):771–6, 778–81.
27. Johnson DH, Via LE, Kim P, Laddy D, Lau CY, Weinstein EA, et al. Nuclear imaging: a powerful novel approach for tuberculosis. Nucl Med Biol. 2014; 41(10):777–84.
28. Chen RY, Via LE, Dodd LE, Walzl G, Malherbe ST, Loxton AG, et al. Using biomarkers to predict TB treatment duration (predict TB): a prospective, randomized, noninferiority, treatment shortening clinical trial. Gates Open Res. 2017;1:9. 29. Sathekge MM, Ankrah AO, Lawal I, Vorster M. Monitoring response to
therapy. Semin Nucl Med. 2018;48(2):166–81.
30. Lin PL, Coleman T, Carney JPJ, Lopresti BJ, Tomko J, Fillmore D, et al. Radiologic responses in cynomolgous macaques for assessing tuberculosis chemotherapy regimens. Antimicrob Agents Chemother. 2013;57(9):4237–44. 31. Chen RY, Dodd LE, Lee M, Paripati P, D a H, Mountz JM, et al. PET/CT
imaging reveals a therapeutic response to oxazolidinones in macaques and humans with tuberculosis. Sci Transl Med. 2014;6(265):265ra167.
using [18F]2-fluoro-deoxy-D-glucose positron emission tomography and
computed tomography. Antimicrob Agents Chemother. 2012;56(8):4391–402. 33. Lin PL, Ford CB, Coleman MT, Myers AJ, Ioerger T, Sacchettini J, et al.
Sterilization of granulomas is common in both active and latent tuberculosis despite extensive within-host variability in bacterial killing. Nat Med. 2014;20(1):75–9.
34. Davis SL, Nuermberger EL, Um PK, Vidal C, Jedynak B, Pomper MG, et al. Noninvasive pulmonary [18F]-2-fluoro-deoxy-D-glucose positron emission tomography correlates with bactericidal activity of tuberculosis drug treatment. Antimicrob Agents Chemother. 2009;53(11):4879–84. 35. Mattila JT, Beaino W, Maiello P, Coleman MT, White AG, Scanga CA, et al.
Positron emission tomography imaging of macaques with tuberculosis identifies temporal changes in granuloma glucose metabolism and integrin α4β1-expressing immune cells. J Immunol. 2017;199(2):806–15.
36. Martinez V, Castilla-Lievre MA, Guillet-Caruba C, Grenier G, Fior R, Desarnaud S, et al. (18)F-FDG PET/CT in tuberculosis: an early non-invasive marker of therapeutic response. Int J Tuberc Lung Dis. 2012;16(9):1180–5. 37. Dureja S, Sen I, Acharya S. Potential role of F18 FDG PET-CT as an imaging
biomarker for the noninvasive evaluation in uncomplicated skeletal tuberculosis: a prospective clinical observational. Eur Spine J. 2014;23(11):2449–54. 38. Demura Y, Tsuchida T, Uesaka D, Umeda Y, Morikawa M, Ameshima S, et al.
Usefulness of (18)F-fluorodeoxyglucose positron emission tomography for diagnosing disease activity and monitoring therapeutic response in patients with pulmonary mycobacteriosis. Eur J Nucl Med Mol Imaging. 2009;36(4):632–9. 39. Sathekge M, Maes A, Kgomo M, Stoltz A, Van de Wiele C. Use of 18F-FDG
PET to predict response to first-line tuberculostatics in HIV-associated tuberculosis. J Nucl Med. 2011;52(6):880–5.
40. Jehanno N, Cassou-Mounat T, Vincent-Salomon A, Luporsi M, Bedoui M, Kuhnowski F. PET/CT imaging in management of concomitant Hodgkin lymphoma and tuberculosis—a problem solver tool. Clin Case Reports. 2018;6(1):232–4.
41. Chen RY, Dodd LE, Lee M, Paripati P, Hammoud DA, Mountz JM, et al. PET/ CT imaging correlates with treatment outcome in patients with multidrug-resistant tuberculosis. Sci Transl Med. 2014;6(265):265ra166.
42. Malherbe ST, Shenai S, Ronacher K, Loxton AG, Dolganov G, Kriel M, et al. Persisting positron emission tomography lesion activity and Mycobacterium tuberculosis mRNA after tuberculosis cure. Nat Med. 2016;22(10):1094–100. 43. Foster* B, Bagci U, Xu Z, Dey B, Luna B, Bishai WR, et al. Segmentation of
PET images for computer aided functional quantification of tuberculosis in small animal models. IEEE Trans Biomed Eng. 2014;61(3):711–24. 44. Bagci U, Foster B, Miller-Jaster K, Luna B, Dey B, Bishai WR, et al. A
computational pipeline for quantification of pulmonary infections in small animal models using serial PET-CT imaging. EJNMMI Res. 2013;3(1):1–41. 45. Boellaard R, Delgado-Bolton R, Oyen WJG, Giammarile F, Tatsch K, Eschner
W, et al. FDG PET / CT : EANM procedure guidelines for tumour imaging: version 2. 0. Eur J Nucl Med Mol Imaging. 2015;42:328–54.
46. Larobina M, Murino L. Medical image file formats. J Digit Imaging. 2014; 27(2):200–6.
47. Lewis Center for Neuroimaging. MRIConvert and mcverter [Internet]. Available from: https://lcni.uoregon.edu/downloads/mriconvert/mriconvert-and-mcverter
48. Welcome Trust Centre for Neuroimaging. Statistical Parametric Mapping [Internet]. Available from:http://www.fil.ion.ucl.ac.uk/spm/
49. Chris Rorden. MRIcro [Internet]. p.http://people.cas.sc.edu/rorden/mricro/index. html. Available from:http://people.cas.sc.edu/rorden/mricro/index.html 50. Rasband W. ImageJ. :http://imagej.net.
51. Dice L. Measures of the amount of ecologic association between species. Ecology. 1945;26:297–302.
![Fig. 3 The range, median and 25th and 75th percentiles for percentage of total lung volume classified as FDG avid at different Z-score thresholds[4–9], in the quantification of PET-CT scans from 15 controls with visually lesion-free lungs](https://thumb-us.123doks.com/thumbv2/123dok_us/9624097.1944574/5.595.61.538.86.306/percentiles-percentage-classified-different-thresholds-quantification-controls-visually.webp)