Telephone: +44 (0)1582 763133 Web: http://www.rothamsted.ac.uk/
Rothamsted Research is a Company Limited by Guarantee Registered Office: as above. Registered in England No. 2393175.
Rothamsted Repository Download
A - Papers appearing in refereed journals
Sohi, S. P., Yates, H. C. and Gaunt, J. L. 2010. Testing a practical
indicator for changing soil organic matter. Soil Use and Management. 26
(2), pp. 108-117.
The publisher's version can be accessed at:
•
https://dx.doi.org/10.1111/j.1475-2743.2010.00261.x
The output can be accessed at:
https://repository.rothamsted.ac.uk/item/8q603/testing-a-practical-indicator-for-changing-soil-organic-matter
.
© 18 May 2010, Wiley.
Testing a practical indicator for changing soil organic
matter
S . P . S o h i1 , 2 , 3, H . C . Ya t e s1 & J . L . Ga u n t2
1Department of Soil Science, Rothamsted Research, Harpenden, Herts, AL5 2JQ, UK,2KeySoil Ltd., 32 Amenbury Lane,
Harpenden, Herts, UK, and3School of GeoSciences, University of Edinburgh, West Mains Road, Edinburgh, EH9 3JN, UK
Abstract
Long-term changes in soil organic carbon (SOC) resulting from management change are documented for many experimental situations, and corresponding trends in the field have been observed by national survey. Since these changes are relevant to atmospheric carbon balance a practical measure to confirm the impact of recent management decisions at any location, without resorting to repeated sampling, is highly attractive but none has previously been tested. This study assessed intra-aggregate C to fulfil the role, based on a temporary deviation from its predictable contribution to total SOC under stable management. A total of 166 surface soil samples (0–15 cm) were analyzed for intra-aggregate C using an established physical fractionation protocol or compatible scaled-up procedure. Soils were arable (or ley-arable) managed by conventional or minimum-tillage, or permanent grassland, and assigned ‘stable’ or ‘changing’ status on the basis of a verbal account of management history. Log-normal populations of intra-aggregate C were compared for soils of stable and changing status using F-tests. Intra-aggregate C shows promise as an indicator of changing SOC in arable soils up to 30% clay content, particularly soils <20% clay. A larger dataset is required to establish its utility in grassland soils. It is not certain that intra-aggregate C is capable of confirming direction of change or trajectory (endpoint), and functions to indicate change, rather than confirm stable status. Supplementary information on the history of soil use and management is therefore essential in the interpretation of such measurements.
Keywords:Soil carbon, soil organic matter, management, indicator, fractions
Introduction
Management of organic matter can enhance the physical, chemical and biological properties of soil, and thus benefit the agricultural enterprise. A particular soil can sustain a range of organic matter contents, depending on the balance between organic matter input from crop roots, litter and post-harvest residues, and their decomposition, controlled initially by soil clay content and climate but also affected by factors such as disturbance during tillage. Farm level decision-making can therefore considerably influence soil organic matter content at a particular location. Also, although these levels tend to be lower than would occur under natural vegetation, it remains a significant store of carbon (C) originating from atmospheric CO2, and one that
can be deliberately managed and potentially enhanced, with important implications for the mitigation or exacerbation of climate change.
Soil organic matter was identified as a headline indicator in the UK Government’s Sustainable Food and Farming Strategy (Defra, 2002). To assess progress toward halting the decline in vulnerable soils by 2025, and its maintenance elsewhere, monitoring is required. In England and Wales, determinations of soil organic carbon (SOC) have been made under national sampling for the National Soils Inventory (NSI). This intensive sampling was first undertaken 1978–1983 based on a 5 km grid, and repeated at 40% of sites 1994–1996, and at a smaller sub-set during 2003 (Verheijenet al., 2005). These data indicate a negative SOC trajectory at 92% of the re-sampled locations. The mean rate of C loss was greater at sites displaying initially higher levels of C, and for arable and permanent grass sites than non-agricultural soils (Bellamy
et al., 2005).
The findings demonstrated that changes in SOC observed over decades in experimental situations, can also be detected over a similar period under prevailing management practices in field soils. Also, the ranges of loss rate were generally large relative to the mean. This must in part reflect the diversity of management practices that exist in agriculture, some of which
Correspondence: S. P. Sohi. E-mail: [email protected] Received June 2009; accepted after revision January 2010
Soil Use and Management, June 2010,26,108–117 doi: 10.1111/j.1475-2743.2010.00261.x
108 ª2010 The Authors. Journal compilationª2010 British Society of Soil Science
SoilUse
increase SOC, but more decrease it. Whilst showing that the impact of management can be established by direct monitoring, the timescale of that monitoring is incompatible with providing site-specific guidance.
An indicator that, without resorting to repeated measurement, can determine whether a particular soil is changing in SOC is highly attractive. Such an indicator is likely to comprise a fraction of total SOC or its decomposer organisms whose status is consistent for any soil under stable management, but which reliably and quite rapidly alters after a change in the management of that soil. In general terms, various SOC indicators have been proposed: fractions defined by their chemical oxidizability (Blairet al., 1995), solubility in hot water (Ko¨rschens et al., 1998) or various chemical extractants (e.g. Olk et al., 1996), position within the soil matrix and aggregates (Golchinet al., 1994; Sixet al., 2000), or the biomass of the soil microbial population (Powlson
et al., 1987). The sensitivity of suitable indicators for the current purpose should extend beyond inputs of C, which might be outwardly apparent, to rates of decomposition for C already in the soil. Intensive tillage, for example, facilitates decomposition of SOC, and rates of loss may be retarded under reduced cultivation.
Within a certain climatic range the utility of an indicator can be assessed with reference to (1) initial SOC level, (2) the magnitude of management intervention, (3) time since change and (4) soil texture. It is also important that the sensitivity is not so great as to pick up seasonal fluctuations, which would limit practicability of use. Finally, the measurement must be robust to spatial heterogeneity, and any effect of transit between sampling and laboratory, and achievable at a realistic cost.
The soil fractionation method of Sohi et al. (2001) completely and sequentially divides soil into physically defined sub-units by density separation. The scheme distinguishes intra-aggregate C from its free counterpart; both are light fractions, the latter isolated prior to breakdown of stable soil aggregates releasing intra-aggregate material. Detailed chemical characterization of the intra-aggregate fraction (Sohiet al., 2001, 2005; Poirieret al., 2005) has shown it to provide both substrates for, and products of, microbial decomposition, and to be functionally distinct from both fresher and more heavily decomposed soil fractions.
In this paper intra-aggregate C is assessed as a practical indicator according to its ability to distinguish field soils assigned ‘stable’ versus ‘changing’ SOC status, on the basis of a brief management history.
Materials and methods
Intra-aggregate C was determined for 18 soils at experimental sites across England (first tranche), and for three sets of English field soils where associated management information was obtained. The latter comprised a set of distributed arable
sites (second tranche), and arable and grassland soils in ten specific catchments targeted (third tranche) or randomly selected (fourth tranche) for their soil organic matter management strategies.
Soils
The experimental fields sampled in the first tranche had been under consistent, documented arable use for at least 30 years on light to medium textured soils. The sites were Rothamsted and Brooms Barn (Rothamsted Research), and Gleadthorpe and Rosemaund (ADAS). At the same locations it was possible to identify three soils that had been subject to a recent and equally controlled change in organic matter management, including one example of transition from a short-term grass ley. These collectively represent a first tranche of samples that were fractionated according to the published method of Sohiet al.(2001), using small replicated samples and dispersion using ultrasonic probes. Carbon in the intra-aggregate fraction was determined by analysis of combined filter-fraction material with an elemental analyzer linked to a mass spectrometer (Europa, Integra CN).
The second tranche of sampling was undertaken on fields under continuous arable use, randomly selected from sites visited in the 1990s re-sampling of the UK National Soils Inventory (NSI). Soil sampling was undertaken in conjunction with socio-economic evaluation of soil organic matter management (Verheijen, 2005), so each soil sample was accompanied by a verbal account of its management history from the land manager. From this the status of key variables was determined: clay content, magnitude of change and years since change. These ‘second tranche’ soils were processed using a scaled-up version of the fractionation method, and C content of the intra-aggregate fraction–filter mix determined as per first tranche samples.
loss-on-ignition method was developed for estimating intra-aggregate fraction C content, calibrated against the second tranche approach of mass spectrometry. Samples in the third tranche comprised mainly light- and medium-textured soils.
The final fourth tranche samples were obtained during 2007. These were taken from participating, randomly contacted enterprises within seven of the third-tranche catchments listed above. At each site, the sampled field was one where a recent or imminent change in organic matter management was identified. A large proportion of these samples represented permanent grassland, and included some soils of heavy texture.
Soil sampling
Soils were sampled to a depth of 15 cm using a gouge auger of 25 mm diameter. Bulked samples in the field were obtained in the second tranche from 25 intersecting points on a 5·5 m grid. In the third and fourth tranche, nine auger samples were taken across the relevant field in a ‘W’ pattern and bulked. The first tranche samples from experimental fields were sampled in a ‘W’ across the relevant plot, or replicate plots where available. The within-season timing of the sampling was designed to encompass a range, such that short-term temporal effects of management on intra-aggregate C would be captured. Samples were transported to Rothamsted in cold boxes and stored at 4C prior to fractionation. Fractionated samples were pre-sieved at 2 mm or 6 mm, but all results expressed on 2 mm soil basis. Soils exceeding 15– 20% gravimetric moisture content were part-dried to within this range. For determination of total SOC, sub-samples were oven-dried at 40C and analyzed after processing to a fine powder in a disc or ball mill.
The NSI protocol dictated the shallow sampling depth, which was also consistent with the recommended method that guides fertilizer recommendations in grassland (MAFF, 2000). Since grassland and, to a lesser extent, min-till soils display stratification of organic matter toward the surface, soils undergoing transition to reduced cultivation or grass ley should display changing C status in the 0–15 cm layer.
Classification of soil C status
Soils were assigned to categories of ‘stable’ and ‘changing’ SOC according to detailed verbal information recorded concerning past management, according to a protocol illustrated diagrammatically in Figure 1. Soils where no major change in management had been imposed in a maximum timeframe of 7 years were assigned stable status. For soils of <15% clay content (light textured), ‘changing’ status was assigned if there had been a major change in organic matter management in the 5 years prior to sampling, or 2 years if the intervention was relatively minor. For soils of between 15% and 30% clay content (medium textured),
the corresponding limits were 5–7 years and 2–4 years; for heavy textured soils (>30% clay) 5–7 years and 3–4 years.
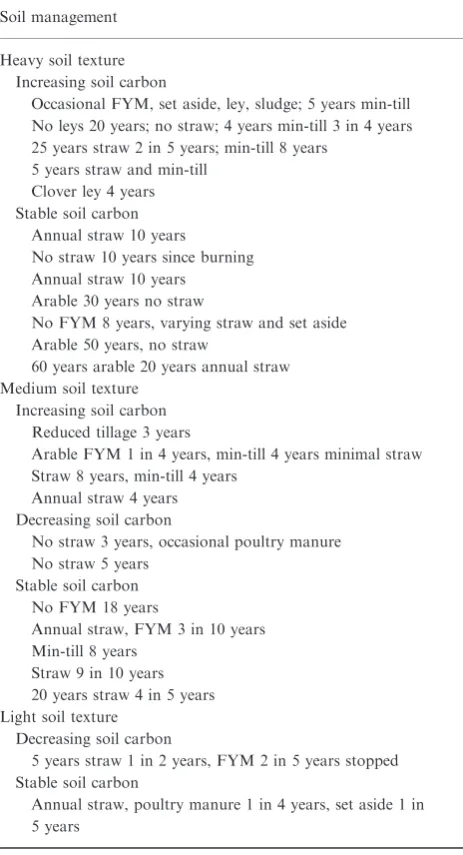
The sensitivity of intra-aggregate C to extent of management change was informed by fractionation of soil from various experimental plots at Rothamsted Research (see discussion of data in Figure 3), and illustrative interventions for each category are listed in Table 1. Differential time horizons for ‘stable’ and ‘changing’ status (with respect to soil texture) reflected turnover rates established intra-aggregate C through modelling soil fractionation data in soil incubation experiments (Sohi, 2001).
Given the relative recalcitrance of farmyard manure (FYM) in soil, if manure had been added only occasionally as part of an otherwise stable rotation, ‘stable’ status was not assigned if the last addition of FYM was within the past 5 years (Figure 1). Similar situations where other relevant changes had occurred were included as ‘changing’ unless manure had been applied in the current or previous season. The last caveat was not made for grassland soils where slurry was applied annually (Figure 1).
Soil physical fractionation
Samples from the first tranche were processed using the published method (Sohi et al., 2001): 3·15 g soil sub-samples were fractionated in separate 250 mL polycarbonate centrifuge bottles. This was repeated three times for replication and to establish measurement precision. Briefly, sodium iodide solution was prepared to a concentration with a specific gravity of 1.800 ± 0.005 g⁄cm3. To each bottle 90 mL solution was added, the suspension gently swirled manually for 30 s, and then centrifuged for 30 min at 9000g to sediment heavy material. Floating free organic matter was removed by suction and discarded prior to sonication of the re-suspended pellet in NaI solution (750 J⁄g soil), the solution re-added after filtration. The target intra-aggregate fraction was similarly removed after a second centrifugation, and isolated on a single glass fibre filter (Whatman GF⁄A). Sodium iodide filtrate was cleaned with activated charcoal and its density re-adjusted for re-use. The heavy fraction residue was discarded. Soil concentration of intra-aggregate C was calculated from the mass of the dry filter–fraction sample, its C content determined in triplicate by mass spectrometry, and original dry soil weight.
The above method was developed for detailed analysis of 15–45 g soil samples from replicated incubation experiments and is relatively laborious. For economic application to field soils, large bulked samples must be processed to address heterogeneity, and a low-cost technique to estimate the C content of the intra-aggregate soil fractions used. For second and subsequent samples large field samples of 180 g were processed using a method developed by KeySoil Ltd., with rapid estimation of intra-aggregate C content using a method based on loss-on-ignition. The consistency of results between 110 S. P. Sohiet al.
the published and proprietary fractionation approaches, showing equivalence of the respective dispersion methods was confirmed by processing three standard soils of contrasting clay content, used as internal standards for both methods. Consistency between determinations of intra-aggregate C made using the mass spectrometer and loss-on-ignition was assessed using a similar subset of 20 samples (R2= 0.94;P= 0.05).
Total soil organic C
The C content of whole soils was determined either by the Walkley-Black method (second tranche, NSI samples), mass spectrometry (first tranche samples; Europa ANCA 2020), or using a LECO analyzer (third and fourth tranche samples). None of the soils considered in the study were calcareous, so no attempt was made to correct for inorganic C content of the soils analyzed by combustion methods.
Soil clay content
Clay content was measured using 12 g sub-samples and sedimentation, after prior oxidation of organic matter with repeated 10 mL additions of 30% H2O2. Oxidized samples
were dispersed by shaking for 7 h with 10 mL of 0.5m
sodium metaphosphate and 150 mL water added, and then passed through a 63lm sieve to remove sand. Samples of clay were taken after the appropriate period of sedimentation in 1 L glass cylinders at constant temperature, at a depth determined by Stokes law (Tanner & Jackson, 1947). Pipette samples of 20 mL were dried and clay content extrapolated on the basis of sample volume and mass.
For the second tranche samples, clay measurements were made on the same samples using the NSI determination method using a laser-based particle size analyzer, with prior oxidation of organic matter and removal of coarse sand. The
Manure additions current/last
season?
Change > 5 yr ago?
YES
Clay content < 15%?
Changing Major change?
Change < 3 yr ago?
Stable
YES
Uncertain
Clay content < 15%?
Change within 2–7 yr?
Grassland?
YES Occasional manure addition made in past
five years?
NO
Change > 4 yr ago? NO
Clay content >15%? NO
YES NO
NO YES
YES NO
YES
NO
NO
NO
YES YES
NO YES
YES NO
Figure 1 Diagrammatic scheme used in
NSI and sedimentation measurements were correlated, and the NSI determinations were adjusted according to the regression equation in our statistical analyses.
Statistical analysis
The distribution of intra-aggregate C, expressed as a proportion of SOC, was assessed for normality and skew, and transformed using the log and logit Directives in the Genstat statistical software package (v10, VSN International Ltd, Oxford, UK). Statistical comparison of the distributions for stable and changing soil was made by variance ratio (Figure 2) and a two-tailed F probability calculation. To usefully separate the stable and changing categories, the two populations were sub-divided into three categories of land-use: (1) arable and ley-arable with conventional tillage, (2) arable with minimum tillage, and (3) permanent grassland. The datasets were further divided within each category according to sample clay content as a measure of soil texture.
Results
Evaluation in experimental fields
The first tranche samples from experimental fields displayed clay contents in the range 7–24%. This sample set included three locations where two neighbouring plots were under contrasting management and both were sampled. For three of these pairings the management contrast, which related to straw or fallow management, was imposed 17–30 years ago. Within each pair the divergence in SOC was similar, in proportional terms, to that of intra-aggregate C. This
indicates, over this timescale, that the proportion of SOC in the intra-aggregate fraction is consistent, and thus indicative of stable status (Figure 3). At a fourth site where management of paired arable fields diverged 2 years prior to sampling, with conversion of one to set-aside, no difference in SOC had yet emerged but a considerable deviation in intra-aggregate C as a proportion of SOC was evident (Figure 3). This observation supports the utility of intra-aggregate C as an indicator measurement, and suggests approximate limits for timeframe of its operation.
Categorization of field soils
The categorization of re-sampled NSI sites (all arable) is shown in Table 1, with a brief description of recent management history. Soils were deemed stable at 13 locations, and in 12 of the fields judged to be in transition after a relatively distinct and sustained change in soil management. In six cases this change related to the adoption of minimum or reduced tillage; three of the remaining six soils were in projected decline following a decrease in organic matter inputs. An additional seven fields did not have sufficient soil management information to assign a definitive status, either due to a novel management intervention or multiple overlapping and⁄or opposing management changes, and were not fractionated.
0.00 0.25 0.50 0.75 1.00 1.25 1.50
0 5 10 15 20
SOC (mg/g)
Indicator fraction (mgC/g)
Figure 3The separation of total soil organic C (SOC) and intra-aggregate (indicator) C for four paired plots at Rothamsted, Woburn and Rosemaund experimental farms, showing intra-aggregate C to be a greater proportion of total SOC where divergent land management has been imposed more recently. Like-symbol points reflect paired plots at contrasting equilibriums in intra-aggregate and total soil organic C (SOC); Highfield arable versus bare fallow soil at Rothamsted (r); Far Field ( ) and Great Knott ( ) arable high versus low rate of cereal straw incorporation, Woburn and Rothamsted, respectively. Open symbols show Rosemaund sites (Moorfields and Brushes), of which the former was converted to set aside 2 years prior to sampling.
Indicator fraction (% total SOC)
Probability, P
Changing SOC Stable SOC
Figure 2 Schematic for distinction between ‘populations’ of soils that are stable (dashed line) and changing (solid line) with respect to their organic matter status, and which differ in variance by a factor of four. Only soils for which x-axis values reflect zone ‘A’ can be ascribed ‘changing’ status; corresponding values in zone ‘B’ indicate status that is changing or stable.
112 S. P. Sohiet al.
The relatively small dataset from the second tranche sampling was combined with corresponding results from third and fourth tranche results, to establish the statistical distribution of intra-aggregate C (as a percentage of SOC) for stable and changing situations within land-use categories.
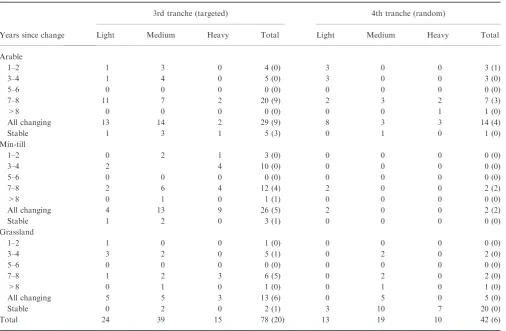
The third tranche sampling (Table 2) was directed toward enterprises where organic matter management had changed within ECSFDI. This yielded 78 soils of definable SOC status, 29 of which were minimum tillage, and 15 rotational or permanent grass. A total of 55 arable and 13 grassland soils were designated changing, of which eight were decreasing and 20 were likely to be experiencing a relatively
minor transition. After examination of detailed field-level information, 10 soils were assigned stable status (Table 2).
From the fourth tranche, 11 soils could be readily identified as likely increasing in organic matter status (three markedly), 10 decreasing (nine markedly) and a further 21 experiencing no net change and assigned ‘stable’ status. All but one of the latter were under rotational or permanent grassland use. An additional 101 soils could not be readily categorized on the basis of available information. None of these were fractionated.
Evaluation of indicator baseline
For changing soils across all sample sets the mean status of intra-aggregate C was 5.6% of SOC (n= 104). For stable soils the equivalent figure was 4.9% (n= 62). The variance of the two distributions was very similar, especially after transformation to address the skew in the data. The mean values within each land-use category were, for both changing and stable subsets: conventionally tilled arable < min-tilled arable < grassland. Perhaps due to the predominance of positive changes, mean intra-aggregate C within each category was higher for the sample of changing status than for the stable set. The variance ratio for stable versus changing samples was, in the transformed data, only 1.5 for conventionally tilled arable and 2.9 for the min-till equivalent. However, due in part to the small size of some groups (notably stable min-tilled soils), the F statistic indicated that these differences were not significant. In contrast, for the grassland soils variance was higher for stable than changing soils, and this ratio was statistically significant (P< 0.05).
Analysis by soil texture category
Cursory examination of the data suggested that more coherence might be found in the data if results were further split according to soil texture category prior to statistical analysis. For the size of sample available here, such an approach compromised the ability to meaningfully compare the statistical distribution of the data, and so a simple division was made for results from light and⁄or medium versus heavy-textured soils.
For conventionally tilled arable soils with <20% clay content the changing to stable variance ratio of logit-transformed data approached 2.7, and was significant at
P= 0.05. Adopting a more widely applicable cut-off of 30% clay, however, the ratio was only 1.9 (P< 0.1).
It was more difficult to verify intra-aggregate C as an indicator for the impact of minimum tillage on SOC, as the number of sites where stability might have been reached was only four. The high variance ratio and significance level for light textured soils, however, appeared promising (Table 3).
Table 1 Categorization of 25 arable (and ley-arable) soils from second tranche sampling within three soil texture (clay content) categories, with outline of management history
Soil management Heavy soil texture
Increasing soil carbon
Occasional FYM, set aside, ley, sludge; 5 years min-till No leys 20 years; no straw; 4 years min-till 3 in 4 years 25 years straw 2 in 5 years; min-till 8 years
5 years straw and min-till Clover ley 4 years Stable soil carbon
Annual straw 10 years
No straw 10 years since burning Annual straw 10 years
Arable 30 years no straw
No FYM 8 years, varying straw and set aside Arable 50 years, no straw
60 years arable 20 years annual straw Medium soil texture
Increasing soil carbon Reduced tillage 3 years
Arable FYM 1 in 4 years, min-till 4 years minimal straw Straw 8 years, min-till 4 years
Annual straw 4 years Decreasing soil carbon
No straw 3 years, occasional poultry manure No straw 5 years
Stable soil carbon No FYM 18 years
Annual straw, FYM 3 in 10 years Min-till 8 years
Straw 9 in 10 years 20 years straw 4 in 5 years Light soil texture
Decreasing soil carbon
5 years straw 1 in 2 years, FYM 2 in 5 years stopped Stable soil carbon
Annual straw, poultry manure 1 in 4 years, set aside 1 in 5 years
Grassland soils
Variance for intra-aggregate C isolated from grassland sites remained substantially higher for stable soils than their changing counterparts within texture categories, whether the applicable category was 15, 20, 25 or 30% clay, and the variance ratio was significant in each case. However, the number of grassland soils <30% clay was rather small for both stable and changing categories, contributing to a high degree of skew in some of the data even after transformation.
Discussion and conclusion
Evaluation of the indicator approach
The fate of carbon added to soil does not obey first order kinetics, and complexity in soil carbon simulation models arises from the need to explain this, usually by allocating carbon (conceptually) between components that turn over at a contrasting rate. The RothC model is one example in which five pools are defined: decomposable, microbial,
resistant, humus and inert (Coleman & Jenkinson, 1996). Formulae have been found for the allocation that are sufficiently universal to enable trajectories of total SOC to be accurately described at a range of long term sites. The formulae obviate the need to determine the division or carbon between fractions by direct measurement, but strictly apply only to soils under constant management. After a relevant management change, a soil response will be manifest first in the size of the most active components, which will thus change as a proportion of total SOC. As stable fractions slowly respond and SOC re-equilibrates, the proportion returns to normal (Figure 4). It should be possible to use the temporary deviation that has occurred as the basis for a universal indicator of changing SOC, provided that a suitable fraction can be found and measured. Since the indicator works on the basis of its ratio in the soil, rather than its absolute size, it should be equally applicable in soils high, low, or spatially variable in SOC; it can be applied as a one-time measurement. This promises a quick result, and avoidance of error that can result in attempting to precisely re-locate sites during monitoring.
Table 2 Number of samples within categories of time since management change, for soils of three soil texture (clay content) categories, in the third and fourth tranche of soil samples, by land-use; ley arable rotations are included in ‘arable’ category. Corresponding numbers of samples for ‘stable’ situations are also shown. Note: Numbers in parentheses reflect those of the total where relevant management change was small or status less certain. Light soils have clay content <15%, and heavy soils >30%
Years since change
3rd tranche (targeted) 4th tranche (random)
Light Medium Heavy Total Light Medium Heavy Total Arable
1–2 1 3 0 4 (0) 3 0 0 3 (1)
3–4 1 4 0 5 (0) 3 0 0 3 (0)
5–6 0 0 0 0 (0) 0 0 0 0 (0)
7–8 11 7 2 20 (9) 2 3 2 7 (3)
>8 0 0 0 0 (0) 0 0 1 1 (0)
All changing 13 14 2 29 (9) 8 3 3 14 (4)
Stable 1 3 1 5 (3) 0 1 0 1 (0)
Min-till
1–2 0 2 1 3 (0) 0 0 0 0 (0)
3–4 2 4 10 (0) 0 0 0 0 (0)
5–6 0 0 0 0 (0) 0 0 0 0 (0)
7–8 2 6 4 12 (4) 2 0 0 2 (2)
>8 0 1 0 1 (1) 0 0 0 0 (0)
All changing 4 13 9 26 (5) 2 0 0 2 (2)
Stable 1 2 0 3 (1) 0 0 0 0 (0)
Grassland
1–2 1 0 0 1 (0) 0 0 0 0 (0)
3–4 3 2 0 5 (1) 0 2 0 2 (0)
5–6 0 0 0 0 (0) 0 0 0 0 (0)
7–8 1 2 3 6 (5) 0 2 0 2 (0)
>8 0 1 0 1 (0) 0 1 0 1 (0)
All changing 5 5 3 13 (6) 0 5 0 5 (0) Stable 0 2 0 2 (1) 3 10 7 20 (0) Total 24 39 15 78 (20) 13 19 10 42 (6)
114 S. P. Sohiet al.
The principle for indicator function can be illustrated by reference to the simulated dynamic of pools in conceptual soil models by way of an example using RothC (Figure 4). Significant deviation of an indicator fraction from its default status depends not only on the size of change imposed, but on the magnitude of the impact relative to the normal seasonal fluctuation. It is the duration for which status may fall significantly (statistically) outside this zone of normal variation that confers the ‘period of sensitivity’, and this may be negligible for the most dynamic fractions (here, the ‘residue input’ pool; Figure 4a). In contrast, recalcitrant pools are unlikely to show measurable deviation from the normal (dominant) proportion within a season, or over the longer term following change (Figure 4b). A workable indicator fraction will display a proportional change that is both measurable, and that remains detectable for an appropriate period of time (e.g. several years), represented by ‘microbial’ and ‘slow’ pools in Figures 4a and 4b, respectively.
In the present study, a probability distribution was determined for intra-aggregate C in soils considered to be changing in SOC status. This was overlapped by a second, narrower distribution derived from soils not likely to be changing in SOC (stable status). The separation of these distributions should enable the SOC status of soils from previously un-sampled locations to be assessed, by the
position of intra-aggregate C outside the overlap and in the area of the distribution indicative of change. The key limitation of this indicator is that where intra-aggregate C status falls within the overlap, SOC it may be either stable or changing. This means that whilst stability can be ruled out using the indicators fraction, it cannot be confirmed on the basis of measurement alone.
From our understanding of SOC dynamics embodied in RothC and other models, the response of an indicator fraction to change should be slower in a heavy-textured soil compared to a lighter soil, and separate studies involving soil incubation–fractionation experiments suggested that this was so for intra-aggregate C. Contrasting time horizons should then be used to classify soils as stable or changing, according to their verbal management histories, for soils of different texture. Light-textured soils (<15% clay content) where 8 years had elapsed were designated ‘stable’; if it was a medium or heavy-textured soil the corresponding designation was ‘changing’. Selecting optimal categorizations is important to the distributions for stable versus changing situations and hence their statistical distinction.
The type of indicator proposed will work best where it is applied to confirm the impact of a specific single intervention, since the effect of multiple or sequential changes can result in no net impact on the status of an indicator fraction,
0.0 0.2 0.4 0.6 0.8 1.0 1.2 1.4 1.6 1.8 2.0
Time (~decades)
Fraction C (% of SOC)
0 5 10 15 20 25 30
Time (~decades)
Fraction C (% of SOC)
0 20 40 60 80 100 Microbial pool
Residue input pool
Zone of sensitivity Period of sensitivity
Slow pool Zone of sensitivity
Period of sensitivity
Recalcitrant pool
(secondary axis) (a)
(b)
Figure 4 Illustration of soil fraction dynamics, as represented in a typical soil organic matter model. Two of the four pools display potential utility as indicators of change, with regard to the period and measurability of change in status. The input and recalcitrant C fractions show too much short term variation, and small proportional response, respectively.
Table 3 Means for intra-aggregate C as percentage of soil organic carbon (SOC), with variance ratios for transformed data (Genstat logit procedure) and associatedFprobabilities, for soils categorized by land-use and soil texture. Soils in the heavy texture category have clay content >30%; arable soils under conventional tillage include ley-arable
Soil texture
Stable Changing
Variance
ratio Fprobability
n Mean n Mean Arable (conventional tillage)
Light-medium 26 4.40 46 5.25 1.90 0.088 Heavy 10 3.95 6 4.56 1.06 1.006 All textures 36 4.27 52 5.17 1.48 0.112 Arable (minimum-tillage)
Light-medium 4 3.75 22 6.10 3.58 0.320 Heavy 0 n⁄a 14 4.01 n⁄a n⁄a All textures 4 3.75 36 5.29 2.91 0.207 Grassland
Light-medium 15 6.72 13 8.14 0.19 0.003 Heavy 7 5.25 3 5.19 0.08 0.155 All textures 22 6.25 16 7.59 3.66 0.007 All arable and grassland
especially where their forces are in opposing directions. In the farm environment such circumstances may be relatively commonplace.
Arable soils
Many of the management interventions encompassed by the arable dataset are small when considered in the context of the whole soil system, especially if the residual effects of historic changes are considered, which can exert underlying influences contrasting in magnitude and direction, probably over many years. Organic matter inputs to a large proportion of arable soils simultaneously increased with the 1992 ban on straw burning. Such sites were classified ‘stable’ according to the criteria described despite a likely residual trajectory, whereas fields where sale of straw recently reversed this development were designated as changing. This scenario, together with the adoption of straw incorporation over sale or cessation of periodic manure addition, represented prevalent interventions in the ‘changing’ category.
Conversion to minimum tillage was more common, but all min-till fields, stable or changing, were assigned to a separate category due to a more fundamental impact on the vertical re-distribution of organic matter within the soil profile. Although minimum tillage encompasses a range of cultivation practices, intensities and frequency, a more definitive indicator response is anticipated. This could explain the much greater variance ratio for intra-aggregate C in soils converted to min-till, compared to other management interventions in arable fields. It may also demonstrate how a large intervention can override the apparent importance of soil texture to the utility of the indicator: changing the upper limit for clay content from 20% to 30% for the light soil category did not decrease the variance ratio, and a high variance ratio remained for the heavy-textured samples. However, there did appear to be a paucity of long-established min-till sites on which to establish the definitive ‘stable’ distribution required for intra-aggregate C in min-till.
Grassland soils
Permanent grassland sites were represented in third and fourth tranche sampling. This restricted them geographically to the ECSFDI catchments, and permanent grassland featured in only half of the priority catchments. Overall, 19 of 22 grassland soils designated ‘stable’ were from just three catchments, and solely light and heavy textured. One of the three catchments was characterized by soil samples displaying high levels of SOC (half exceeding 8% C in the sampled horizon). Since control on C turnover in organic soils is somewhat distinct from that in other soils, the atypical proportion of SOC in intra-aggregate for these soils was not unexpected. Their inclusion in the analysis may explain the
reversal of variance ratio between changing and stable samples that was seen in the grassland results.
Arable soils ostensibly stable in management were excluded where manure had been recently applied. This was not enforced for grassland since the short-term impact of slurry addition on total SOC was judged to be smaller, partly because surface SOC contents are generally much higher than for arable, and because in slurry the water content and particle size of solids dictates a somewhat different fate. However, the grassland samplings, in the third and fourth tranche, were undertaken in a period immediately after winter slurry application, and this probably increased the variance of the results for stable grassland.
Direct assessment of soil status
Soils from the second tranche sampling were obtained from sites previously assessed for SOC two decades apart as part of the NSI survey. By tying these measurements to soil management history gathered in the present study, alongside a third measurement of SOC undertaken as part of this study, it should have been possible to evaluate the categorization of soils upon which the intra-aggregate C indicator was assessed. However, in many cases the apparent trend in SOC did not appear sufficiently coherent to apply this approach, for example suggesting alternating trajectories whilst under apparently constant management. Since the measured clay content also differed between sampling years at some sites, it was concluded that these contrary findings probably reflected small-scale heterogeneity, and highlighted the challenge presented by monitoring that requires the same precise part of a field to be located on each occasion. The use of single measurements on bulked samples enables the NSI dataset to provide a national picture, but since it does not collect multiple separate samples from individual fields, it is not possible to statistically assess apparent changes in SOC at a particular site.
The proposed intra-aggregate indicator offers a more robust approach. As well as using a one-time measurement, it is expressed as a proportion of total SOC. Thus, provided samples remain within clay content limits defining its texture category, the indicator should function regardless of which part of a texturally variable field is sampled. Nonetheless, it remains important that enough samples are bulked together, such that the inherent variability imposed by management practices themselves is fully encompassed.
Conclusion
Defining probability density distributions for intra-aggregate C in soils categorized as ‘stable’ or ‘changing’ has established the utility of this fraction as an indicator of changing SOC, light textured arable soils, and soils undergoing transition to minimum tillage. A larger dataset may enable application to 116 S. P. Sohiet al.
other soil types and grassland, and to relate the status of intra-aggregate C to a specific trajectory of SOC.
Acknowledgements
The authors acknowledge the significant contributions to this work of Frank Verheijen (formerly Cranfield University) for the sampling of soil from sites of the National Soils Inventory, and to the National Soils Resources Institute (NSRI). The soil management information for the majority of field soils described in this study were collected and recorded by Christopher Brett and Nicola Hall of GY Associates, Harpenden. The participation of farm managers and farm staff in on-farm meetings and follow-up telephone calls during which this information was obtained and clarified in greatly appreciated. Similarly we thank the managers and custodians of experimental farms and plots at Rothamsted and Woburn (Paul Poulton), Brooms Barn, Rosemaund, and Gleadthorpe. The contribution in early discussions of J Webb at ADAS Gleadethorpe is acknowledged, and to the manuscript, D Powlson. Our research was supported by two projects funded by Defra (SP0310 and SP8014); Natural England and its Catchment Sensitive Farming Officers assisted greatly in the identification of potential farm sites during the third and fourth phases of sampling. Additional laboratory support was provided at Rothamsted Research by Lisa Howes. Rothamsted Research is an institute of the UK Biotechnology and Biological Sciences Research Council. The constructive and insightful comments of two anonymous reviewers are noted, and these contributed to the refinement of this manuscript.
References
Bellamy, P.H., Loveland, P.J., Bradley, R.I., Lark, R.M. & Kirk, G.J.D. 2005. Carbon losses from all soils across England and Wales 1978–2003.Nature,437,245–248.
Blair, G.J., Lefroy, R.D.B. & Lisle, L. 1995. Soil carbon fractions based on their degree of oxidation, and the development of a carbon management index for agricultural systems. Australian Journal of Agricultural Research,46,1459–1466.
Coleman, K. & Jenkinson, D.S. 1996. RothC-26.3 – a model for the turnover of carbon in soil. In: Evaluation of soil organic matter models(eds D.S. Powlson, P. Smith & J.U. Smith), Vol. 38, pp. 237– 246. Nato ASI Series 1 Global Environmental Change, Berlin.
Defra. 2002. The strategy for sustainable farming and food. Defra Publications, London.
Golchin, A., Oades, J.M., Skjemstad, J.O. & Clarke, P. 1994. Study of free and occluded particulate organic matter in soils by solid sate 13C CP⁄MAS NMR spectroscopy and scanning electron microscopy. Australian Journal of Soil Research, 32,
285–309.
Ko¨rschens, M., Weigel, A. & Schulz, E. 1998. Turnover of soil organic matter (SOM) and long-term balances – tools for evaluating sustainable productivity of soils. Journal of Plant Nutrition and Soil Science,161,409–424.
MAFF. 2000. Fertiliser recommendations for agricultural and horticultural crops. RB209, HMSO, London.
Olk, D.C., Cassman, K.G., Randall, E.W., Kinchesh, P., Anderson, J.J. & Sanger, L.J. 1996. Changes in chemical properties of soil organic matter with intensified rice cropping in tropical lowland soil.European Journal of Soil Science,47,293–303.
Poirier, N., Sohi, S.P., Gaunt, J.L., Mahieu, N., Randall, E.W., Powlson, D.S. & Evershed, R.P. 2005. The chemical composition of measurable soil organic matter pools.Organic Geochemistry,36,
1174–1189.
Powlson, D.S., Brookes, P.C. & Christensen, B.T. 1987. Measurement of soil microbial biomass provides an early indication of changes in total soil organic matter due to straw incorporation.Soil Biology and Biochemistry,19,159–164. Six, J., Merckx, R., Kimpe, K., Paustian, K. & Elliott, E.T. 2000. A
re-evaluation of the enriched labile soil organic matter fraction.
European Journal of Soil Science,51,283–293.
Sohi, S.P. 2001. Dynamic modelling of soil organic matter using physically defined fractions. PhD thesis, University of London, London, 248 pp.
Sohi, S.P., Mahieu, N., Arah, J.R.M., Powlson, D.S., Madari, B. & Gaunt, J.L. 2001. A procedure for isolating soil organic matter fractions suitable for modeling. Soil Science Society of America Journal,65,1121–1128.
Sohi, S.P., Mahieu, N., Powlson, D.S., Madari, B., Smittenberg, R. & Gaunt, J.L. 2005. An investigation of the chemical characteristics of soil organic matter fractions suitable for modeling.Soil Science Society of America Journal,69,1248–1255. Tanner, C.B. & Jackson, M.L. 1947. Nomographs of sedimentation
times for soil particles under gravity or centrifugal acceleration.
Soil Science Society Proceedings,1947,60–65.
Verheijen, F. 2005. On-farm benefits from soil organic matter in England and Wales. PhD thesis, Cranfield University, Cranfield, 187 pp.