Open Access
R E S E A R C H A R T I C L E
© 2010 Fleming et al; licensee BioMed Central Ltd. This is an Open Access article distributed under the terms of the Creative Commons Attribution License (http://creativecommons.org/licenses/by/2.0), which permits unrestricted use, distribution, and reproduction in any medium, provided the original work is properly cited.
Research article
The normal breast microenvironment of
premenopausal women differentially influences
the behavior of breast cancer cells
in vitro
and
in
vivo
Jodie M Fleming
1, Tyler C Miller
1, Mariam Quinones
2, Zhen Xiao
3, Xia Xu
3, Matthew J Meyer
1, Erika Ginsburg
1,
Timothy D Veenstra
3and Barbara K Vonderhaar*
1Abstract
Background: Breast cancer studies frequently focus on the role of the tumor microenvironment in the promotion of cancer; however, the influence of the normal breast microenvironment on cancer cells remains relatively unknown. To investigate the role of the normal breast microenvironment on breast cancer cell tumorigenicity, we examined whether extracellular matrix molecules (ECM) derived from premenopausal African-American (AA) or Caucasian-American (CAU) breast tissue would affect the tumorigenicity of cancer cells in vitro and in vivo. We chose these two populations because of the well documented predisposition of AA women to develop aggressive, highly metastatic breast cancer compared to CAU women.
Methods: The effects of primary breast fibroblasts on tumorigenicity were analyzed via real-time PCR arrays and mouse xenograft models. Whole breast ECM was isolated, analyzed via zymography, and its effects on breast cancer cell aggressiveness were tested in vitro via soft agar and invasion assays, and in vivo via xenograft models. Breast ECM and hormone metabolites were analyzed via mass spectrometry.
Results: Mouse mammary glands humanized with premenopausal CAU fibroblasts and injected with primary breast cancer cells developed significantly larger tumors compared to AA humanized glands. Examination of 164 ECM molecules and cytokines from CAU-derived fibroblasts demonstrated a differentially regulated set of ECM proteins and increased cytokine expression. Whole breast ECM was isolated; invasion and soft agar assays demonstrated that estrogen receptor (ER)-, progesterone receptor (PR)/PR- cells were significantly more aggressive when in contact with AA ECM, as were ER+/PR+ cells with CAU ECM. Using zymography, protease activity was comparatively upregulated in CAU ECM. In xenograft models, CAU ECM significantly increased the tumorigenicity of ER+/PR+ cells and enhanced metastases. Mass spectrometry analysis of ECM proteins showed that only 1,759 of approximately 8,000 identified were in common. In the AA dataset, proteins associated with breast cancer were primarily related to tumorigenesis/ neoplasia, while CAU unique proteins were involved with growth/metastasis. Using a novel mass spectrometry method, 17 biologically active hormones were measured; estradiol, estriol and 2-methoxyestrone were significantly higher in CAU breast tissue.
Conclusions: This study details normal premenopausal breast tissue composition, delineates potential mechanisms for breast cancer development, and provides data for further investigation into the role of the microenvironment in cancer disparities.
Background
Breast cancer is the most frequently diagnosed cancer and the second leading cause of cancer-related deaths of women living in the US [1]. Breast cancer manifests itself
* Correspondence: vonderhb@mail.nih.gov
1 Mammary Biology and Tumorigenesis Laboratory, Center for Cancer
Research, National Cancer Institute, Bethesda, MD, USA
in the mammary epithelium; however, tumors do not progress to malignancy in isolation. The local microenvi-ronment can enhance or suppress tumor growth and pro-gression, as well as metastases [2-8]. The stroma is composed of diverse cell types including endothelial and immune cells, adipocytes, and fibroblasts. These cells secrete products, including growth factors and extracel-lular matrix (ECM) components, which profoundly affect cell behavior. It has been suggested that altered commu-nication between these cells can lead to the progression or expansion of malignant growth. While numerous stud-ies have observed the effects of synthetic or mouse-derived ECM on breast cancer cells, relatively little is known about the molecular interactions between human breast ECM and epithelial cells.
Recently, a novel in vivo xenograft model mimicking human ductal carcinoma in situ (DCIS) illustrated that the progression of normal tissue towards a neoplastic state depends on the surrounding stromal cells [9]. Nor-mal myoepithelial cells inhibited the progression of DCIS to an invasive carcinoma, while the addition of fibroblasts enhanced invasion. Additionally, reports demonstrated that the mammary microenvironment can reprogram both embryonic and adult murine stem cells into mam-mary cells capable of expressing milk proteins and hor-mone receptors, substantiating the remarkable control the environment has on cell behavior [10,11].
African-American (AA) women have a lower overall incidence of breast cancer compared to Caucasian-Amer-ican (CAU) women but a signifCaucasian-Amer-icantly higher incidence rate before the age of 40, and a higher mortality rate at any age [1]. Breast carcinomas in premenopausal AA patients are more often triple negative, which lack estro-gen receptor (ER), progesterone receptor (PR), and human epidermal growth factor receptor 2 (HER2) amplification [12-15]. Triple-negative cancers constitute one of the most challenging types of breast cancer, as the only systemic therapy is chemotherapy.
It has been proposed that premenopausal AA women develop triple-negative tumors due to multifactorial dif-ferences including socioeconomic factors, body mass index, diet, earlier age at first pregnancy, lower incidence of breastfeeding, and higher breast density [16,17]. How-ever, these factors do not explain everything. A recent study reported that even after adjusting for socioeco-nomic status, AA women still have a 22% higher mortal-ity rate [18]. Interestingly, there are parallels in carcinoma development between women in western African nations and AAs, including early onset of disease and hormone receptor negativity [19]. These women share common ancestry suggesting that mutations in breast cancer sus-ceptibility genes are partly responsible for the high preva-lence of triple-negative carcinomas [19]. This predisposition of AA women to develop a more
aggres-sive cancer compared to CAU women provides a unique model for studying the role of the normal breast microen-vironment on breast cancer development. Hence, our objective was to determine whether factors within the local microenvironment of premenopausal AA and CAU women differentially alter the behavior of breast cancer cells.
In this study, premenopausal AA or CAU primary breast fibroblasts and ECM from whole breast tissue were isolated and examined by several in vitro and in vivo methods. ER-/PR- cells were significantly more aggressive
in the presence of AA ECM by both invasion and soft agar assays; in contrast, CAU ECM caused increased aggressiveness with ER+/PR+ cells. By mass spectrometry,
approximately 22% of identified proteins were common to both AA-derived and CAU-derived ECM; proteins related to tumorigenesis/neoplasia were more highly associated with the AA ECM while proteins involved with growth/metastasis were more prevalent with the CAU ECM. Using a novel mass spectrometry assay to measure biologically active hormones, only estradiol, est-riol, and 2-methoxyestrone levels were significantly higher in the CAU breast. Finally, in a xenograft model, CAU ECM significantly enhanced the tumorigenicity and metastases of ER+/PR+ cells. To our knowledge, we are
the first to investigate the normal ECM of premenopausal women; furthermore, results from this study may help identify mechanisms by which AA are predisposed to developing a more aggressive breast cancer.
Methods
Collection and processing of patient samples
Pleural effusion cells were collected from a parous, 49-year-old Caucasian breast cancer patient with an ER+/
PR+, Her2-, T1, pN1, M1, Grade 3, poorly differentiated
invasive ductal carcinoma. Immediately following collec-tion, cells were processed as follows: cells were gently pel-leted by centrifugation, washed twice in Hank's buffered saline solution, frozen viably in dimethylsulfoxide (DMSO) Freeze media (Invitrogen; Gaithersburg, MD, USA) and stored in liquid nitrogen until used. The cells derived from the pleural effusion were ER-/PR- and Her2-,
as determined by immunohistochemistry.
Fluorescent activated cytometric sorting (FACS)
Immediately prior to use, pleural effusion cells were stained with lineage markers to segregate tumor from non-tumor cells as previously described [20]. Briefly, lin-eage marker antibodies used were fluorescein conjugated anti-human CD2, CD3, CD10, CD16, CD18, CD31, CD64, and CD140b (BD Biosciences, San Jose, CA, USA). Cells were stained in a phosphate-buffered saline (PBS) solution containing 0.1% fetal bovine serum (FBS) and 100 units/ml penicillin/streptomycin for 25 min at 4°C. Cell sorting was performed on a BD FACSAria operating at low pressure (20 psi) using a 100 μm nozzle. Doublets were electronically gated out and 7-aminoactinomycin D (7AAD, 1 μg/ml final concentration, BD Biosciences) was used for live/dead cell distinction. Live, fluorescein nega-tive tumor cells were sorted into a PBS solution contain-ing 50% FBS. Post-sort analysis typically indicated purities of >96% with minimal cell death (<10%). FACS data were analyzed using FlowJo v8.7.3 (TreeStar, Ash-land, OR, USA).
Cell culture
MCF10Ca1h cells (kind gift of FR Miller, Wayne State University, Detroit, MI, USA, through LM Wakefield, Center for Cancer Research (CCR), National Cancer Institute (NCI), Bethesda, MD, USA) were maintained as described previously [21]. All other cell lines were obtained from the American Type Culture Collection (ATCC; http://www.atcc.org) and cultured according to the repository's instructions. Fibroblasts were isolated as described [22]. Briefly, <5 mm pieces of tissue were placed on a scratched cell culture dish. Tissue pieces were covered with a minimal amount of media and, with time, the fibroblasts crawled out of the tissue to form a mono-layer on the dish. The fragments of tissue were removed and the remaining fibroblasts were passaged and plated as monolayer cultures to expand and ensure fibroblast purity. When necessary, epithelial cells were separated from the stromal cells by differential trypsinization and selective pressure with fibroblast growth medium. Fibro-blasts were grown for a maximum of two passages prior to analysis.
Isolation of whole breast tissue ECM proteins
Extraction of human breast ECM from whole breast tis-sue was performed as previously described [23]. A mini-mum of three different age-matched patient samples per treatment group was used for each extraction (total n = 26 AA, and 21 CAU). Pools were necessary in order to obtain enough tissue from which to extract ECM. A dif-ferent pool of samples was used for each experiment. Matrices were stored on ice at 4°C and used within 5 days of isolation.
Zymography
Equal amounts of protein were separated by gel electro-phoresis in a 10% Tris-glycine polyacrylamide gel (Invit-rogen) with 0.1% gelatin incorporated as a substrate. Proteins were renatured, soaked in developing buffer, and then stained according to the manufacturer's instruc-tions. Matrix metalloproteinase (MMP) activity was visu-alized as clear bands against a dark blue background where the protease has digested the substrate. Identifica-tion of MMPs was based on published molecular weights. Three independent experiments, each with different pools of age-matched patient samples (minimum of three patient samples per pool), were performed with each individual experiment repeated in duplicate to ensure repeatability.
Invasion assay
Transwell membranes (8 μm pores) were precoated with equal amounts of ECM, adjusted for total protein con-tent. Breast cancer cells were washed, resuspended in serum-free medium, and then plated in the top chamber of transwell inserts (at the predetermined concentration for each cell line). The cells were allowed to invade through the membrane for up to 16 h towards FBS-con-taining medium in the bottom chamber. Following inva-sion, the cells were wiped from the top surface of the membrane; the remaining cells were fixed in methanol and stained with a 1% toluidine blue solution. Four inde-pendent experiments, each with different pools of patient samples (minimum of three patient samples per pool), were performed with each individual experiment repeated in duplicate to ensure repeatability.
Soft agar assay
patient samples (minimum of three patient samples per pool), were performed with each individual experiment repeated in duplicate to ensure repeatability.
Immunohistochemistry
Immunohistochemistry was performed with appropriate controls as described previously [24]. Briefly, sections of formalin fixed, paraffin embedded tissue 5 μm thick were prepared from all tumors obtained in the xenograft stud-ies, and fragments of the lungs and livers of animals used in the metastasis experiments. The human specific COXIV antibody (1:1,000, Cell Signaling; Boston, MA, USA) was used for detection of metastases of breast can-cer cells in the xenograft experiments. Antibodies Ki67 (Santa Cruz Biotechnology, Santa Cruz, CA, USA) and ER (Leica Microsystems, Bannockburn, IL, USA) were used according to manufacturers' instructions. Staining was performed using Vectastain ABC kit (Vector Labora-tories; Burlingame, CA, USA) according to the manufac-turer's instructions. Color was developed with diaminobenzidine peroxidase substrate kit (Vector Labo-ratories) and sections were counterstained with hematox-ylin.
Quantitative real-time (qRT) PCR and PCR arrays
Total RNA was isolated from primary breast fibroblasts using the Qiagen RNeasy kit according to the manufac-turer's instructions (Valencia, CA, USA). RNA was reverse transcribed using MMLV reverse transcriptase (Invitrogen) and primed with oligo-dT and random hex-amers (Invitrogen). The cDNA was subjected to RT-PCR amplification using gene specific primers and 2 × Brilliant II Sybr Green QPCR Mastermix (Stratagene, La Jolla, CA, USA). Primer sequences are given in Additional file 1: Table S1. Quantitative RT-PCR was analyzed via the ΔΔCT method, and PCR products were visualized by agarose gel electrophoresis. qRT-PCR arrays were per-formed and analyzed with the commercially available qRT-PCR array kits according to the manufacturer's instructions (SABiosciences, Frederick, MD, USA). Three pools of fibroblasts, each with a minimum of three differ-ent patidiffer-ent fibroblasts per pool, were used for each array (n = 9 AA and 10 CAU). Validation of the array data used different, freshly isolated individual primary fibroblasts (n = 9 AA and 9 CAU).
In vivo tumor formation assays
Animal experiments were conducted in accord with accepted standards of humane animal care and approved by the Animal Care and Use Committee at the National Institutes of Health, USA. Female, 8-week-old athymic Nu/Nu mice, or NOD/SCID where indicated, were ran-domized into three groups with a minimum of five mice per group (APA, Frederick, MD, USA). Mice were anes-thetized by an intraperitoneal injection of
ketamine/xyla-zine (750 and 50 mg/kg body weight, respectively) in Hank's buffered saline solution (HBSS) prior to surgically exposing the gland for injection. NOD SCID mice were supplemented with estrogen via a subcutaneous pellet (0.72 mg β-estradiol, 90-day release, Innovative Research of America, Sarasota, FL, USA) at the time of breast can-cer cell injection. For fibroblast studies, mouse abdominal mammary glands were humanized with primary human fibroblasts as previously described [25]. Each experiment used a minimum of three different patient pools of fibro-blasts per humanization (total AA n = 12, CAU n = 14). Following humanization, primary metastatic breast can-cer cells, derived from a pleural effusion, were sorted via FACS to remove non-epithelial cells, and then mixed with 1:1 ratio of 1 × PBS:Matrigel (BD Biosciences). A total of 30 μl of ECM containing 5 × 10³ cells was injected into
the humanized abdominal mammary gland fat pad. Tumor growth was measured using calipers on a weekly basis. Tumors were excised when the majority of tumors reach 1.0 cm3, and final tumor volume was calculated
((0.5 × L) × (0.5 × W) × (0.5 × H) × (4/3) × (π)).
For ECM studies, breast cancer cells (MDA-MB-231 and T47D) proliferating in log phase were mixed with control matrix (Matrigel), AA or CAU ECM, adjusted for equal protein content. A total of 40 μl of ECM containing 1 × 10⁶ or 2 × 10⁶ cells was injected, respectively, into the
abdominal mammary fat pad or subcutaneously proximal to the scapula. Tumor growth was measured on a weekly basis using calipers. Tumors were excised using survival surgery when the majority of tumors reach 1.0 cm3, and
final tumor volume was calculated. At 3 months post tumor excision, the animals were killed and the liver and lung tissues were removed for detection of metastases. Tissues were analyzed for metastases by pathological evaluation, quantitative PCR using human-specific prim-ers developed to β2-microglobulin [26], and immunohis-tochemistry using a human specific COXIV antibody. Each animal experiment was repeated a minimum of two times, using different pools of ECM (minimum of three patients per pool) for each experiment.
Mass spectrometry
acid prior to nanoflow reversed-phase liquid chromatog-raphy (nanoRPLC) mass spectrometry analysis. NanoR-PLC columns were slurry packed with 5 μm, 300 Å pore size C-18 silica-bonded stationary reverse-phase particles (Jupiter; Phenomenex, Torrance, CA, USA) in a 75 μm internal diameter × 10 cm fused silica capillary with a flame pulled tip. The column was connected to an Agi-lent 1100 nanoLC system and coupled to a linear ion trap (LIT) mass spectrometer (LTQ, ThermoElectron, , San Jose, CA, USA, operated with Xcalibur 1.4 SR1 software). The samples were injected onto the column and the pep-tides eluted using a gradient of mobile phase A (0.1% for-mic acid in water) and B (0.1% forfor-mic acid in acetonitrile). The LTQ was operated in a data-dependent mode in which the seven most abundant peptide molecu-lar ions in every MS scan were sequentially selected for collision-induced dissociation (CID) using a normalized collision energy of 35%. Dynamic exclusion was applied to minimize repeated selection of peptides previously selected for CID.
Tandem mass spectra were searched against the Uni-Prot human proteomic database from the European Bio-informatics Institute with SEQUEST (http://fields. scripps.edu/sequest/) operating on a 40-node Beowulf cluster. Peptides were searched using fully tryptic cleav-age constraints. Oxidation of methionine (+15.9949 Da) was included as dynamic modification. For a peptide to be considered legitimately identified, it must have achieved a minimum Δ correlation (ΔCn) of 0.08 and charge state-dependent cross correlation (Xcorr) scores of 1.9 for [M + H]1+, 2.2 for [M + 2H]2+, and 3.1 for [M +
3H]3+ peptide molecular ions. Data were subjected to
functional analysis through the use of Ingenuity pathways analysis (IPA; Ingenuity Systems, http://www.ingenu-ity.com) and BIOBASE (http://www.biobase-interna-tional.com).
Estrogen metabolite analysis
Reagents and materials for steroid analysis
A total of 15 estrogens including estrone (E1), estradiol (E2), estriol (E3), 16-epiestriol (16-epiE3), 17-epiestriol (17-epiE3), 16-ketoestradiol (16-ketoE2), 16α-hydroxye-strone (16α-OHE1), 2-methoxyestrone (2-MeOE1),
4-methoxyestrone (4-MeOE1), 2-hydroxyestrone-3-methyl ether (3-MeOE1), 2-methoxyestradiol (2-MeOE2),
4-methoxyestradiol (4-MeOE2), 2-hydroxyestrone
(2-OHE1), 4-hydroxyestrone (4-OHE1), and 2-hydroxyestra-diol (2-OHE2) and 2 androgens, androstenedione and
tes-tosterone, were obtained from Steraloids (Newport, RI, USA). Stable isotope labeled steroids, including estradiol-13,14,15,16,17,18-13C
6 (13C6-E2) and estrone-13,14,15,
16,17,18-13C
6 (13C6-E1) were purchased from Cambridge
Isotope Laboratories (Andover, MA, USA); estriol-2,4,17-d3 (d3-E3), 2-hydroxyestradiol-1,4,16,16,17-d5 (d5 -2-OHE2), 2-methoxyestradiol-1,4,16,16,17-d5 (d5 -2-MeOE2), androstenedione-2,2,4,6,6,16,16-d7 and testos-terone-16,16,17-d3 were obtained from C/D/N Isotopes (Pointe-Claire, Quebec, Canada). 16-Epiestriol-2,4,16-d3
(d3-16-epiE3) was purchased from Medical Isotopes (Pel-ham, NH, USA). All steroid analytical standards have reported chemical and isotopic purity ≥98%, and were used without further purification. Dichloromethane and methanol were obtained from EM Science (Gibbstown, NJ, USA). Glacial acetic acid and sodium bicarbonate were purchased from JT Baker (Phillipsburg, NJ, USA) and sodium hydroxide and sodium acetate were pur-chased from Fisher Scientific (Fair Lawn, NJ, USA). Ethyl alcohol was obtained from Pharmco Products (Brook-field, CT, USA). Formic acid, acetone, dansyl chloride, and L-ascorbic acid were obtained from Sigma-Aldrich (St Louis, MO, USA). All chemicals and solvents used in this study were high performance liquid chromatography (HPLC) or reagent grade unless otherwise noted.
Preparation of stock and working standard solutions
Stock solutions of steroids and stable isotope labeled ste-roids were each prepared at 80 μg/ml by dissolving 2 mg of each estrogen powder in methanol containing 0.1% L -ascorbic acid to a final volume of 25 ml in a volumetric flask. Stock solutions were monitored by measuring the absolute peak height of each steroid using liquid chroma-tography-mass spectrometry/mass spectrometry (LC-MS/MS) to verify that no time-dependent degradation of steroid standards had occurred. The stock solutions are stable for at least 2 months while stored at -20°C. Work-ing standard solutions of steroids at 0.32 and 8.0 ng/ml were prepared by dilutions of the stock solutions with methanol containing 0.1% L-ascorbic acid.
Sample preparation procedure
added to each tissue homogenate. The mixture was incu-bated on a rotator at room temperature for 1 h and cen-trifuged at 3,000 g for 30 min. The ethanol:acetone tissue extract was transferred to a clean glass tube and dried under nitrogen gas at 60°C for 1 h (Reacti-Vap III, Pierce, Rockford, IL, USA). The residue was redissolved in 4 ml of methanol, vortexed for 1 min, chilled at -80°C for 1 h, returned to room temperature and then centrifuged at 3,000 g for 20 min. The methanolic phase was transferred to a clean glass tube and dried under nitrogen gas. The residue was further redissolved in 100 μl of ethanol and vortexed briefly. This was followed by the addition of 1.5 ml of 100 mM sodium acetate buffer, pH 4.6 and 5 ml of dichloromethane to the residue, and incubation at room temperature on a rotator for 30 min. The extract was chilled at -80°C for 10 min, returned to room temperature
and centrifuged at 3,000 g for 20 min. The
dichlo-romethane phase was transferred to a clean tube and dried. To each dried sample, 32 μl of 0.1 M sodium bicar-bonate buffer, pH 9.0, and 32 μl of dansyl chloride solu-tion (1 mg/ml in acetone) were added. After vortexing for 10 s, samples were heated at 70°C (Reacti-Therm III Heating Module; Pierce) for 10 min to form the EM and d-EM dansyl derivatives. The dansyl derivatization method modifies the phenol hydroxyl group of EM and will not react with testosterone. After derivatization, all samples were centrifuged at 3,000 g for 20 min, and ana-lyzed by the capillary LC-ESI-MS/MS.
Capillary liquid chromatography-electrospray ionization tandem mass spectrometry analysis (Cap LC-ESI-MS/MS)
Capillary LC-ESI-MS/MS analysis was performed using an Agilent 1200 series nanoflow LC system (Agilent Technologies, Palo Alto, CA, USA) coupled to a TSQ Quantum Ultra triple quadrupole mass spectrometer (ThermoElectron). The LC separation was carried out on a 150 mm long × 300 μm internal diameter column packed with 4 μm Synergi Hydro-RP particles (Phenome-nex) and maintained at 40°C. A total of 8.0 μl of each sample was injected onto the column. The mobile phase, operating at a flow rate of 4.0 μl/min, consisted of metha-nol as solvent A and 0.1% (v/v) formic acid in water as solvent B. A linear gradient increasing from 72% to 85% solvent A in 75 min was employed for the separation. The MS conditions were source: ESI; ion polarity: positive; spray voltage: 3,500 V; sheath and auxiliary gas: nitrogen; sheath gas pressure: 7 arbitrary units; ion transfer capil-lary temperature, 270°C; scan type: selected reaction monitoring (SRM); collision gas: argon; collision gas pres-sure: 1.5 mTorr; scan width: 0.7 u; scan time: 0.50 s; Q1 peak width: 0.70 u full-width half-maximum (FWHM); Q3 peak width: 0.70 u FWHM. The specific SRM transi-tions of protonated androgens were: testosterone m/z 289T97 and 109; testosterone-d3 m/z 292T97 and 109;
androstenedione m/z 287T97 and 109; androstenedione-d7 m/z 287T100 and 113.
Quantitation of tissue estrogens and androgens
Quantitation of tissue estrogens and androgens was car-ried out using Xcalibur Quan Browser (ThermoElectron). Briefly, calibration curves for each steroid were con-structed by plotting non-labeled steroid/stable isotope labeled steroid peak area ratios obtained from calibration standards versus amounts of the steroid injected on the column and fitting these data using linear regression with 1/X weighting. The amounts of steroid in the tissue were then interpolated using this linear function.
Statistical analysis
Pools of patient samples were necessary to obtain the required amount of tissue for ECM extraction. When appropriate, data was evaluated for significance via two-tailed Student t tests, repeated measures analysis of vari-ance (ANOVA) with the Bonferroni multiple compari-sons post hoc analysis, Wilcoxon matched pairs, or Mann-Whitney tests using GraphPad InStat Software version 3.0b (San Diego, CA, USA). Data was considered signifi-cant at P < 0.05.
Results
Effects of premenopausal breast fibroblasts on breast cancer cell tumorigenicity
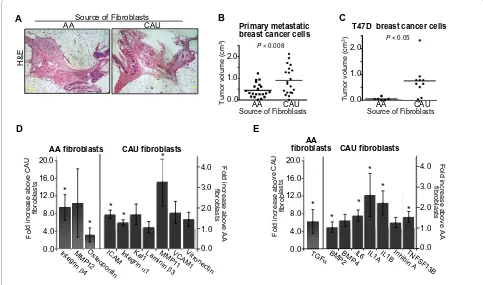
It has previously been shown that tumor-derived fibro-blasts promote, while normal fibrofibro-blasts inhibit, the growth of tumorigenic epithelial cells in vitro and in vivo [7,27]. Therefore, we first 'humanized' the mouse mam-mary gland [27] creating a microenvironment with sup-portive stromal components from either the AA or CAU breast. Primary breast fibroblasts from age-matched, pre-menopausal women were isolated [22] and a pool of a minimum of three patient-derived fibroblasts per group was injected into mouse abdominal mammary glands. A different pool of patient fibroblasts was used for each of three independent humanization experiments. As shown in Figure 1a, both the AA and CAU fibroblasts equally humanized the glands, suggesting that the source of the fibroblasts did not have an effect on the percentage of growth throughout the glands.
Following humanization, primary metastatic breast cancer cells (ER-/PR-, as described in Methods) were
morphologi-cal differences between treatment groups; tumors were ER-/PR-, undifferentiated invasive carcinomas.
Interest-ingly, glands humanized with CAU fibroblasts repeatedly developed significantly larger tumors compared to AA humanized glands (Figure 1b, P < 0.008) suggesting that either CAU fibroblasts were more permissive to tumori-genesis, or that AA fibroblasts were more restrictive. There was no significant difference in the Ki67 prolifera-tion index at the time of tumor collecprolifera-tion (Addiprolifera-tional file 1, Figure S1a). Additionally, of the tumors that contained necrotic regions, there was no significant difference in the percentage of necrotic area; however, it should be noted that the significantly larger tumors from glands humanized with CAU fibroblasts had overall higher levels of tumors containing necrotic regions compared to the AA humanized glands (50% vs 33%, Additional file 1, Fig-ure S1b).
A similar pattern of tumor formation was observed using T47D, a well characterized, ER+/PR+ human breast
cancer cell line; the cells injected into the glands human-ized with the CAU fibroblasts had increased tumor
vol-ume (Figure 1c, P < 0.05). The resultant tumors from both treatment groups were ER+/PR+ by
immunohistochemis-try (data not shown); therefore the hormonal status of the cells was retained regardless of the source of fibroblasts.
In the presence of fibroblasts derived from the two groups, differences in tumorigenicity were observed. Therefore, the expression profiles of 164 ECM molecules and cytokines were examined using qRT-PCR arrays. Cytokines were analyzed since components of the immune system have been reported to modulate the initi-ation and progression of breast cancer, including metas-tasis to bone [28-32]. Fibroblasts were expanded in culture for less than two passages prior to isolation of total RNA. Different pools of at least three patient sam-ples per group were used in each of three independent array experiments (n = 9 AA, n = 10 CAU). A set of ECM proteins and cytokines was consistently differentially reg-ulated between the two groups (Additional file 1, Figure S2a and b, respectively). Array results were validated by qRT-PCR; expression patterns were observed not only using samples from the array analysis, but also with addi-Figure 1 Tumor formation and extracellular matrix molecules (ECM)/cytokine analyses of premenopausal African-American and
Cauca-sian-American breast fibroblasts. (a) Hematoxylin and eosin (H&E) staining of murine mammary glands humanized with African-American (AA) or
Caucasian-American (CAU) fibroblasts. (b,c) Humanized murine mammary glands were injected with either primary metastatic breast cancer or T47D
cells. Data represent mean ± SD of final tumor volume. (d,e) Quantitative real-time PCR analysis: primary human breast fibroblasts were isolated from
fresh reduction mammoplasty breast tissue. RNA was isolated and analyzed via quantitative real-time PCR. Individual patient samples (n = 18) were
used to validate array results with newly designed primers to the indicated genes. Data represent fold increase ± standard error of differentially
regu-lated genes. *P < 0.05
breast cancer cells Primary metastatic B 2.0 1.0 0.0 T u m o r v o lu m e (c m
3) P< 0.008
CAU AA
Source of Fibroblasts
C
T47D breast cancer cells
2.0 1.0 0.0 T u m o r v o lu m e (c m 3)
Source of Fibroblasts P< 0.05
AA CAU
D E
A
H&E
CAU AASource of Fibroblasts
Vitron ectin MM P11 Lam ininE 3 Inte grinD 1 Kal1 IC
AM VCAM
1 3.0 2.0 1.0 0.0 4.0 Inte grinE 4 M M P12 O steop on tin AA fibroblasts 4.0 0.0 12.0 8.0 20.0 16.0 F o ld in c re a s e a b o v e A A fib ro b la s ts F o ld in c re a s e a b o v e C A U fi b ro b la s ts CAU fibroblasts 3.0 2.0 1.0 0.0 4.0 BM
P2BMP4IL6 IL1AIL1BInhibin
tional randomly chosen, freshly isolated, individual patient samples (n = 18, Figure 1d, e). As expected, there was substantial individual patient variation; however, 13 of the 18 genes that were differentially expressed between the groups in the array analysis were significantly differ-ent when individual patidiffer-ent samples were analyzed (P < 0.05). Of note, CAU-derived fibroblasts repeatedly exhib-ited an increase in cytokine expression (Figure 1e and Additional file 1, Figure S2b). This observation may explain, in part, the increase in tumor growth observed in the xenograft experiments (Figure 1b, c). Collectively, these data suggest that when stromal fibroblasts are con-fronted with the invasion of tumorigenic breast cells, genetic variation between the groups differentially affected tumorigenesis via the production of distinctive ECM molecules and cytokines.
Effects of premenopausal breast ECM on breast cancer cells in vitro
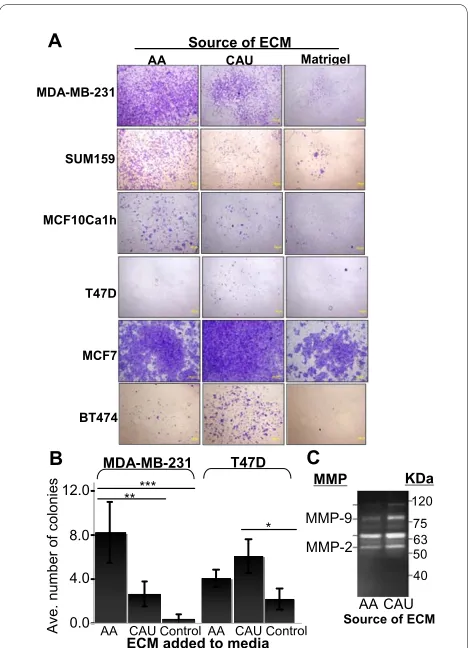
Numerous cell types, in addition to fibroblasts, comprise the breast microenvironment. To gain further insight into these multicellular interactions, we analyzed a broader spectrum of molecules within the breast by isolating ECM proteins from premenopausal whole breast tissue. In order to test whether ECM isolated from whole breast tissue was able to differentially influence breast cancer cell aggressiveness, we examined cell motility and inva-siveness using transwell filter assays. Two classes of breast cancer cell lines were used: ER-/PR-
(MDA-MB-231, SUM159, MCF10Ca1h) and ER+/PR+ (T47D, MCF7,
BT474). These cell lines were chosen for their well char-acterized phenotype, specifically to limit any confound-ing effects of uncharacterized primary breast cancer cells. Cells were overlaid onto one of the three matrices (adjusted for equal protein concentration) and allowed to respond to a chemoattractant. Four independent experi-ments, each with different pools of patient samples (min-imum of three patient samples per pool), were performed with each individual experiment repeated in duplicate to ensure repeatability. Cell invasion through the control matrix was low for all cell lines tested (Figure 2a). Inter-estingly, the ability of cells to invade through the ECM was dependent upon both the cell's hormone receptor status and the source of the ECM. The ER-/PR- cells were
consistently more invasive when in contact with the AA ECM. Conversely, all of the ER+/PR+ cell lines tested were
more invasive when in contact with the CAU ECM, sug-gesting that the invasiveness of cells was enhanced by a hormone receptor-dependent mechanism in the presence of CAU ECM. The increased invasiveness may have occurred through a combinatorial effect of ECM compo-nents and hormones in the chemoattractant serum. This potential hormone receptor-dependent stimulus had no effect on the ER-/PR- cells. In the AA-derived ECM,
how-ever, a hormone-independent mechanism appeared to further stimulate the invasiveness of the ER-/PR- cells.
Soft agar transformation assays were performed to measure whether the addition of either ECM could differ-entially influence cell survival under anchorage-indepen-dent conditions, mimicking changes that occur during tumorigenesis. Results were similar to those observed with invasion assays; the AA ECM significantly increased the number of colonies for the ER-/PR- MDA-MB-231
cells above all other treatments (P < 0.01, Figure 2b). Sim-ilar results were observed with SUM159 and MCF10Ca1h cells (Additional file 1, Figure S3). Addition-ally, the CAU ECM significantly increased colony forma-Figure 2 Invasion and anchorage-independent growth of breast cancer cells in the presence of premenopausal African-American or Caucasian-American breast extracellular matrix molecules
(ECM). (a) Cell invasion through transwell inserts, precoated with
equal amounts of ECM. Data are representative of four independent
experiments. (b) Soft agar assays. Cells were stained with
nitrobluetet-razolium before counting after 10 days of growth. The entire dish was analyzed and colonies larger than 1 μm in diameter were counted. Data represent mean ± standard error of three separate experiments.
*P < 0.05 **P < 0.01, ***P < 0.001; paired t test. (c) Gelatin zymography.
ECM was isolated from six pools of 3-7 patients/pool. Results are repre-sentative of three experiments performed in triplicate. AA = African-American; CAU = Caucasian-American.
Matrigel
MDA-MB-231
SUM159
T47D
MCF7
Source of ECM
MCF10Ca1h
BT474
AA CAU
T47D B
0.0 4.0 8.0 12.0
MDA-MB-231
Ave. number of
coloni
es
*
ECM added to mediaControl Control A
*** **
Source of ECM
MMP KDa
MMP-2
120 75
MMP-9
63 50 40 C
AA
AA
AA CAU CAU
tion above untreated controls for the ER+/PR+ T47D cell
line (P < 0.05 Figure 2b, similarly for MCF7, ZR75-1, and BT474 cells; Additional file 1, Figure S3). Thus, the ability of the cells to survive and proliferate in hostile, anchor-age-independent conditions appeared dependent upon both the source of the ECM and the hormonal status of the cells.
To further analyze the composition of the whole breast ECM, we assessed its protease activity. The stroma can act as a reservoir for matrix metalloproteinases (MMPs), which degrade ECM proteins and process a number of bioactive molecules. In breast tissue, MMP activity con-tributes to epithelial cell death, influences tissue remodel-ing, and has been implicated in cancer invasion and metastasis [33-35]. Gelatin zymography was employed, and in multiple experiments the protease activity of at least two different MMPs was upregulated in the CAU compared to the AA ECM as determined using gelatin zymography (representative gel; Figure 2c). When com-pared to the fibroblast PCR array analysis, there was no significant increase in MMP expression in the CAU fibro-blasts compared to the AA, indicating that cells other than fibroblasts produce MMPs, or that there is increased stimulation of MMP activity in CAU versus AA ECM.
Effects of ECM on tumorigenicity in vivo
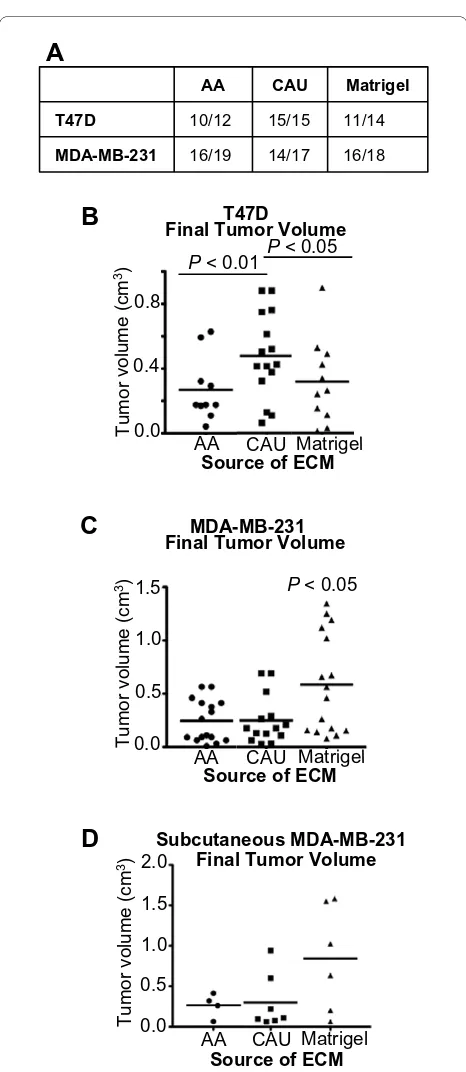
We sought to address whether factors within the breast ECM, removed from the physical presence of stromal cells, could affect the tumorigenicity of breast cancer cells in vivo. As described by McDaniel et al. [26], ER-/PR
-MDA-MB-231 or ER+/PR+ T47D breast cancer cells were
mixed with control matrix (Matrigel), AA or CAU ECM (adjusted for equal protein content) and injected into the abdominal mammary fat pad of female, athymic nude mice. No significant difference in tumor efficiency was observed among the treatments (Figure 3a). However, the CAU ECM significantly increased tumor growth of the ER+/PR+ T47D cells compared to either the AA ECM or
control matrix control (Figure 3b; P < 0.01 and 0.05, respectively). AA ECM elicited no difference in growth compared to the control matrix. The resultant T47D tumors from all treatment groups were ER+; confirming
that hormone status of the cells was retained during tumor formation (data not shown). Tumor morphology and percentage necrosis were similar between treat-ments. These data support the observation that factors within CAU ECM selectively interact with ER+/PR+ cells
to increase their aggressiveness. The in vitro data demon-strating enhanced MMP activity and increased cytokine production in the CAU microenvironment could poten-tially account for this increase in tumor growth.
Conversely, injecting ER-/PR- MDA-MB-231 cells with
ECM derived from either group gave no selective advan-tage in tumor growth. Only cells injected with growth
Figure 3 Caucasian-American derived extracellular matrix mole-cules (ECM) enhances the tumorigenicity of estrogen receptor
(ER)+/progesterone receptor (PR)+ breast cancer cells. (a) Indicates
the number of tumors detected per animals injected. (b,c) Data
repre-sent mean ± SD of the final tumor volume of ER+/PR+ (T47D) or ER-/PR-
(MDA-MB-231) breast cancer cells suspended in the indicated ECM
and injected into the abdominal mammary gland. (d) Data represent
mean ± SD of the final tumor volume of MDA-MB-231 breast cancer cells suspended in the indicated ECM and injected subcutaneously. AA = African-American, CAU = Caucasian-American.
AA CAU Matrigel
T47D 10/12 15/15 11/14
MDA-MB-231 16/19 14/17 16/18
A
Final Tumor Volume
0.8
0.4
0.0
T
u
m
o
r
v
o
lu
m
e
(c
m
3)
Source of ECM
Matrigel
P< 0.05
P< 0.01
B
AA CAU
MDA-MB-231
1.5
0.5 1.0
0.0
T
u
m
o
r
v
o
lu
m
e
(c
m
3) P< 0.05
Source of ECMMatrigel Final Tumor Volume
C
AA CAU
T47D
D
2.0
1.0
0.5
0.0
Source of ECM
1.5
T
u
mor volume (cm
3)
AA CAU Matrigel
factor-rich control matrix had significantly increased final tumor volume (P < 0.05, Figure 3c). To confirm that the ECM's effect on tumorigenicity was not masked due to interactions with the host mammary gland, MDA-MD-231 cells were mixed with control matrix, AA or CAU ECM, adjusted for equal protein content, and injected subcutaneously into athymic nude mice. A simi-lar trend to results obtained from the orthotopic site was observed. Only cells injected with the control matrix had substantially larger final tumor volume compared to cells injected with ECM derived from either group, although no statistically significant difference was observed between either ECM (Figure 3d). No significant differ-ence in tumor latency was observed among the treat-ments.
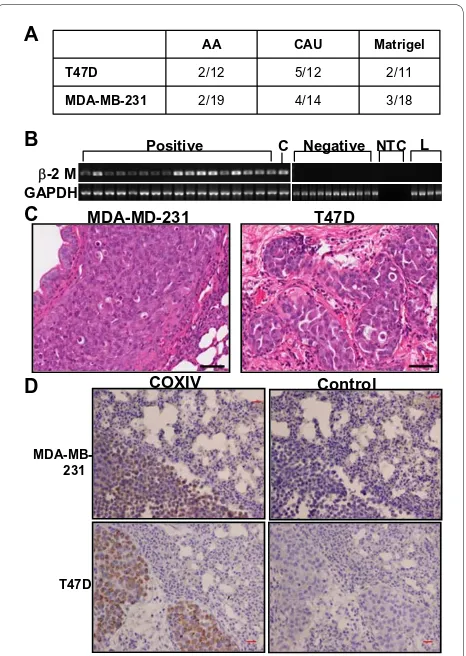
Metastasis to the lung and liver was low for all treat-ments and cell lines tested. Of the 75 lung samples ana-lyzed, only 18 tested positive for lung metastasis via pathological examination, immunohistochemical analysis for human specific COXIV, and qRT-PCR for human β2-microglobin [26] (Figure 4). No liver metastases were found by histological examination. Regardless of the cell type injected, the CAU ECM elicited at least twice the metastases as AA ECM (Figure 4a). Figure 4c depicts rep-resentative images of hematoxylin and eosin (H&E)-stained lungs with overt metastases resulting from the two cell types, and metastatic cells within the lung were detected by a human specific COXIV antibody (Figure 4d). No correlation between the size of the primary tumor and metastasis and no significant difference between the amount of metastasis and treatment was observed for all samples analyzed.
Mass spectrometry analysis of the ECM
To determine whether the overall composition of the ECM differed between premenopausal AAs and CAUs, breast ECM proteins were intimately examined by LC-MS/MS. Three independent ECM extraction ments, using different patient samples for each experi-ment, with at least three patients per group, (that is, a total of six individual ECM pools) were analyzed using LC-MS/MS. Among the 4,288 AA and 4,301 CAU pro-teins identified, only 1,759 were common between the groups. Ingenuity pathways analysis (IPA, Ingenuity Sys-tems, http://www.ingenuity.com) was used for functional analysis of the results. The majority of the high abun-dance proteins (≥30 peptide matches) consisted of struc-tural ECM proteins including numerous collagen species. These were comparatively similar for either group. Therefore, we excluded those identified by ≥30 peptides to focus on those with lower abundance. Additionally, although it is possible to identify a protein from a single peptide match after careful inspection of the fragment's pattern and other characteristics, we excluded these
sin-gle unique peptides and focused our studies on those above two peptide matches. During analysis, proteins reported to be exclusively nuclear were excluded as cellu-lar contamination (23.4% for the AA dataset and 23.0% for the CAU dataset). In addition to ECM structural pro-teins, another distinct feature of the microenvironment is the presence of extracellular matrix vesicles (MV) and exosomes, small sacs secreted from the cell surface which are enclosed by a membrane structurally similar to that of the plasma membrane [36]. Molecules located within MV/exosomes perform diverse functions outside of the cell including growth factor storage and secretion, immune regulation, ECM mineralization, and RNA shut-tling. Interestingly, tumor-associated MV/exosomes have
Figure 4 Caucasian-American extracellular matrix molecules
(ECM) enhances metastasis to lung. (a) Number of animals positive
for lung metastasis per animals injected. (b) Ethidium bromide stained
gel of PCR products; RNA was analyzed by quantitative real-time PCR for lung metastasis using human-specific primers to β2 microglobulin. C = control human cDNA; L = mouse lung cDNA; NTC = no template
control. (c) Representative hematoxylin and eosin (H&E)-stained
mouse lungs with human breast cancer cell metastasis. (d)
Immuno-histochemical detection of metastasized cells with the human-specific antibody COXIV (left panels) or corresponding negative controls (right panels) in mouse lung. Scale bar = 50 μM. AA = African-American, CAU = Caucasian-American.
AA CAU Matrigel
T47D 2/12 5/12 2/11
MDA-MB-231 2/19 4/14 3/18 A
B
C
Positive
EE-2 M
NTC
GAPDH
L Negative
T47D MDA-MD-231
MDA-MB-231
T47D
COXIV Control
D
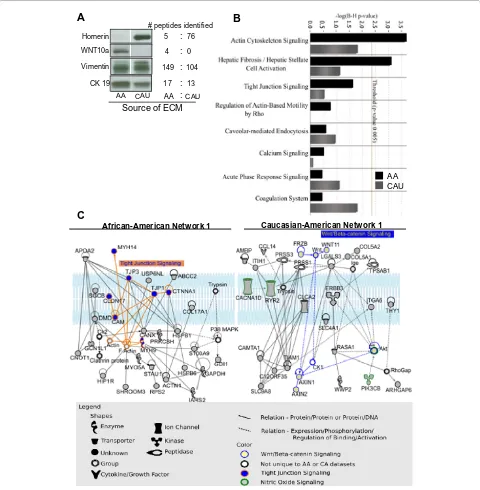
been shown to contribute to the ability of tumor cells to escape immune surveillance, degrade ECM to facilitate invasion, and stimulate angiogenesis [36]. Therefore, no cytosolic proteins that may have been released into the ECM by MV/exosomes were excluded. Representative western blot images of four randomly chosen proteins were selected for validation of LC-MS/MS analysis with their corresponding numbers of peptides identified (Fig-ure 5a, representative spectra shown in Additional file 1, Figure S4).
Pathways analyses by IPA revealed that the actin cytoskeleton signaling and the hepatic fibrosis/hepatic stellate cell activation pathways were only significant for the AA dataset, based on a strict P value threshold of 0.005 and Benjamini-Hochberg correction (Figure 5b). Both of these pathways, as well as tight junction signaling and regulation of actin-based motility by Rho, had numerous molecules in common including Rho-associ-ated kinase (ROCK), actin, and several myosins. The sig-nificant presence of these pathways in only the AA microenvironment implies unique cytoskeletal signaling compared to that in CAU.
To further examine differences among datasets, we analyzed networks created by proteins found exclusively in the AA or the CAU datasets. The network with the highest score for the AA dataset contained seven nodes representing proteins/genes associated with tight junc-tion signaling and actin cytoskeleton signaling pathway (Figure 5c). The top network generated by the CAU data-set contained several other adhesion molecules and the epidermal growth factor receptor ErbB3, which is known to promote epithelial cell growth and antiapoptotic sig-naling. ErbB3 is often overexpressed in human breast cancers, frequently in conjunction with overexpression of the proto-oncogene ErbB2/HER2 [37]. Interestingly, the CAU dataset also contained molecules associated with the Wnt/β-catenin pathway (Figure 5c), whose dysregula-tion has been implicated in breast cancer development and progression [38]. Additional networks for the AA can CAU datasets can be found in Additional file 1, Figures S5a-d and S6a-d.
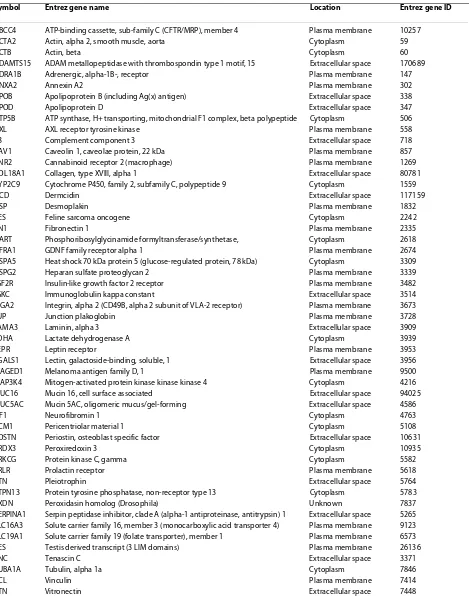
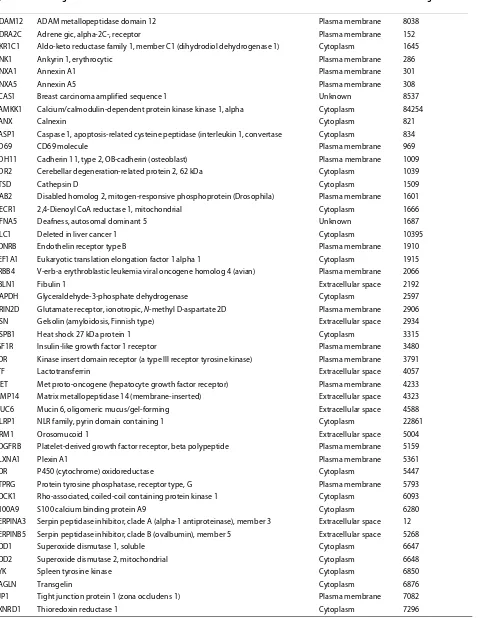
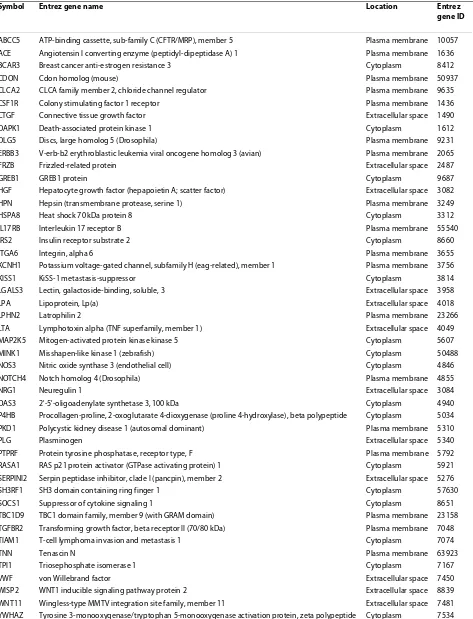
Based on annotations by two manually curated data-bases (IPA and BIOBASE, http://www.biobase-interna-tional.com), similar and unique proteins to each dataset, and their known associations with breast cancer, were examined. The AA and CAU datasets had 52 common molecules (Table 1) and 48 and 47 unique proteins, respectively (Tables 2 and 3). Further functional analyses of these proteins indicated that the AA dataset were mainly related to initiation events, including tumorigene-sis and neoplasia. Alternatively, the proteins unique to the CAU dataset were primarily involved with tumor growth or metastasis.
Biologically active estrogen and androgen metabolites
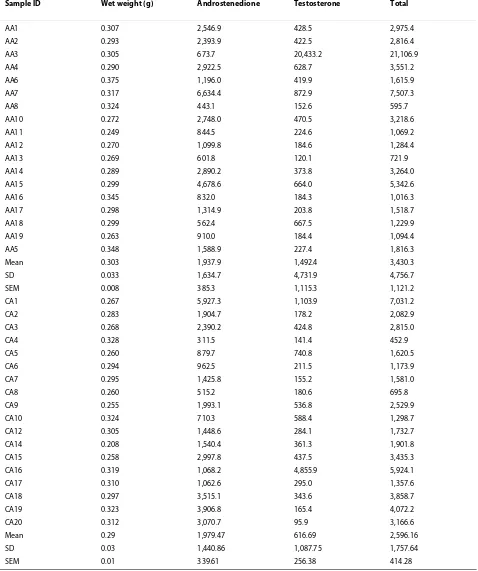
In this study, we show that CAU-derived ECM enhanced the aggressiveness of ER+/PR+ breast cancer cells,
sug-gesting the microenvironment from which the ECM was derived may have been exposed to a different hormonal milieu compared to the AA. Therefore, the hormones present in the breast microenvironment were quantita-tively measured by a novel method of LC-MS/MS that simultaneously extracted and analyzed biologically active estrogen and androgen metabolites present in whole tis-sue samples. Breast tistis-sues from fasting, premenopausal AA and CAU women (median age 32 and 31, respec-tively; n = 19 AA and 20 CAU) were analyzed. Both androstenedione and testosterone were detected in all tissues (Figure 6a, Table 4). Testosterone appeared ele-vated in the AA breast tissue; however, this observation was not statistically significant. It is of note that andro-gens levels were significantly higher in breast tissue com-pared to estrogens (P < 0.001, Tables 4 and 5), similar to what has been repeatedly observed in blood. More importantly, these results shows that the unconjugated biologically active estrogens found in premenopausal breast tissues were higher than those reported in blood [39]. These results warrant further study given the role of estrogen metabolites in tumorigenesis.
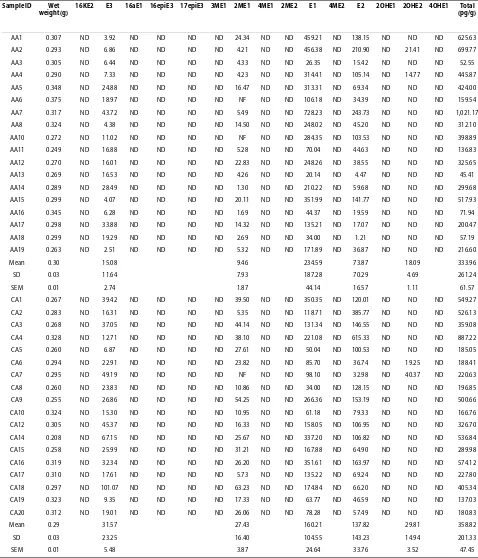
Of the 15 estrogen metabolites measured, only 5 were readily detectable as intrinsic components of breast tis-sue: estrone, estradiol, estriol, methoxyestrone, and 2-hydroxyestradiol (Table 5). Estradiol, estriol and 2-meth-oxyestrone were significantly higher in the CAU breast tissue (P < 0.005), which was unanticipated given that previous studies have shown that premenopausal AA women have higher plasma concentrations of estrogens [40,41]. Additionally, tissue levels of 2-hydroxyestradiol, a known carcinogen, were also detected in two patient samples, one from each group (Table 5, mean pg/g = 18.1 ± 4.7 for AA and 29.8 ± 14.9 for CAU). The data pre-sented here advocate for a more intensive analysis of the hormonal milieu of the breast microenvironment in addi-tion to plasma levels, since local hormones are directly responsible for mediating cellular function and influence tumorigenesis.
Discussion
One limitation of this study, which must be addressed, is the lack of descriptive clinical data on the breast tissue isolated from the reduction mammoplasty patients. The tissue collected for fibroblast and whole breast tissue ECM isolation were considered pathological medical waste; therefore, informative clinical data including
par-ity, body mass index, breast denspar-ity, oral contraceptive use, phase of menstrual cycle were not available. Whether these important factors potentially had confounding effects on the observed results is regrettably unknown. In attempts to limit these effects, each experiment con-tained multiple replicates, and was repeated using as Figure 5 Proteomic analysis of African-American and Caucasian-American breast extracellular matrix molecules (ECM). (a) Western blot of
proteins identified by mass spectrometry with corresponding identified peptides. (b) Datasets of proteins unique to African-American or
Caucasian-American ECM grouped according to significant association to canonical pathways. B-H = Benjamini-Hochberg. (c) In silico analysis of proteins: top
signaling network of proteins unique to the African-American (left) or American (right) datasets. AA = African-American, CAU = Caucasian-American.
African-American Network 1 Caucasian-American Network 1
C
WNT10a
Vimentin
CK 19 Hornerin
Source of ECM AA CAU
# peptides identified 5
4
149
17
AA :CAU 76
0
104
13 : : : :
A
b
b
AA CAU
Table 1: Proteins found in both African-American and Caucasian-American datasets reported to be involved in breast cancer, as annotated by Ingenuity Systems or BIOBASE.
Symbol Entrez gene name Location Entrez gene ID
ABCC4 ATP-binding cassette, sub-family C (CFTR/MRP), member 4 Plasma membrane 10257
ACTA2 Actin, alpha 2, smooth muscle, aorta Cytoplasm 59
ACTB Actin, beta Cytoplasm 60
ADAMTS15 ADAM metallopeptidase with thrombospondin type 1 motif, 15 Extracellular space 170689
ADRA1B Adrenergic, alpha-1B-, receptor Plasma membrane 147
ANXA2 Annexin A2 Plasma membrane 302
APOB Apolipoprotein B (including Ag(x) antigen) Extracellular space 338
APOD Apolipoprotein D Extracellular space 347
ATP5B ATP synthase, H+ transporting, mitochondrial F1 complex, beta polypeptide Cytoplasm 506
AXL AXL receptor tyrosine kinase Plasma membrane 558
C3 Complement component 3 Extracellular space 718
CAV1 Caveolin 1, caveolae protein, 22 kDa Plasma membrane 857
CNR2 Cannabinoid receptor 2 (macrophage) Plasma membrane 1269
COL18A1 Collagen, type XVIII, alpha 1 Extracellular space 80781
CYP2C9 Cytochrome P450, family 2, subfamily C, polypeptide 9 Cytoplasm 1559
DCD Dermcidin Extracellular space 117159
DSP Desmoplakin Plasma membrane 1832
FES Feline sarcoma oncogene Cytoplasm 2242
FN1 Fibronectin 1 Plasma membrane 2335
GART Phosphoribosylglycinamide formyltransferase/synthetase, Cytoplasm 2618
GFRA1 GDNF family receptor alpha 1 Plasma membrane 2674
HSPA5 Heat shock 70 kDa protein 5 (glucose-regulated protein, 78 kDa) Cytoplasm 3309
HSPG2 Heparan sulfate proteoglycan 2 Plasma membrane 3339
IGF2R Insulin-like growth factor 2 receptor Plasma membrane 3482
IGKC Immunoglobulin kappa constant Extracellular space 3514
ITGA2 Integrin, alpha 2 (CD49B, alpha 2 subunit of VLA-2 receptor) Plasma membrane 3673
JUP Junction plakoglobin Plasma membrane 3728
LAMA3 Laminin, alpha 3 Extracellular space 3909
LDHA Lactate dehydrogenase A Cytoplasm 3939
LEPR Leptin receptor Plasma membrane 3953
LGALS1 Lectin, galactoside-binding, soluble, 1 Extracellular space 3956
MAGED1 Melanoma antigen family D, 1 Plasma membrane 9500
MAP3K4 Mitogen-activated protein kinase kinase kinase 4 Cytoplasm 4216 MUC16 Mucin 16, cell surface associated Extracellular space 94025 MUC5AC Mucin 5AC, oligomeric mucus/gel-forming Extracellular space 4586
NF1 Neurofibromin 1 Cytoplasm 4763
PCM1 Pericentriolar material 1 Cytoplasm 5108
POSTN Periostin, osteoblast specific factor Extracellular space 10631
PRDX3 Peroxiredoxin 3 Cytoplasm 10935
PRKCG Protein kinase C, gamma Cytoplasm 5582
PRLR Prolactin receptor Plasma membrane 5618
PTN Pleiotrophin Extracellular space 5764
PTPN13 Protein tyrosine phosphatase, non-receptor type 13 Cytoplasm 5783
PXDN Peroxidasin homolog (Drosophila) Unknown 7837
SERPINA1 Serpin peptidase inhibitor, clade A (alpha-1 antiproteinase, antitrypsin) 1 Extracellular space 5265 SLC16A3 Solute carrier family 16, member 3 (monocarboxylic acid transporter 4) Plasma membrane 9123 SLC19A1 Solute carrier family 19 (folate transporter), member 1 Plasma membrane 6573 TES Testis derived transcript (3 LIM domains) Plasma membrane 26136
TNC Tenascin C Extracellular space 3371
TUBA1A Tubulin, alpha 1a Cytoplasm 7846
VCL Vinculin Plasma membrane 7414
Table 2: Proteins found unique to the African-American dataset that are reported to be involved in breast cancer, as annotated by Ingenuity Systems or BIOBASE.
Symbol Entrez gene name Location Entrez gene ID
ADAM12 ADAM metallopeptidase domain 12 Plasma membrane 8038
ADRA2C Adrene gic, alpha-2C-, receptor Plasma membrane 152
AKR1C1 Aldo-keto reductase family 1, member C1 (dihydrodiol dehydrogenase 1) Cytoplasm 1645
ANK1 Ankyrin 1, erythrocytic Plasma membrane 286
ANXA1 Annexin A1 Plasma membrane 301
ANXA5 Annexin A5 Plasma membrane 308
BCAS1 Breast carcinoma amplified sequence 1 Unknown 8537
CAMKK1 Calcium/calmodulin-dependent protein kinase kinase 1, alpha Cytoplasm 84254
CANX Calnexin Cytoplasm 821
CASP1 Caspase 1, apoptosis-related cysteine peptidase (interleukin 1, convertase Cytoplasm 834
CD69 CD69 molecule Plasma membrane 969
CDH11 Cadherin 11, type 2, OB-cadherin (osteoblast) Plasma membrane 1009 CDR2 Cerebellar degeneration-related protein 2, 62 kDa Cytoplasm 1039
CTSD Cathepsin D Cytoplasm 1509
DAB2 Disabled homolog 2, mitogen-responsive phosphoprotein (Drosophila) Plasma membrane 1601
DECR1 2,4-Dienoyl CoA reductase 1, mitochondrial Cytoplasm 1666
DFNA5 Deafness, autosomal dominant 5 Unknown 1687
DLC1 Deleted in liver cancer 1 Cytoplasm 10395
EDNRB Endothelin receptor type B Plasma membrane 1910
EEF1A1 Eukaryotic translation elongation factor 1 alpha 1 Cytoplasm 1915 ERBB4 V-erb-a erythroblastic leukemia viral oncogene homolog 4 (avian) Plasma membrane 2066
FBLN1 Fibulin 1 Extracellular space 2192
GAPDH Glyceraldehyde-3-phosphate dehydrogenase Cytoplasm 2597
GRIN2D Glutamate receptor, ionotropic, N-methyl D-aspartate 2D Plasma membrane 2906 GSN Gelsolin (amyloidosis, Finnish type) Extracellular space 2934
HSPB1 Heat shock 27 kDa protein 1 Cytoplasm 3315
IGF1R Insulin-like growth factor 1 receptor Plasma membrane 3480 KDR Kinase insert domain receptor (a type III receptor tyrosine kinase) Plasma membrane 3791
LTF Lactotransferrin Extracellular space 4057
MET Met proto-oncogene (hepatocyte growth factor receptor) Plasma membrane 4233 MMP14 Matrix metallopeptidase 14 (membrane-inserted) Extracellular space 4323 MUC6 Mucin 6, oligomeric mucus/gel-forming Extracellular space 4588
NLRP1 NLR family, pyrin domain containing 1 Cytoplasm 22861
ORM1 Orosomucoid 1 Extracellular space 5004
PDGFRB Platelet-derived growth factor receptor, beta polypeptide Plasma membrane 5159
PLXNA1 Plexin A1 Plasma membrane 5361
POR P450 (cytochrome) oxidoreductase Cytoplasm 5447
PTPRG Protein tyrosine phosphatase, receptor type, G Plasma membrane 5793 ROCK1 Rho-associated, coiled-coil containing protein kinase 1 Cytoplasm 6093
S100A9 S100 calcium binding protein A9 Cytoplasm 6280
SERPINA3 Serpin peptidase inhibitor, clade A (alpha-1 antiproteinase), member 3 Extracellular space 12 SERPINB5 Serpin peptidase inhibitor, clade B (ovalbumin), member 5 Extracellular space 5268
SOD1 Superoxide dismutase 1, soluble Cytoplasm 6647
SOD2 Superoxide dismutase 2, mitochondrial Cytoplasm 6648
SYK Spleen tyrosine kinase Cytoplasm 6850
TAGLN Transgelin Cytoplasm 6876
TJP1 Tight junction protein 1 (zona occludens 1) Plasma membrane 7082
Table 3: Proteins found unique to the Caucasian-American dataset that are reported to be involved in breast cancer, as annotated by Ingenuity Systems or BIOBASE.
Symbol Entrez gene name Location Entrez
gene ID
ABCC5 ATP-binding cassette, sub-family C (CFTR/MRP), member 5 Plasma membrane 10057 ACE Angiotensin I converting enzyme (peptidyl-dipeptidase A) 1 Plasma membrane 1636
BCAR3 Breast cancer anti-estrogen resistance 3 Cytoplasm 8412
CDON Cdon homolog (mouse) Plasma membrane 50937
CLCA2 CLCA family member 2, chloride channel regulator Plasma membrane 9635
CSF1R Colony stimulating factor 1 receptor Plasma membrane 1436
CTGF Connective tissue growth factor Extracellular space 1490
DAPK1 Death-associated protein kinase 1 Cytoplasm 1612
DLG5 Discs, large homolog 5 (Drosophila) Plasma membrane 9231
ERBB3 V-erb-b2 erythroblastic leukemia viral oncogene homolog 3 (avian) Plasma membrane 2065
FRZB Frizzled-related protein Extracellular space 2487
GREB1 GREB1 protein Cytoplasm 9687
HGF Hepatocyte growth factor (hepapoietin A; scatter factor) Extracellular space 3082
HPN Hepsin (transmembrane protease, serine 1) Plasma membrane 3249
HSPA8 Heat shock 70 kDa protein 8 Cytoplasm 3312
IL17RB Interleukin 17 receptor B Plasma membrane 55540
IRS2 Insulin receptor substrate 2 Cytoplasm 8660
ITGA6 Integrin, alpha 6 Plasma membrane 3655
KCNH1 Potassium voltage-gated channel, subfamily H (eag-related), member 1 Plasma membrane 3756
KISS1 KiSS-1 metastasis-suppressor Cytoplasm 3814
LGALS3 Lectin, galactoside-binding, soluble, 3 Extracellular space 3958
LPA Lipoprotein, Lp(a) Extracellular space 4018
LPHN2 Latrophilin 2 Plasma membrane 23266
LTA Lymphotoxin alpha (TNF superfamily, member 1) Extracellular space 4049
MAP2K5 Mitogen-activated protein kinase kinase 5 Cytoplasm 5607
MINK1 Misshapen-like kinase 1 (zebrafish) Cytoplasm 50488
NOS3 Nitric oxide synthase 3 (endothelial cell) Cytoplasm 4846
NOTCH4 Notch homolog 4 (Drosophila) Plasma membrane 4855
NRG1 Neuregulin 1 Extracellular space 3084
OAS3 2'-5'-oligoadenylate synthetase 3, 100 kDa Cytoplasm 4940
P4HB Procollagen-proline, 2-oxoglutarate 4-dioxygenase (proline 4-hydroxylase), beta polypeptide Cytoplasm 5034 PKD1 Polycystic kidney disease 1 (autosomal dominant) Plasma membrane 5310
PLG Plasminogen Extracellular space 5340
PTPRF Protein tyrosine phosphatase, receptor type, F Plasma membrane 5792 RASA1 RAS p21 protein activator (GTPase activating protein) 1 Cytoplasm 5921 SERPINI2 Serpin peptidase inhibitor, clade I (pancpin), member 2 Extracellular space 5276
SH3RF1 SH3 domain containing ring finger 1 Cytoplasm 57630
SOCS1 Suppressor of cytokine signaling 1 Cytoplasm 8651
TBC1D9 TBC1 domain family, member 9 (with GRAM domain) Plasma membrane 23158 TGFBR2 Transforming growth factor, beta receptor II (70/80 kDa) Plasma membrane 7048
TIAM1 T-cell lymphoma invasion and metastasis 1 Cytoplasm 7074
TNN Tenascin N Plasma membrane 63923
TPI1 Triosephosphate isomerase 1 Cytoplasm 7167
VWF von Willebrand factor Extracellular space 7450
Table 4: Unconjugated biologically active androgens (pg/g) detected in breast tissue.
Sample ID Wet weight (g) Androstenedione Testosterone Total
AA1 0.307 2,546.9 428.5 2,975.4
AA2 0.293 2,393.9 422.5 2,816.4
AA3 0.305 673.7 20,433.2 21,106.9
AA4 0.290 2,922.5 628.7 3,551.2
AA6 0.375 1,196.0 419.9 1,615.9
AA7 0.317 6,634.4 872.9 7,507.3
AA8 0.324 443.1 152.6 595.7
AA10 0.272 2,748.0 470.5 3,218.6
AA11 0.249 844.5 224.6 1,069.2
AA12 0.270 1,099.8 184.6 1,284.4
AA13 0.269 601.8 120.1 721.9
AA14 0.289 2,890.2 373.8 3,264.0
AA15 0.299 4,678.6 664.0 5,342.6
AA16 0.345 832.0 184.3 1,016.3
AA17 0.298 1,314.9 203.8 1,518.7
AA18 0.299 562.4 667.5 1,229.9
AA19 0.263 910.0 184.4 1,094.4
AA5 0.348 1,588.9 227.4 1,816.3
Mean 0.303 1,937.9 1,492.4 3,430.3
SD 0.033 1,634.7 4,731.9 4,756.7
SEM 0.008 385.3 1,115.3 1,121.2
CA1 0.267 5,927.3 1,103.9 7,031.2
CA2 0.283 1,904.7 178.2 2,082.9
CA3 0.268 2,390.2 424.8 2,815.0
CA4 0.328 311.5 141.4 452.9
CA5 0.260 879.7 740.8 1,620.5
CA6 0.294 962.5 211.5 1,173.9
CA7 0.295 1,425.8 155.2 1,581.0
CA8 0.260 515.2 180.6 695.8
CA9 0.255 1,993.1 536.8 2,529.9
CA10 0.324 710.3 588.4 1,298.7
CA12 0.305 1,448.6 284.1 1,732.7
CA14 0.208 1,540.4 361.3 1,901.8
CA15 0.258 2,997.8 437.5 3,435.3
CA16 0.319 1,068.2 4,855.9 5,924.1
CA17 0.310 1,062.6 295.0 1,357.6
CA18 0.297 3,515.1 343.6 3,858.7
CA19 0.323 3,906.8 165.4 4,072.2
CA20 0.312 3,070.7 95.9 3,166.6
Mean 0.29 1,979.47 616.69 2,596.16
SD 0.03 1,440.86 1,087.75 1,757.64
SEM 0.01 339.61 256.38 414.28
SEM = standard error of the mean.
many different pools of patient samples feasible. A total of 50 CAU and 53 AA samples were used in the different analyses. However, the possibility remains that inherent factors from the tissue source could remain.
Table 5: Unconjugated biologically active estrogens (pg/g) detected in breast tissue.
Sample ID Wet weight (g)
16KE2 E3 16aE1 16epiE3 17epiE3 3ME1 2ME1 4ME1 2ME2 E1 4ME2 E2 2OHE1 2OHE2 4OHE1 Total (pg/g)
AA1 0.307 ND 3.92 ND ND ND ND 24.34 ND ND 459.21 ND 138.15 ND ND ND 625.63
AA2 0.293 ND 6.86 ND ND ND ND 4.21 ND ND 456.38 ND 210.90 ND 21.41 ND 699.77
AA3 0.305 ND 6.44 ND ND ND ND 4.33 ND ND 26.35 ND 15.42 ND ND ND 52.55
AA4 0.290 ND 7.33 ND ND ND ND 4.23 ND ND 314.41 ND 105.14 ND 14.77 ND 445.87
AA5 0.348 ND 24.88 ND ND ND ND 16.47 ND ND 313.31 ND 69.34 ND ND ND 424.00
AA6 0.375 ND 18.97 ND ND ND ND NF ND ND 106.18 ND 34.39 ND ND ND 159.54
AA7 0.317 ND 43.72 ND ND ND ND 5.49 ND ND 728.23 ND 243.73 ND ND ND 1,021.17
AA8 0.324 ND 4.38 ND ND ND ND 14.50 ND ND 248.02 ND 45.20 ND ND ND 312.10
AA10 0.272 ND 11.02 ND ND ND ND NF ND ND 284.35 ND 103.53 ND ND ND 398.89
AA11 0.249 ND 16.88 ND ND ND ND 5.28 ND ND 70.04 ND 44.63 ND ND ND 136.83
AA12 0.270 ND 16.01 ND ND ND ND 22.83 ND ND 248.26 ND 38.55 ND ND ND 325.65
AA13 0.269 ND 16.53 ND ND ND ND 4.26 ND ND 20.14 ND 4.47 ND ND ND 45.41
AA14 0.289 ND 28.49 ND ND ND ND 1.30 ND ND 210.22 ND 59.68 ND ND ND 299.68
AA15 0.299 ND 4.07 ND ND ND ND 20.11 ND ND 351.99 ND 141.77 ND ND ND 517.93
AA16 0.345 ND 6.28 ND ND ND ND 1.69 ND ND 44.37 ND 19.59 ND ND ND 71.94
AA17 0.298 ND 33.88 ND ND ND ND 14.32 ND ND 135.21 ND 17.07 ND ND ND 200.47
AA18 0.299 ND 19.29 ND ND ND ND 2.69 ND ND 34.00 ND 1.21 ND ND ND 57.19
AA19 0.263 ND 2.51 ND ND ND ND 5.32 ND ND 171.89 ND 36.87 ND ND ND 216.60
Mean 0.30 15.08 9.46 234.59 73.87 18.09 333.96
SD 0.03 11.64 7.93 187.28 70.29 4.69 261.24
SEM 0.01 2.74 1.87 44.14 16.57 1.11 61.57
CA1 0.267 ND 39.42 ND ND ND ND 39.50 ND ND 350.35 ND 120.01 ND ND ND 549.27
CA2 0.283 ND 16.31 ND ND ND ND 5.35 ND ND 118.71 ND 385.77 ND ND ND 526.13
CA3 0.268 ND 37.05 ND ND ND ND 44.14 ND ND 131.34 ND 146.55 ND ND ND 359.08
CA4 0.328 ND 12.71 ND ND ND ND 38.10 ND ND 221.08 ND 615.33 ND ND ND 887.22
CA5 0.260 ND 6.87 ND ND ND ND 27.61 ND ND 50.04 ND 100.53 ND ND ND 185.05
CA6 0.294 ND 22.91 ND ND ND ND 23.82 ND ND 85.70 ND 36.74 ND 19.25 ND 188.41
CA7 0.295 ND 49.19 ND ND ND ND NF ND ND 98.10 ND 32.98 ND 40.37 ND 220.63
CA8 0.260 ND 23.83 ND ND ND ND 10.86 ND ND 34.00 ND 128.15 ND ND ND 196.85
CA9 0.255 ND 26.86 ND ND ND ND 54.25 ND ND 266.36 ND 153.19 ND ND ND 500.66
CA10 0.324 ND 15.30 ND ND ND ND 10.95 ND ND 61.18 ND 79.33 ND ND ND 166.76
CA12 0.305 ND 45.37 ND ND ND ND 16.33 ND ND 158.05 ND 106.95 ND ND ND 326.70
CA14 0.208 ND 67.15 ND ND ND ND 25.67 ND ND 337.20 ND 106.82 ND ND ND 536.84
CA15 0.258 ND 25.99 ND ND ND ND 31.21 ND ND 167.88 ND 64.90 ND ND ND 289.98
CA16 0.319 ND 32.34 ND ND ND ND 26.20 ND ND 351.61 ND 163.97 ND ND ND 574.12
CA17 0.310 ND 17.61 ND ND ND ND 5.73 ND ND 135.22 ND 69.24 ND ND ND 227.80
CA18 0.297 ND 101.07 ND ND ND ND 63.23 ND ND 174.84 ND 66.20 ND ND ND 405.34
CA19 0.323 ND 9.35 ND ND ND ND 17.33 ND ND 63.77 ND 46.59 ND ND ND 137.03
CA20 0.312 ND 19.01 ND ND ND ND 26.06 ND ND 78.28 ND 57.49 ND ND ND 180.83
Mean 0.29 31.57 27.43 160.21 137.82 29.81 358.82
SD 0.03 23.25 16.40 104.55 143.23 14.94 201.33
SEM 0.01 5.48 3.87 24.64 33.76 3.52 47.45
ND = not detected; SEM = standard error of the mean.
whether clinical factors, or genetics, or a combination of the two, systematically relate as to why AAs develop a more aggressive cancer is not the purpose of this study. The objective of this study was not to determine how
these experiments. Although pooled samples are not ideal, a consistent pattern was observed with all results obtained even in this potentially confounding situation. Since no patient sample could be used twice, this suggests that our conclusions were not skewed by any single sam-ple. Future studies to determine specific components in ECM responsible for these effects will require examina-tion of individual tissues, if enough material becomes available from a single patient. Overall, the results pre-sented provide valuable data for further investigation into the role of the microenvironment in cancer disparities, and potentially as a basis for future studies investigating factors such as parity and phase of menstrual cycle on breast cancer cell behavior.
Collectively, the data presented in this report suggest that the AA breast microenvironment is less permissive of tumor growth compared to the CAU breast microenvi-ronment. Therefore, it is not surprising that only the more aggressive cells are able to survive and proliferate unrestrictedly in the suppressive microenvironment of AA breast tissue. The comparatively suppressive effects of the AA ECM may arise from both a physical restriction due to the types of structural material present in the ECM, and chemically from the signals present, or absent, in the microenvironment. Numerous reports have
indi-cated that the spatial organization and composition of the ECM influence mammary cell behavior, and that altera-tions in ECM receptor expression facilitate malignant transformation [42].
The premenopausal stroma is not a static compart-ment; proliferation in the breast varies with the men-strual cycle, which requires the expansion and deposition of new ECM [43]. Increased deposition of molecules such as collagen can alter the ECM biophysical properties and increase extracellular cellular tension. ECM composition and rigidity modulate cell-ECM interactions and have a significant impact on cell functions. Indeed, mammary epithelial cells cultured on matrices with increased stiff-ness have disrupted cell-cell junctions, increased prolifer-ation, perturbed endogenous basement membrane assembly, and a dedifferentiated phenotype [44,45]. The development of breast cancer is characterized by the loss of tissue organization and an increase in tissue rigidity, suggesting that aberrant tension may facilitate the acqui-sition of a malignant phenotype [45]. For example, pri-mary mampri-mary epithelial cells cultured on floating collagen gels were shown to differentiate in response to lactogenic hormones only when plated on collagen gels with reduced tensional forces. When plated on gels with increased tension, the extracellular forces promoted cell Figure 6 Detection of estrogens and androgens in whole breast tissue. Data represent the mean (n = 18 African-American (AA) and 20
Cauca-sian-American (CAU)) of biologically active androgens (a) or estrogens (b) ± standard error analyzed via chromatography-tandem mass spectrometry.
*P < 0.005; Wilcoxon matched pairs or paired t test, accordingly.
2500
2000
1500
1000
500
0
A
n
d
ro
g
e
n
s
in
b
re
a
s
t
tis
s
u
e
(p
g
/g
)
3000
An dro
ste ne
dio ne Te
sto stero
ne
A
Unconjugated
biologically-active Androgens
250
200
150
100
50
0
E
s
tr
o
g
e
n
s
in
b
re
a
s
t
ti
s
s
u
e
(p
g
/g
)
B
Estriol Estrone Estradiol
*
*
*
Unconjugated
biologically-active Estrogens
AA CAU
2-Methoxyestrone AA