R E S E A R C H
Open Access
Performance evaluation for MOTIFSIM
Ngoc Tam L. Tran
*and Chun-Hsi Huang
Abstract
Background:Previous studies show various results obtained from different motif finders for an identical dataset. This is largely due to the fact that these tools use different strategies and possess unique features for discovering the motifs. Hence, using multiple tools and methods has been suggested because the motifs commonly reported by them are more likely to be biologically significant.
Results:The common significant motifs from multiple tools can be obtained by using MOTIFSIM tool. In this work, we evaluated the performance of MOTIFSIM in three aspects. First, we compared the pair-wise comparison technique of MOTIFSIM with the un-gapped Smith-Waterman algorithm and four common distance metrics: average Kullback-Leibler, average log-likelihood ratio, Chi-Square distance, and Pearson Correlation Coefficient. Second, we compared the performance of MOTIFSIM with RSAT Matrix-clustering tool for motif clustering. Lastly, we evaluated the performances of nineteen motif finders and the reliability of MOTIFSIM for identifying the common significant motifs from multiple tools.
Conclusions:The pair-wise comparison results reveal that MOTIFSIM attains better performance than the un-gapped Smith-Waterman algorithm and four distance metrics. The clustering results also demonstrate that MOTIFSIM achieves similar or even better performance than RSAT Matrix-clustering. Furthermore, the findings indicate if the motif detection does not require a special tool for detecting a specific type of motif then using multiple motif finders and combining with MOTIFSIM for obtaining the common significant motifs, it improved the results for DNA motif detection.
Keywords:Binding sites, DNA motif, Motif detection tool, Motif similarity comparison, Motif clustering, Merging similar motifs
Background
Transcription factors (TFs) are proteins that can bind to several regions of DNA. The binding regions are short sequences of DNA called transcription factor binding sites (TFBSs). They typically range from 8-10 to 16–20 bp [1]. The TFs bind to DNA in a particular way that the binding sites are similar and they differ only by some nucleotides from one another [1]. Sev-eral similar binding sites form a binding site motif. The binding between TFs and DNA has an important role in gene expression as it controls several vital processes in development, responses to environmental stresses, diseases, and many others [2]. Detecting binding site motifs can reveal the TFs that control the gene expression. Thus, numerous motif finders have been developed such as MEME [3], DREME [4],
MEME-ChIP [5], CisFinder [6], RSAT peak-motifs [7], PScanChIP [8], and W-ChIPMotifs [9] among many others. We reviewed nine Web tools for finding binding site motifs in ChIP-Seq data [10]. The results reveal that different tools reported different results for an identical dataset. The cause is that they implemented different algorithms and possess unique features for discovering the motifs. Hence, using mul-tiple tools and methods has been advised because the motifs commonly reported by them are more likely to be biologically significant [10]. Nevertheless, the re-sults from multiple tools need to be compared for identifying the common significant motifs. MOTIF-SIM tool was designed for this purpose in our previ-ous studies [11, 12].
In this work, we evaluated the performance of MOTIF-SIM in three aspects. First, we compared the pair-wise comparison technique of MOTIFSIM with the un-gapped Smith-Waterman (USW) algorithm [13] and four * Correspondence:[email protected]
Department of Computer Science and Engineering, University of Connecticut, Storrs, CT 06269, USA
© The Author(s). 2018Open Access This article is distributed under the terms of the Creative Commons Attribution 4.0 International License (http://creativecommons.org/licenses/by/4.0/), which permits unrestricted use, distribution, and reproduction in any medium, provided you give appropriate credit to the original author(s) and the source, provide a link to the Creative Commons license, and indicate if changes were made. The Creative Commons Public Domain Dedication waiver
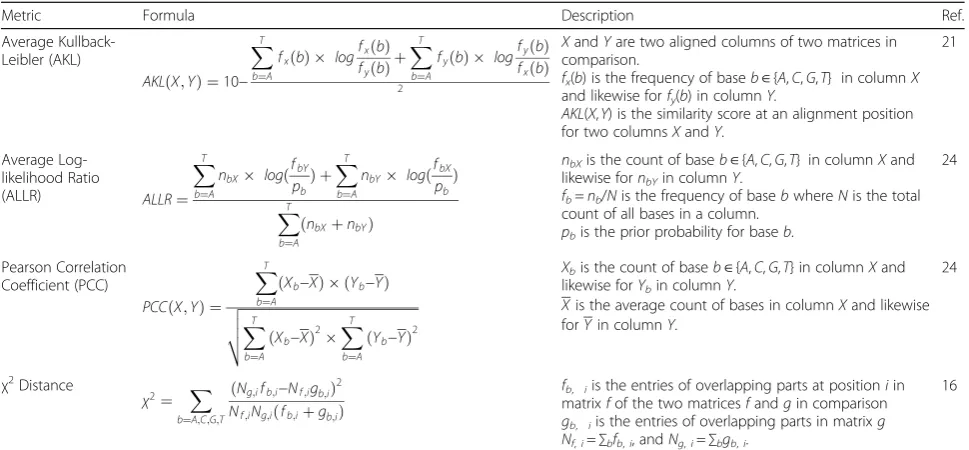
common distance metrics namely average Kullback-Lei-bler (AKL) [14], average log-likelihood ratio (ALLR) [15], Chi-Square distance (CS) [16], and Pearson Correlation Coefficient (PCC) [17]. Second, we compared MOTIFSIM with RSAT matrix-clustering tool for motif clustering [18]. Finally, we assessed the performances of nineteen motif finders and the reliability of MOTIFSIM for identi-fying the common significant motifs from multiple tools.
Methods
The reader can find the original MOTIFSIM algorithm in the Additional file1. A detailed discussion of this al-gorithm can be found in [11] and a slightly modified ver-sion of it can also be found in [12].
Assessing MOTIFSIM algorithm for pair-wise motif comparison
We evaluated MOTIFSIM for both string-based and matrix-based pair-wise comparisons. For string-based comparison, we compared MOTIFSIM with the USW algorithm. The motifs are in IUPAC string format [19]. We implemented the NUC.4.4 substitution matrix for this comparison [20]. We chose USW as it has been studied by Mahony et al. for motif similarity comparison and the authors showed it is more effi-cient when it is used with other column metric [21]. For matrix-based comparison, we assume the columns are independent in the matrices. We compared MOTIFSIM with AKL, ALLR, CS, and PCC. These distance metrics have been used in several studies for measuring similarity between motifs [16, 21–24]. We used a minimum overlapping window of four columns for pair-wise comparisons as presented in [11]. For each overlapping position between two matrices in both forward and backward directions including their reverse complements, we calculated a similarity score between them by using AKL, ALLR, CS, PCC, and MOTIFSIM.
Un-gapped Smith-Waterman algorithm
The Smith-Waterman (SW) algorithm is a local pair-wise sequence alignment for finding the local re-gions that have highest similarity between two se-quences. In this assessment, we did not allow gaps for local alignment. The USW pair-wise sequence alignment returns a best raw score S. To obtain the statistical sig-nificance for this raw score, we calculated the expected number of un-gapped alignments with score S found with random sequences by using eq. (1) [25].
E Sð Þ ¼Kmne−λS ð1Þ
whereSis a raw score of the alignment,mandnare the lengths of two sequences, K and λ are Karlin-Altschult
statistics parameters, andEis theE-value of the scoreS. BLAST uses K= 0.132 and λ= 0.316 [26, 27]. In this evaluation, we used K= 0.1 and λ= 0.3. Since we com-pared a given motif with several other motifs, we selected the smallestE-value for determining the best match for a given motif. This E-value is the expected number of se-quences that produce the same or better score by chance. To perform a pair-wise comparison using MOTIFSIM, we used a similarity threshold of 75% or more. This threshold has been evaluated in our previous study and showed to be efficient for comparison [11].
Distance metrics
Table 1shows four distance metrics for comparing with MOTIFSIM. The AKL is the weighted average of log-likelihood ratio distance between two distributions [21]. We adopted it from Mahony et al. [21]. The au-thors subtract the AKL score from 10 to convert it into a similarity score. The ALLR was adopted from Schones et al. [24]. It is a weighted sum of two log-likelihood ra-tios that was introduced by Wang and Stormo [24]. We used a prior probability of 0.25 for base b for this dis-tance metric. We also implemented the PCC from Schones et al. [24]. The PCC is a popular metric for measuring the correlation between two sets of variables. In this case, they are two aligned columns of two matri-ces. We calculated the score for an alignment position between two matrices by taking the sum of individual column comparison scores for three distance metrics above. We adopted the Fisher-Irwin exact test that was used by Schones et al. [24] for calculating theP-value of a similarity score obtained at an alignment position of two columns X and Y. The P-value for an alignment position between two matrices is the product ofP-values of the individual columns [24]. We used aP-value≤0.05 for filtering out the insignificant scores as they indicate a significant dissimilarity between two matrices. Thus, a largerP-value indicates more similar between two matri-ces. We selected the largestP-value to represent the best alignment between two matrices.
Lastly, we adopted theχ2distance from Kielbasa et al. for comparing with MOTIFSIM [16]. It is also a popular metric for measuring the distance between position fre-quency matrices. We calculated the χ2 distance for the aligned columns at position i by using the equation in Table 1. We used a threshold ≤7.81, which corresponds
to a P-value ≤0.05 for selecting a significant similarity
MOTIFSIM
The core of MOTIFSIM algorithm is pair-wise align-ments of position specific probability matrices (PSPMs). The similarity score of an alignment can be selected by using the percentage. In our previous study [11], it showed a 75% or more to be an efficient threshold for filtering the motifs. Hence, we used this threshold here again for comparisons.
Motif clustering comparison
The core of Matrix-clustering is pair-wise comparisons of Position Specific Scoring Matrices. The similarity between motifs is measured by using RSAT compare-matrices, which allows combining several distance metrics for simi-larity calculation [18]. The tool builds a global hierarchical tree from bottom up by using the similarity scores calcu-lated from pair-wise comparisons [18]. MOTIFSIM also performs pair-wise comparisons on PSPMs. The similarity scores calculated by MOTIFSIM are used to build the dis-tance matrices, which are fed intohclustfunction inRfor building the trees [12]. The hclust function also imple-mented the hierarchical clustering algorithm.
We compared the performances of both tools for clus-tering the motifs that were selected from the Jaspar database [28]. The method for selecting the motifs is presented in the Datasets section. We used the default setting provided by each tool to run the experiments. The results were generated in multiple formats including tree format for comparisons. We obtained the count for the motifs that were correctly classified into their family in the database by each tool for each dataset. A family can have at least two or more members. The count was
then used for calculating the percentage of correct clas-sification by each tool.
Measuring the significance of the global significant motif
We used the assessment method, the benchmark se-quence datasets, and the on-line assessment tool from Tompa et al. for this evaluation [29]. We measured the performances of nineteen motif finders on various benchmark sequence datasets [29]. For each toolTand each datasetD, we have a set of known binding sites and a set of predicted binding sites. Thus, the performance ofTonDcan be measured atnucleotide leveland atsite
level[29]. At the nucleotide level, we calculated four
sta-tistics namely sensitivity (nSn), positive predictive value (nPPV), specificity (nSP), and correlation coefficient (nCC). Similarly, at site level, we calculated two statistics that are sensitivity (sSn) and positive predictive value (sPPV). These statistics are presented in the Additional file1[29].
The motifs generated by various tools for an identical sequence dataset were fed into MOTIFSIM for generat-ing the global significant motifs [11]. Since MOTIFSIM identifies a list of common significant motifs from a pool of motifs reported by various tools, we selected the best common significant motif based on two criteria. First, it must represent the popular vote by the majority of the tools. Second, it has the highest rank of similarity score. Since we know the origin of the common significant motif, its significance can be calculated by using six sta-tistics above. We assessed the correctness of the motif reported by each tool and this assessment covers the se-lected motif from MOTIFSIM. We then compared the Table 1Four distance metrics used in pair-wise comparisons with MOTIFSIM
Metric Formula Description Ref.
Average Kullback-Leibler (AKL)
AKLðX;YÞ ¼10− XT
b¼A
fxðbÞ log
fxðbÞ
fyðbÞþ
XT
b¼A
fyðbÞ log
fyðbÞ
fxðbÞ
2
XandYare two aligned columns of two matrices in comparison.
fx(b) is the frequency of baseb∈{A,C,G,T} in columnX
and likewise forfy(b) in columnY.
AKL(X,Y) is the similarity score at an alignment position for two columnsXandY.
21
Average Log-likelihood Ratio
(ALLR) ALLR¼
XT
b¼A
nbX logð
fbY
pbÞ þ
XT
b¼A
nbY logð
fbX
pbÞ
XT
b¼A
ðnbXþnbYÞ
nbXis the count of baseb∈{A,C,G,T} in columnXand
likewise fornbYin columnY.
fb=nb/Nis the frequency of basebwhereNis the total
count of all bases in a column. pbis the prior probability for baseb.
24
Pearson Correlation Coefficient (PCC)
PCCðX;YÞ ¼ XT
b¼A
ðXb−XÞ ðYb−YÞ
ffiffiffiffiffiffiffiffiffiffiffiffiffiffiffiffiffiffiffiffiffiffiffiffiffiffiffiffiffiffiffiffiffiffiffiffiffiffiffiffiffiffiffiffiffiffiffiffiffiffiffiffiffi XT
b¼A
ðXb−XÞ
2
XT
b¼A
ðYb−YÞ
2
v u u t
Xbis the count of baseb∈{A,C,G,T} in columnXand
likewise forYbin columnY.
Xis the average count of bases in columnXand likewise forYin columnY.
24
χ2Distance
χ2¼ X
b¼A;C;G;T
ðNg;ifb;i−Nf;igb;iÞ
2
Nf;iNg;iðfb;iþgb;iÞ
fb, iis the entries of overlapping parts at positioniin
matrixfof the two matricesfandgin comparison gb, iis the entries of overlapping parts in matrixg
Nf,i=∑bfb,i, andNg,i=∑bgb,i.
correctness for identifying the known motif of each tool including MOTIFSIM.
Datasets
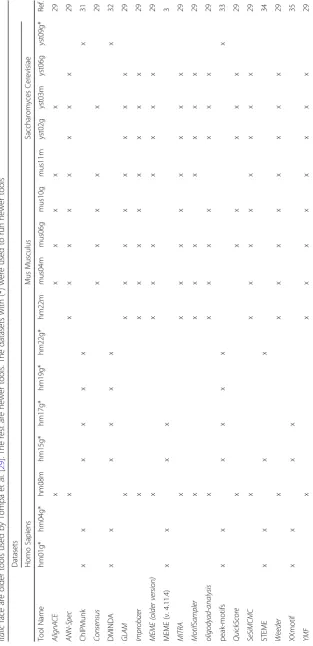
The motif datasets that were used in the assessment came from sixteen benchmark sequence datasets in Table 2 [29]. The sequence datasets came from three species: Homo sapiens, Mus musculus, and
Saccharomy-ces cerevisiae. The sequence datasets can be ingenericor
Markov type [29]. The generic type was generated by
randomly selecting the promoter sequences and then implanted the known binding sites of the same species into those sequences. The Markov type was created by generating random sequences using Markov chain order of 3 and then implanted the known binding sites of the same species into those sequences. Each known binding site embedded in a sequence belongs to a specific tran-scription factor in the TRANSFAC database [30]. We se-lected different benchmark datasets so that each sequence in a dataset contains at least one or more em-bedded sequences of the same transcription factor. These sequence datasets were used to run nineteen motif finders [3,29,31–35] in Table3for generating the motifs that were subsequently used in this assessment. Some general characteristics of these tools can also be found in Additional file 1: Table S1. In addition, we se-lected 46 motifs from the TRANSFAC database. Each selected motif has at least one or more closely structural members of the same species in the database. The aim is to measure the performances of USW, AKL, ALLR, PCC, CS, and MOTIFSIM for identifying the known
motif among several similar motifs of the same species in the TRANSFAC database. The performance of each method is measured by using the number of motifs that were correctly identified by each method for the same set of datasets.
The data that were used in the first phase of the assessment contain 158 motifs. They can be found in Additional file 1: Table S2. The first one hundred and four are on-line predicted motifs, which were generated by thirteen tools in Tompa et al. [29]. Since thirteen tools in [29] are older tools, we assessed six additional newer tools in Table 3. Because nine sequence datasets used by Tompa et al. to run older tools produced low performance results in their study, we selected seven additional sequence datasets to run the newer tools. They are marked with asterisk (*) in Table3. The object-ive was to observe if a sequence dataset had any influ-ence on the performance of each tool. The next eight motifs in the collection came from five newer tools that are ChIPMunk [31], DMINDA [32], MEME (v. 4.11.4) [3], peak-motifs [33], and XXmotif [35]. We followed the procedure suggested by Tompa et al. for selecting the top three motifs for each sequence dataset and we calcu-lated six statistics above for each motif. We used nCC for selecting the best motif reported by each tool for each sequence dataset. The following forty-six motifs in the collection came from the TRANSFAC database. For each motif in the collection, we performed pair-wise comparisons with motifs of the same species in the TRANSFAC database by using USW, AKL, ALLR, PCC, CS, and MOTIFSIM. The second phase of the assessment
Table 2Sixteen benchmark sequence datasets [29]. They are grouped by species. Each sequence dataset has an embedded transcription factor
Sequence Dataset Dataset Type Species Transcription Factor Number of Sequences Sequence Length
hm01g Generic Homo sapiens AP-1 18 2000
hm04g Generic Homo sapiens c-Jun 13 2000
hm08m Markov Homo sapiens CREB 15 500
hm15g Generic Homo sapiens NF-1 4 2000
hm17g Generic Homo sapiens NF-kappaB 11 500
hm19g Generic Homo sapiens Sp1 5 500
hm22g Generic Homo sapiens USF1 6 500
hm22m Markov Homo sapiens USF1 6 500
mus04m Markov Mus musculus C/Ebalpha 7 1000
mus06g Generic Mus musculus GATA-1 3 500
mus10g Generic Mus musculus Sp1 13 1000
mus11m Markov Mus musculus Sp1 12 500
yst02g Generic Saccharomyces cerevisiae GAL04 4 500
yst03m Markov Saccharomyces cerevisiae GCN4 8 500
yst06g Generic Saccharomyces cerevisiae MCM1 7 500
used four datasets containing the motifs selected from the Jaspar database [28]. They can be found in Table 4. The datasets came from four taxonomic groups namelyFungi,
Insects, Plants and Vertebrates. Each dataset comprises
motifs from different families. The goal was to cluster them into a proper family, which they belong in the Jaspar database. The details of each dataset can be found in Additional file1: Tables S3-S6.
Lastly, the data that were used in the third phase of the assessment include 137 motifs. They can be found in Additional file1: Table S7. The first thirty-three are pre-dicted motifs, which were generated by six newer tools. The rest are predicted motifs generated by thirteen older tools.
Results
Pair-wise motif comparison
We obtained the number of motifs that were correctly identified by each method per sequence dataset for 112 predicted motifs in the collection. Subsequently, we cal-culated the percentage of motifs that were correctly identified by each method. MOTIFSIM attains 31% com-paring to 22% for USW, 1% for AKL, 0% for ALLR, 0% for PCC, and 15% for CS as shown in Table5.
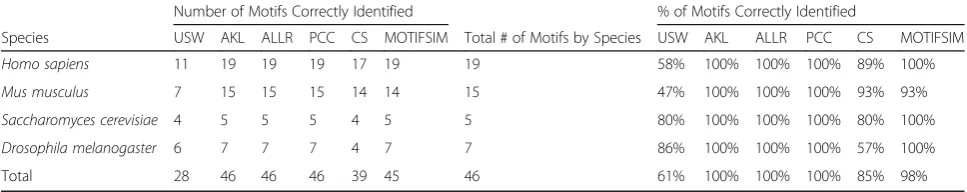
We repeated the calculations above but for the se-lected motifs from the TRANSFAC database in the col-lection. We also obtained the number of motifs that were correctly identified by each method per species as shown in Table6. Again, we calculated the percentage of motifs that were correctly identified by each method. MOTIFSIM attains 98% comparing to 61% for USW, 100% for AKL, 100% for ALLR, 100% for PCC, and 85% for CS. Although MOTIFSIM has a slightly lower per-centage than AKL, ALLR, and PCC for this portion of comparison, the average percentage for both compari-sons demonstrates it has higher overall performance than other methods. Specifically, MOTIFSIM attains 64.5% comparing to 41.5% for USW, 50.5% for AKL, 50% for ALLR, 50% for PCC, and 50% for CS as shown in Table7. In general, different methods exhibit various performances on different datasets. However, the overall results show MOTIFSIM outperforms other methods.
Motif clustering
To compare the performances of MOTIFSIM and Matrix-clustering, we obtained the motif tree for the result gener-ated by each tool for each dataset. We used the Phyloden-dron tool to generate the motif trees for the results from Matrix-clustering [36]. The trees are shown in Additional file1: Figures S1-S8. We calculated the percentage of mo-tifs that were correctly classified into their family by each tool per dataset. MOTIFSIM achieves 62% forFungi and 57% for Insects datasets comparing to 58% and 55% re-spectively from Matrix-clustering. For thePlantsand
Ver-tebratesdatasets, both tools achieve similar results of 97%
and 90% respectively. The comparison results are in Table8and Fig.1.
Table 4Four datasets used in motif clustering comparisons. The motifs in each dataset were selected from the Jaspar database [28]
Dataset Number of Motifs Taxonomic Group
pfm_fungi 78 Fungi
pfm_insect 42 Insects
pfm_plant 65 Plants
pfm_vertebrate 73 Vertebrates
Table 5Performance comparisons for USW, AKL, ALLR, PCC, CS, and MOTIFSIM for the predicted motifs in the collection. The number of motifs that were correctly identified by each method per sequence dataset is listed. The percentage of motifs that were correctly identified by each method per dataset was also calculated
Sequence Dataset
Number of Motifs Correctly Identified % of Motifs Correctly Identified
USW AKL ALLR PCC CS MOTIFSIM Total # of Tools USW AKL ALLR PCC CS MOTIFSIM
hm08m 0 0 0 0 0 1 12 0% 0% 0% 0% 0% 8%
hm17g 2 0 0 0 3 2 5 40% 0% 0% 0% 60% 40%
hm22m 1 0 0 0 2 1 10 10% 0% 0% 0% 20% 10%
mus04m 0 0 0 0 0 2 12 0% 0% 0% 0% 0% 17%
mus06g 1 1 0 0 1 2 13 8% 8% 0% 0% 8% 15%
mus10g 3 0 0 0 0 5 11 27% 0% 0% 0% 0% 45%
mus11m 2 0 0 0 0 3 11 18% 0% 0% 0% 0% 27%
yst02g 6 0 0 0 7 6 11 55% 0% 0% 0% 64% 55%
yst03m 3 0 0 0 1 9 13 23% 0% 0% 0% 8% 69%
yst06g 5 0 0 0 2 3 11 45% 0% 0% 0% 18% 27%
yst09g 2 0 0 0 1 1 3 67% 0% 0% 0% 33% 33%
Significance of the global significant motif
We measured the performances of all tools including MOTIFSIM by calculating six statistics presented above for the best motif produced by each tool for the same sequence dataset. Since the selected global significant motif from MOTIFSIM came from one of the motif finders, its cor-rectness can be measured by using six statistics above. The results of different tools including MOTIFSIM for each se-quence dataset are in Additional file 1: Figures S9-S24. Additional file 1: Figures S9-S11 show the results for six newer tools including MOTIFSIM for the sequence
data-setshm01g,hm04g, and hm15g respectively. In Additional
file1: Figure S9, the selected global significant motif from MOTIFSIM came from peak-motifs. This tool has a better performance than other tools. Additional file1: Figures S10 and S11 show seven tools failed to identify the known motif. However, Additional file 1: Figure S12 indicates all five newer tools and MOTIFSIM successfully identified the known motif for the sequence datasethm17g. The selected global significant motif from MOTIFSIM came from peak-motifs. STEME was absent in this figure because it did not report any significant motif. Additional file 1: Figures S13-S15 show the results for three or four newer tools including MOTIFSIM for the sequence datasets
hm19g,hm22g, andyst09grespectively. Other newer tools
were absent in these figures because they did not report any significant motif. The results for older tools including MOTIFSIM are shown in Additional file1: Figures S16-S24. In Additional file1: Figure S16, the selected global significant motif from MOTIFSIM came from YMF. This tool has a better performance than some other tools. Generally, some
tools exhibit better performance than others for some se-quence datasets. We calculated the average statistics for six newer tools including MOTIFSIM. The result reveals STEME has a poorer performance than other tools as shown in Fig.2. We also calculated the average statistics for thirteen older tools including MOTIFSIM. The result in Fig.3 indi-cates Weeder, YMF, and Oligodyad-analysis attain better per-formance than other tools. MOTIFSIM is in an intermediate range comparing to Weeder and YMF. However, it achieves better performance than ten other tools except for Oligodyad-analysis, Weeder, and YMF.
Discussion
Using multiple tools for finding motifs is generally advised because the motifs reported by multiple tools are more likely to be biologically significant. In this assessment, the predicted motif was not verified with the known motif for the objective of measuring the performance of each tool. In general, the results show that some tools have better performance than others. Some tools show poor performance and some even failed to identify the known motif. However, the observation for Fig.2indicates the top two performers: peak-motifs and DMINDA outperform other tools while MEME and STEME exhibit lower performance than others with STEME is at the lowest rank. Since each tool has its unique approach for de-tecting the motifs, the method that each tool used generally falls into one of the two common categories: profile-based method and consensus-based method. We observed the type of method that each tool is based on in Additional file 1: Table S1. DMINDA is a graph-based method and peak-motifs is a word-based method, which is a subcategory of the consensus-based method. Both MEME and STEME are profile-based methods. However, STEME exhibits a sig-nificant lower performance than MEME, which can be caused by its nature design and implementation although its algorithm has similar properties to MEME [34]. In Fig.3, the
top three performers are Weeder, YMF, and
Oligodyad-analysis. They outperform other tools while AlignACE, MITRA, and GLAM are the bottom three performers with GLAM is at the lowest rank. All top three performers in this figure are consensus-based methods. AlignACE and GLAM are profile-based methods. Although Table 6Performance comparisons for USW, AKL, ALLR, PCC, CS, and MOTIFSIM for the selected motifs from TRANSFAC database in the collection. The number of motifs that were correctly identified by each method per species is listed. The percentage of motifs that were correctly identified by each method per species was also calculated
Number of Motifs Correctly Identified % of Motifs Correctly Identified
Species USW AKL ALLR PCC CS MOTIFSIM Total # of Motifs by Species USW AKL ALLR PCC CS MOTIFSIM
Homo sapiens 11 19 19 19 17 19 19 58% 100% 100% 100% 89% 100%
Mus musculus 7 15 15 15 14 14 15 47% 100% 100% 100% 93% 93%
Saccharomyces cerevisiae 4 5 5 5 4 5 5 80% 100% 100% 100% 80% 100%
Drosophila melanogaster 6 7 7 7 4 7 7 86% 100% 100% 100% 57% 100%
Total 28 46 46 46 39 45 46 61% 100% 100% 100% 85% 98%
Table 7Average percentage for the predicted motifs and the selected motifs by each method. MOTIFSIM achieves higher performance than other methods
% of Motifs Correctly Identified
Motif Category USW AKL ALLR PCC CS MOTIFSIM
Predicted motifs 22% 1% 0% 0% 15% 31%
Selected motifs from TRANSFAC
61% 100% 100% 100% 85% 98%
MITRA is a consensus-based method, it falls into the list of three bottom performers. This can be explained by the na-ture design and implementation of the tool. The profile-based methods are faster than consensus-profile-based methods but they have lower accuracy than consensus-based methods be-cause they tend to be trapped in a local optimum [37]. The observations for Figs. 2 and 3 confirm this fact except for MITRA.
Regardless of the poor performance, MOTIFSIM al-ways reports the majority vote motif at the highest rank of similarity score. When we observe the performances of various tools on several sequence datasets, it shows that MOTIFSIM is more reliable for identifying the mo-tifs that are more trustworthy than those reported by the poor performance tools. This is crucial particularly for the de novo motif finders because they do not use the reference database for verifying the found motifs. Thus, it may not be reliable for obtaining the results from vidual de novo motif finders. The observation also indi-cates that using multiple tools for finding motifs and combining with MOTIFSIM for attaining the common
significant motifs, it improved the results for DNA motif detection. This improvement is suitable for the general motif detection. If the motif discovery involves finding a specific type of motif by using a special tool, then using different types of motif finders may not be useful and MOTIFSIM is not recommended. On the other hand, because MOTIFSIM is specialized for motif similarity detection, the tool is useful for obtaining the common significant motifs from the results generated by several motif finders of the same type or by various motif finders of different types for the general motif detection. Besides, individual motif finders can be specialized for targeting different types of motifs. Hence, the users should select the most suitable method for their research for obtaining the best possible result.
Conclusions
We compared the pair-wise comparison technique of MOTIFSIM with USW, AKL, ALLR, PCC, and CS for measuring similarity between DNA motifs. The com-parison results show that MOTIFSIM achieves better Table 8Comparison results for Matrix-clustering and MOTIFSIM for four taxonomic datasets. The number of motifs that were correctly classified and the percentage of correct classification by each tool for each dataset are shown. MOTIFSIM has a similar or better performance than Matrix-clustering
Dataset Total
Number of Motifs
MOTIFSIM Matrix Clustering
# of Motifs Correctly Clustered
% of Correct Classification
# of Motifs Correctly Clustered
% of Correct Classification
Fungi 78 48 62% 45 58%
Insects 42 24 57% 23 55%
Plants 65 63 97% 63 97%
Vertebrates 73 66 90% 66 90%
performance than five methods above. We also com-pared MOTIFSIM with Matrix-clustering tool for clus-tering the motifs. The classification results on four taxonomic datasets demonstrate MOTIFSIM attains similar or better results than Matrix-clustering. Further-more, we evaluated the performances of nineteen motif finders and the reliability of MOTIFSIM for identifying the common significant motifs. The comparison results reveal that some motif finders achieve better perform-ance than other tools. Some failed to identify the known
motif. However, when the motif detection does not re-quire a special tool for finding a specific type of motif then using multiple tools for finding motifs and com-bining with MOTIFSIM for attaining the common significant motifs, it improved the results for DNA motif detection. Since individual motif finders can be specialized for different types of motifs, it is advisable to select the most suitable method for a particular type of research in order to achieve the best possible result.
Fig. 2Average statistics for six newer motif finders (ChIPMunk, DMINDA, MEME v. 4.11.4, peak-motifs, STEME, XXmotif) and MOTIFSIM on seven additional sequence datasets. The first four statistics at the bottom of the figure are nucleotide level statistics. The next two are site level statistics. STEME shows lower performance than all other tools due to its nature design and implementation. MOTIFSIM has better performance than MEME and STEME and it is in an intermediate range comparing to other tools
Additional file
Additional file 1:Supplementary Materials. (DOC 1779 kb)
Acknowledgements Not applicable.
Funding
This work was supported by U.S. Department of Education Graduate Fellowships in Areas of National Need (GAANNs) [Grant P200A130153 to NTLT].
Availability of data and materials
The datasets used in this study are from the Computer Science and Engineering Department at University of Washington. They are accessible at http://bio.cs.washington.edu/assessment/.
Authors’contributions
NTLT and C-HH conceived the study. NTLT designed the experiments, collected the data, performed the experiments, and drafted the manuscript. C-HH guided the study and revised the manuscript. Both authors read and approved the final manuscript.
Ethics approval and consent to participate Not applicable.
Consent for publication Not applicable.
Competing interests
The authors declare that they have no competing interests.
Publisher’s Note
Springer Nature remains neutral with regard to jurisdictional claims in published maps and institutional affiliations.
Received: 4 November 2018 Accepted: 7 December 2018
References
1. Zambelli F, Pesole G, Pavesi G. Motif discovery and transcription factor binding sites before and after the next-generation sequencing era. Brief Bioinform. 2012;14:225–37.
2. Bulyk ML. Computational prediction of transcription-factor binding site locations. Genome Biol. 2003;5(1):201.
3. Bailey T, Williams N, Misleh C, Li W. MEME: discovering and analyzing DNA and protein sequence motifs. Nucleic Acids Res. 2006;34(Web Server):W369–73. 4. Bailey T. DREME: motif discovery in transcription factor ChIP-seq data.
Bioinformatics. 2011;27(12):1653–9.
5. Machanick P, Bailey T. MEME-ChIP: motif analysis of large DNA datasets. Bioinformatics. 2011;27(12):1696–7.
6. Sharov A, Ko M. Exhaustive search for over-represented DNA sequence motifs with CisFinder. DNA Res. 2009;16(5):261–73.
7. Thomas-Chollier M, Herrmann C, Defrance M, Sand O, Thieffry D, van Helden J. RSAT peak-motifs: motif analysis in full-size ChIP-seq datasets. Nucleic Acids Res. 2012;40(4):e31.
8. Zambelli F, Pesole G, Pavesi G. PscanChIP: finding over-represented transcription factor-binding site motifs and their correlations in sequences from ChIP-Seq experiments. Nucleic Acids Res. 2013;41(Web Server issue): W535–43.
9. Jin VX, Apostolos J, Nagisetty NS, Farnham PJ. W-ChIPMotifs: a web application tool forde novomotif discovery from ChIP-based high-throughput data. Bioinformatics. 2006;25(23):3191–3.
10. Tran NTL, Huang C-H. A survey of motif finding web tools for detecting binding site motifs in ChIP-Seq data. Biol Direct. 2014;9:4.
11. Tran NTL, Huang C-H. MOTIFSIM: a web tool for detecting similarity in multiple DNA motif datasets. BioTechniques. 2015;59(1):26–33.
12. Tran NTL, Huang C-H. MOTIFSIM 2.1: an enhanced software platform for detecting similarity in multiple DNA motif data sets. J Comput Biol. 2017; 24(9):895–905.
13. Smith TF, Waterman MS. Identification of common molecular subsequences. J Mol Biol. 1981;147(1):195–7.
14. Kullback S, Leibler RA. On information and sufficiency. The Annals of Mathematical Statistics. 1951;22(1):79–86.
15. Wang T, Stormo GD. Combining motif data with co-regulated genes to identify regulatory motifs. Bioinformatics. 2003;19(18):2369–80.
16. Kielbasa SM, Gonze D, Herzel H. Measuring similarities between transcription factor binding sites. BMC Bioinformatics. 2005;6:237.
17. Pietrokovski S. Searching databases of conserved sequence regions by aligning protein multiple-alignments. Nucleic Acids Res. 1996;24(19):3836–45. 18. Castro-Mondragon JA, Jaeger S, Thieffry D, et al. RSAT matrix-clustering:
dynamic exploration and redundancy reduction of transcription factor binding motif collections. Nucleic Acids Res. 2017;45(13):e119. 19. Nomenclature Committee of the International Union of Biochemistry.
(NC-IUB). Nomenclature for incompletely unspecified basses in nucleic acid sequences. Recomdendation 1984. Eur J Biochem. 1985;150(1):1–5. 20. Matrix.ftp://ftp.ncbi.nlm.nih.gov/blast/matrices/. Accessed 24 Jan 2018. 21. Mahony S, Auron PE, Benos PV. DNA familial binding profiles made easy:
comparison of various motif alignment and clustering strategies. PLoS Comput Biol. 2007;3(3):e61.
22. Zhang S, Zhou X, Du C, et al. SPIC: a novel similarity metric for comparing transcription factor binding site motifs based on information contents. BMC Syst Biol. 2013;7(Suppl 2):S14.
23. Farrel A, Murphy J, Guo J. Structure-based prediction of transcription factor binding specificity using an integrative energy function. Bioinformatics. 2016;32(12):i306–13.
24. Schones DE, Sumazin P, Zhang MQ. Similarity of position frequency matrices for transcription factor binding sites. Bioinformatics. 2005;21(3):307–13. 25. Durbin R, Eddy S, Krogh A, et al. Biological sequence analysis: probabilistic
models of proteins and nucleic acids: Cambridge University Press; 1998. 26. Altschul SF, Gish W, Miller W, et al. Basic local alignment search tool. J Mol
Biol. 1990;215(3):403–10.
27. BLAST Help Manual.http://www.genebee.msu.su/blast/blast_help.html. Accessed 24 Jan 2018.
28. Mathelier A, Fornes O, Arenillas DJ, et al. JASPAR 2016: a major expansion and update of the open-access database of transcription factor binding profiles. Nucleic Acids Res. 2016;44(D1):D110–5.
29. Tompa M, Li N, Bailey TL, et al. Assessing computational tools for the discovery of transcription factor binding sites. Nat Biotechnol. 2005;23(1):137–44. 30. Matys V, Fricke E, Geffers R, et al. TRANSFAC®: transcriptional regulation,
from patterns to profiles. Nucleic Acids Res. 2003;31(1):374–8. 31. Kulakovskiy IV, Boeva VA, Favorov AV, et al. Deep and wide digging for
binding motifs in ChIP-Seq data. Bioinformatics. 2010;26(20):2622–3. 32. Ma Q, Zhang H, Mao X, et al. DMINDA: an integrated web server for DNA
motif identification and analyses. Nucleic Acids Res. 2014;42(Web Server issue):W12–9.
33. Thomas-Chollier M, Herrmann C, Defrance M, et al. RSAT peak-motifs: motif analysis in full-size ChIP-seq datasets. Nucleic Acids Res. 2011;40(4):e31. 34. Reid JE, Wernisch L. STEME: a robust, accurate motif finder for large data
sets. PLoS One. 2014;9(3):e90735.
35. Luehr S, Hartmann H, Söding J. The XXmotif web server for eXhaustive, weight matriX-based motif discovery in nucleotide sequences. Nucleic Acids Res. 2012;40(Web Server issue):W104–9.
36. Gilbert DG. Phylodendron. 1999.http://iubio.bio.indiana.edu/treeapp/ treeprint-form.html. Accessed 24 Jan 2018.
![Table 2 Sixteen benchmark sequence datasets [29]. They are grouped by species. Each sequence dataset has an embeddedtranscription factor](https://thumb-us.123doks.com/thumbv2/123dok_us/8915882.1839026/4.595.61.538.492.731/sixteen-benchmark-sequence-datasets-grouped-species-sequence-embeddedtranscription.webp)