R E S E A R C H
Open Access
Diagnostic values and appropriate cutoff
points of lipid ratios in patients with
abnormal glucose tolerance status: a
cross-sectional study
Wen Guo
1, Pei Qin
1, Jing Lu
1, Xiaona Li
1, Wenfang Zhu
1, Nianzhen Xu
1, Jianming Wang
2*and Qun Zhang
1*Abstract
Background:Lipid ratios, for example total cholesterol/high-density lipoprotein cholesterol (TC/HDL-C) and triglyceride/high-density lipoprotein cholesterol (TG/HDL-C), are associated with type 2 diabetes mellitus (T2DM). However, the predictive values of lipid ratios in prediabetes remain unclear. The aims of this study were: 1) to investigate the association between lipid ratios and abnormal glucose tolerance; 2) to compare the predictive significance of lipid ratios with commonly used indicators of lipid variables in clinical practice in a Chinese population.
Methods:The cross-sectional study enrolled 2680 participants from the Health Promotion Center of the First Affiliated Hospital of Nanjing Medical University. All participants received a 75 g oral glucose tolerance test. Blood samples were obtained at baseline and 120 min after glucose ingestion. Participants were classified as normal glucose tolerance (NGT), impaired glucose regulation (IGR), and T2DM. The odds ratios (ORs) and 95% confidence intervals (CIs) were estimated using logistic regression model. The receiver operating characteristic (ROC) curve was used to identify the cutoff points of lipid and lipid ratios. The area under the receiver operating characteristic curve (AUROC), sensitivity and specificity were calculated to estimate their diagnostic values.
Results:TC, TG, TC/HDL-C, TG/HDL-C and non-HDL-C were significantly correlated with both prediabetes and T2DM after adjustment for other risk factors such as blood glucose, whereas LDL-C was only positively correlated with prediabetes. TG and TG/HDL-C showed higher diagnostic values for prediabetes and T2DM than TC, LDL-C, HDL-C, TC/HDL-C and non-HDL-C, with the AUC values over 0.70. For predicting prediabetes, the optimal cutoff point was 1.36 mmol/l for TG and 1.13 for TG/HDL-C. For predicting T2DM, the optimal cutoff point was 1.46 mmol/l for TG and 1.22 for TG/HDL-C.
Conclusions:Both TG and TG/HDL-C are promising biomarkers for distinguishing individuals with abnormal glucose tolerance, and can be used to predict prediabetes and T2DM in Chinese population.
Keywords:Lipid ratio, Dyslipidemia, Glucose tolerance, Diabetes
Background
The prevalence of diabetes has increased significantly over recent decades in China. According to the latest national survey of 98,658 adults from 31 provinces (autonomous regions and municipalities) in mainland China in 2010, the prevalence rate was 11.6% for diabetes, 3.5% for
isolated post-challenge hyperglycemia (IPH), and 8.4% for impaired glucose tolerance (IGT). In this survey, IPH was defined as fasting plasma glucose (FPG) < 7 mmol/l and 2-h post-c2-hallenge plasma glucose (2-2-hPG) ≥11.1 mmol/l, and IGT was defined as FPG < 6 mmol/l and 2-hPG≥7.8 mmol/l. [1] People with IPH or IGT have similar risk of target organs damage as people with diabetes [2, 3], but this population are often ignored and untreated owing to the high cost of a traditional oral glucose tolerance test (OGTT). Thus, an effective method for the early detection
© The Author(s). 2019Open AccessThis article is distributed under the terms of the Creative Commons Attribution 4.0 International License (http://creativecommons.org/licenses/by/4.0/), which permits unrestricted use, distribution, and reproduction in any medium, provided you give appropriate credit to the original author(s) and the source, provide a link to the Creative Commons license, and indicate if changes were made. The Creative Commons Public Domain Dedication waiver (http://creativecommons.org/publicdomain/zero/1.0/) applies to the data made available in this article, unless otherwise stated.
* Correspondence:[email protected];[email protected]
2School of Public Health, Nanjing Medical University, 818 Tianyuan East Road,
Nanjing 211166, China
1Department of Health Promotion Center, The First Affiliated Hospital with
of patients with IPH or IGT is crucial for effective inter-vention and therapy.
Type 2 diabetes mellitus (T2DM) is the most common type of diabetes. Changes in lifestyle, including“nutrition transition” and physical inactivity, increase the risk of diabetes. T2DM is often related to and accompanied by aberrant levels of plasma triglycerides (TG), total choles-terol (TC), high-density lipoprotein cholescholes-terol (HDL-C), and low-density lipoprotein cholesterol (LDL-C) [4]. In the past few years, the lipid ratios, such as TC/HDL-C and TG/HDL-TC/HDL-C, have been proposed as alternative biomarkers for predicting T2DM, because they can pro-vide a set of integrated information based on multiple variables. For example, a prospective study reported that lipid ratios of TG/HDL-C and TC/HDL-C were associ-ated with the incidence of T2DM among Iranians [5]. Another cross-sectional study in a Chinese community population found that TC/HDL-C was significantly re-lated to T2DM and superior to LDL-C or HDL-C as a biomarker of diabetes risk [6]. However, there are lim-ited data available about the role of lipid ratios in prediabetes.
The aim of this study was to investigate the association between lipid ratios and abnormal glucose tolerance, in-cluding prediabetes and T2DM. In addition, this study compared the predictive significance of lipid ratios and traditional lipid indicators, such as TC, LDL-C, TG and HDL-C.
Methods
Subjects
We performed a cross-sectional study by enrolling 2680 participants from the Health Promotion Center of the First Affiliated Hospital of Nanjing Medical University. All participants underwent a 75 g OGTT. Blood samples were collected at baseline and 120 min after glucose in-gestion. According to the World Health Organization (WHO) diagnostic criteria, 1027 participants were classi-fied as having normal glucose tolerance (NGT), 834 par-ticipants were classified as having impaired glucose regulation (IGR), and 819 participants were classified as having T2DM. All study participants signed a written consent form. Participants with the following character-istics were excluded: diabetic ketosis, hyperthyroidism, liver disorders, kidney disorders and other diseases asso-ciated with lipid metabolism dysfunction, or consuming statin lipid-lowering drugs. This study was approved by the Ethical Committee of the First Affiliated Hospital of Nanjing Medical University (2016-SR-220).
Blood sample collection and storage
All participants underwent an oral glucose tolerance test (OGTT) after overnight fasting. Blood samples were col-lected before and 120 min after the glucose load, and
centrifuged at 4 °C (1,610 g/min for 15 min). Serum sam-ples were separated and stored at−80 °C.
Physical examination and biochemical tests
Weight, height and blood pressure (BP) were measured in accordance with international standards. Plasma levels of glucose, TC, TG, LDL-C and HDL-C concentrations were measured by enzymatic methods (Chemistry Analyzer Au2700, Olympus Medical Engineering Com-pany, Japan). Non-HDL-C was calculated by subtracting HDL-C from TC. The TC/HDL-C and TG/HDL-C ratios were calculated by dividing TC and TG by HDL-C.
Statistical analysis
Continuous variables were expressed as mean ± SD. Differ-ences among groups were tested by one-way ANOVA with Bonferroni correction for pairwise comparisons. The logis-tic regression model was used to examine the association between glucose status and lipid parameters, and was ad-justed for potential confounders such as age, sex, BP, smok-ing status and BMI. The odds ratios (ORs) and 95% confidence intervals (95% CIs) were used to estimate the strength of association. The diagnostic property of lipid pa-rameters in IGR or T2DM was evaluated using the area under the curve (AUC) of the receiver operating character-istics (ROC). Data were analyzed using SPSS18.0 statistical software, with significance defined asp< 0.05 (two-sided).
Results
Participant’s characteristics
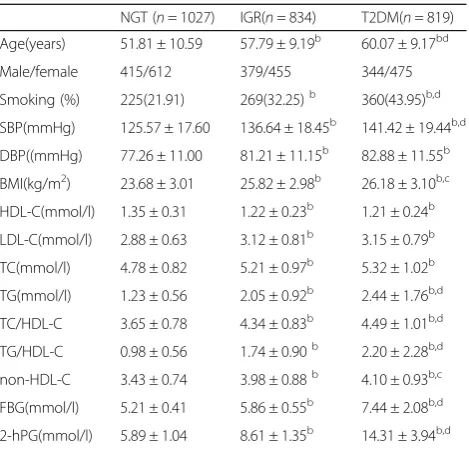
Clinical and biochemical characteristics of the participants are listed in Table 1. There were 1027 participants with NGT, 834 with IGR and 819 with newly diagnosed T2DM. Participants with IGR and T2DM were characterized by increasingly older age, higher blood pressure and BMI, greater levels of LDL-C, TC, TG, TC/HDL-C, TG/HDL-C, non-HDL-C, FBG and 2-hPG and lower levels of HDL-C, compared with participants with NGT (P< 0.05).
Multinomial logistic regression analysis for the risk of IGR and T2DM
After adjusting for age, sex, blood pressure smoking sta-tus, BMI, FBG and 2-hPG, the LDL-C, TC, TG, TC/ HDL-C, TG/HDL-C and non-HDL-C were all positively correlated with IGR, with the OR (95% CI) of 1.532(1.178–1.991) for LDL-C (one mmol/l increase), 1.660 (1.341–2.055) for TC (one mmol/l increase), 3.954 (2.739–5.597) for TG (one mmol/l increase), 2.041 (1.566–2.661) for TC/HDL-C (per unit increase), 3.445 (2.417–4.921) for TG/HDL-C (per unit increase), 1.970 (1.548–2.506) for non-HDL-C (per unit increase), re-spectively (Table2).
(95% CI) of 1.581(1.149–2.176) for TC (one mmol/l in-crease), 4.677 (3.128–6.993) for TG (one mmol/l in-crease), 1.762 (1.225–2.536) for TC/HDL-C (per unit increase), 3.943 (2.625–5.923) for TG/HDL-C (per unit increase), and 1.828 (1.280–2.612) for non-HDL-C (per unit increase) (Table2).
Binary logistic regression analysis on the factors related with IGT or IPH
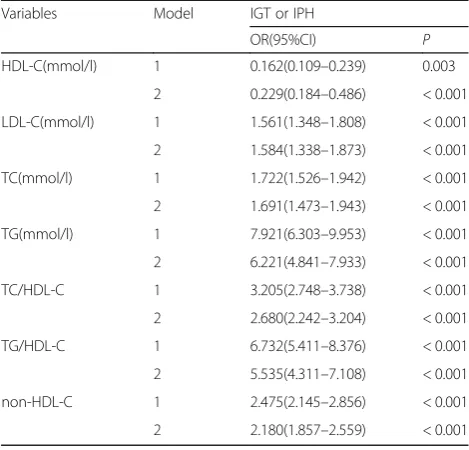
There were 691 participants with normal FBG but ab-normal 2-hPG who were therefore defined as IGT or IPH. After adjusting for age, sex, blood pressure, smok-ing, BMI and FBG, logistic regression analysis revealed that HDL-C (OR: 0.229, 95% CI: 0.184–0.486), LDL-C (OR: 1.584, 95% CI: 1.338–1.873), TC (OR: 1.691, 95% CI: 1.473–1.943), TG (OR: 6.221, 95% CI: 4.841–7.933), TC/HDL-C (OR: 2.680, 95% CI: 2.242–3.204), TG/HDL-C (OR: 5.535, 95% CI: 4.311–7.108) and non-HDL-C (OR: 2.180, 95%CI: 1.857–2.559) were significantly asso-ciated with IGT or IPH (Table3).
Diagnostic value of lipid parameters for T2DM
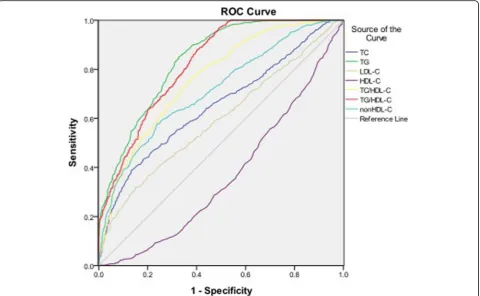
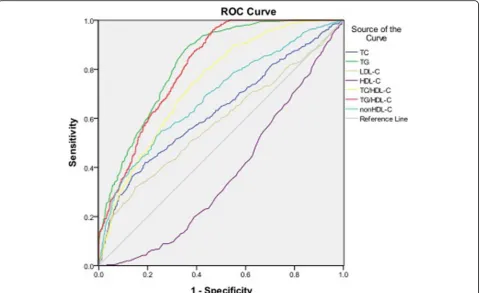
Table 4 and Fig.1 showed the cutoff points of lipid pa-rameters for the prediction of T2DM with their corre-sponding specificity and sensitivity. The AUROCs for TG, TC/HDL-C, TG /HDL-C and non-HDL-C were all > 0.7, indicating they are potential predictors of T2DM. Both TG and TG/HDL-C had the AUROC> 0.8. The op-timal cutoff points of TG, TC/HDL-C, TG /HDL-C and non-HDL-C for predicting T2DM were 1.46 mmol/l, 3.92, 1.22 and 3.76, respectively.
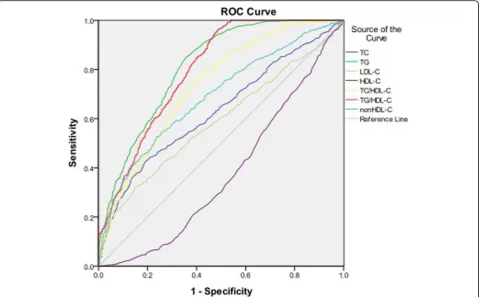
Diagnostic value of lipid parameters for prediabetes As shown in Table5and Fig.2, the AUROCs of TG, TC/ HDL-C and TG /HDL-C were > 0.7. Similar to T2DM, TG and TG/HDL-C also showed the highest diagnostic value for prediabetes. The optimal cutoff points of TG, TC/HDL-C and TG /HDL-C for predicting prediabetes were 1.36 mmol/l, 3.83 and 1.13, respectively (Table5).
Table 1The clinical and biochemical properties of 2680 participants
NGT (n= 1027) IGR(n= 834) T2DM(n= 819) Age(years) 51.81 ± 10.59 57.79 ± 9.19b 60.07 ± 9.17bd
Male/female 415/612 379/455 344/475 Smoking (%) 225(21.91) 269(32.25)b 360(43.95)b,d
SBP(mmHg) 125.57 ± 17.60 136.64 ± 18.45b 141.42 ± 19.44b,d
DBP((mmHg) 77.26 ± 11.00 81.21 ± 11.15b 82.88 ± 11.55b
BMI(kg/m2) 23.68 ± 3.01 25.82 ± 2.98b 26.18 ± 3.10b,c
HDL-C(mmol/l) 1.35 ± 0.31 1.22 ± 0.23b 1.21 ± 0.24b
LDL-C(mmol/l) 2.88 ± 0.63 3.12 ± 0.81b 3.15 ± 0.79b
TC(mmol/l) 4.78 ± 0.82 5.21 ± 0.97b 5.32 ± 1.02b
TG(mmol/l) 1.23 ± 0.56 2.05 ± 0.92b 2.44 ± 1.76b,d
TC/HDL-C 3.65 ± 0.78 4.34 ± 0.83b 4.49 ± 1.01b,d
TG/HDL-C 0.98 ± 0.56 1.74 ± 0.90b 2.20 ± 2.28b,d
non-HDL-C 3.43 ± 0.74 3.98 ± 0.88b 4.10 ± 0.93b,c
FBG(mmol/l) 5.21 ± 0.41 5.86 ± 0.55b 7.44 ± 2.08b,d
2-hPG(mmol/l) 5.89 ± 1.04 8.61 ± 1.35b 14.31 ± 3.94b,d Abbreviations:SBPsystolic blood pressure,DBPdiastolic blood pressure,BMI
body mass index,HDL-Chigh-density lipoprotein cholesterol,LDL-C low-density lipoprotein cholesterol,TCtotal cholesterol,TGtriglyceride,FBGfasting blood glucose,2-hPG2-h post challenge plasma glucose, Compared with NGT,
a P< 0.05,b
P< 0.01; Compared with IGR,c P< 0.05,d
P< 0.01
Table 2Multinomial logistic analysis of the risk factors for type 2 diabetes
Variables Model IGR T2DM
OR(95%CI) P OR(95%CI) P HDL-C(mmol/l) 1 0.168(0.118–0.240) < 0.001 0.142(0.099–0.204) < 0.001
2 0.612(0.282–1.332) 0.216 0.763(0.213–2.737) 0.678 LDL-C(mmol/l) 1 1.571(1.382–1.785) < 0.001 1.675(1.473–1.904) < 0.001
2 1.532(1.178–1.991) 0.001 1.299(0.881–1.915) 0.187 TC(mmol/l) 1 1.690(1.522–1.877) < 0.001 1.888(1.698–2.100) < 0.001
2 1.660(1.341–2.055) < 0.001 1.581(1.149–2.176) 0.005 TG(mmol/l) 1 7.283(6.005–8.833) < 0.001 9.122(7.503–11.09) < 0.001
2 3.954(2.739–5.597) < 0.001 4.677(3.128–6.993) < 0.001 TC/HDL-C 1 3.133(2.743–3.578) < 0.001 3.731(3.255–4.275) < 0.001 2 2.041(1.566–2.661) < 0.001 1.762(1.225–2.536) 0.002 TG/HDL-C 1 6.326(5.244–7.630) < 0.001 7.856(6.498–9.498) < 0.001
2 3.445(2.417–4.912) < 0.001 3.943(2.625–5.923) < 0.001 non-HDL-C 1 2.397(2.118–2.713) < 0.001 2.751(2.426–3.120) < 0.001 2 1.970(1.548–2.506) < 0.001 1.828(1.280–2.612) 0.001
Model 1: unadjusted
Diagnostic value of lipid parameters for IGT or IPH The AUROCs of HDL-C, LDL-C, TC and non-HDL-C for IGT or IPH were < 0.7. Both TG and TG/HDL-C had the AUC > 0.8, showing their predictive values for IGT or IPH. The optimal cutoff points for TG, TC/HDL-C and TG/HDL-C were 1.37 mmol/l, 3.97 and 1.13, re-spectively (Table6, Fig.3).
Discussion
Early detection of prediabetes and T2DM is important for implementing early intervention strategies, yet the traditional OGTT is time-consuming and is difficult to carry out in the general population. Findings from this study show that both TG and TG/HDL-C have high diagnostic values for distinguishing individuals with ab-normal glucose tolerance, indicating that these are promising biomarkers for screening individuals at high risk in the Chinese population.
Serum levels of TC, TG and HDL-C are commonly obtained biomarkers in physical examinations. A cross-sectional study in China found that TC/HDL-C was sig-nificantly related to T2DM [6]. In an Iranian cohort, TC/HDL-C and TG/HDL-C showed similar perform-ance for diabetes prediction. However, HDL-C had a predictive effect for incident diabetes only among women [5]. Khaloo et al. reported that TC, log-transformed TG (Ln-TG), HDL-C, LDL-C, non-HDL-C, Ln-TG/HDL-C and TC/HDL-C were individually associ-ated with the risk of T2DM. With multivariate adjust-ment for factors including fasting plasma glucose (FPG) change, HDL-C, ln-TG/HDL-C and TC/HDL-C remained significantly associated with T2DM risk [7]. Although these studies have documented the effect of dyslipidemia on T2DM, data on the association between lipid parameters and different levels of glucose tolerance are limited.
Increased levels of TG are associated with greater risk of diabetes [8]. In the current study, serum TG level was a strong predictor of prediabetes and T2DM, independ-ent of the other risk factors. The AUROC of TG for pre-dicting T2DM was > 0.8, with a sensitivity of 78.5% and a specificity of 71.4%. The AUROC of TG for predicting prediabetes was > 0.8, with a sensitivity of 80.2% and a specificity of 67.4%. Similar to our findings, a previous prospective study reported that TG is associated with the incidence of T2DM in an Iranian population, inde-pendent of other risk factors [5]. However, the AUROC of TG for predicting T2DM was smaller than in the current study (AUROC 0.5–0.7) and the TG cut off value is 1.98 mmol/l in men and 1.66 mmol/l in women, higher than in our study. The difference in TG levels be-tween the studies might be due to lifestyle and baseline population differences.
Low HDL-C is known to be an important predictor of diabetes [9]. Certain agents known to raise HDL-C also improve glucose metabolism and prevent diabetes [10]. In our study, HDL-C was significantly negatively corre-lated with prediabetes and T2DM. However, after adjust-ment for other risk factors, HDL-C became non-significant, which was consistent with findings reported by Ley et al [11] Khaloo et al. found that a 1-SD change in HDL-C was significantly negatively associated with in-cident T2DM after adjustment for numerous con-founders (HR: 0.84, 95% CI 0.76–0.93) [7]. Our study used baseline values of HDL-C rather than HDL-C change, which could contribute to the divergence be-tween our findings and those of Khaloo et al.
Recent studies have indicated that the accumulation of cholesterol in β cells might contribute to lipotoxicity and βcell dysfunction [12]. A cross-sectional study pro-vided further evidence that elevated serum levels of TC and LDL-C are associated with β cell dysfunction in
Table 3Multinomial logistic analysis of the risk factors for IGT or IPH
Variables Model IGT or IPH
OR(95%CI) P HDL-C(mmol/l) 1 0.162(0.109–0.239) 0.003
2 0.229(0.184–0.486) < 0.001 LDL-C(mmol/l) 1 1.561(1.348–1.808) < 0.001 2 1.584(1.338–1.873) < 0.001 TC(mmol/l) 1 1.722(1.526–1.942) < 0.001 2 1.691(1.473–1.943) < 0.001 TG(mmol/l) 1 7.921(6.303–9.953) < 0.001 2 6.221(4.841–7.933) < 0.001 TC/HDL-C 1 3.205(2.748–3.738) < 0.001 2 2.680(2.242–3.204) < 0.001 TG/HDL-C 1 6.732(5.411–8.376) < 0.001 2 5.535(4.311–7.108) < 0.001 non-HDL-C 1 2.475(2.145–2.856) < 0.001 2 2.180(1.857–2.559) < 0.001
Model 1: unadjusted
Model 2: BP, sex, smoking, age, BMI, FBG and 2-hPG
Table 4ROC curve for predicting type 2 diabetes and cutoff points for maximum sum of sensitivity and specificity
ROC (95%CI)
Cutoff point
participants with normal glucose tolerance [13]. Song et al. [6] showed that levels of TC and LDL-C were indi-vidually associated with T2DM, but the AUROC of TC and LDL-C for T2DM was small (AUROC 0.6–0.7) which is partly consistent with our results. In our study, we showed that TC and LDL-C were positively associ-ated with prediabetes and T2DM, but after adjustment for other risk factors the association between LDL-C and T2DM was no longer statistically significant. The AUROC of TC and LDL-C for prediabetes and T2DM was also small (AUROC 0.5–0.7) in our study.
TG/HDL-C has been studied recently for potential clin-ical uses, including predicting atherosclerotic cardiovascular
disease risk and micro- and macroangiopathies [14, 15]. TG/HDL-C is related to insulin resistance [16, 17] andβ cell function, suggesting it might be a potential tool for identifying people with diabetes [18]. Two prospective stud-ies suggested that high TG/HDL-C increased the risk of in-cident T2DM in the Chinese population [19,20]. Another cross-sectional study in China suggested that TG/HDL-C was a better marker of insulin resistance and diabetes than routine lipid measures [21]. However, limited data were available regarding the association between TG/HDL-C and prediabetes. Our study found evidence that TG/HDL-C was a promising predictor for not only T2DM but also for prediabetes.
TC/HDL-C is an indirect estimate of LDL-C particle number and can be a strong predictor of the risk of ath-erosclerosis and coronary heart disease [22]. The role of TC/HDL-C in T2DM is still controversial. A cross-sectional study of 9078 Chinese individuals found that TC/HDL-C is superior to LDL-C and HDL-C levels at discriminating patients with T2DM [6]. A prospective study reported that TC/HDL-C and TG/HDL-C had similar performance for diabetes prediction in a popula-tion of Iranian men [5]. However, another study found that TC/HDL-C ratio was not a robust predictor of T2DM in high-risk individuals in Iran, with an AUROC of 0.55 [23]. Few studies have been performed to explore
Fig. 1Area under the receiver operating characteristics curves (AUROCs) of lipid markers for type 2 diabetes
Table 5ROC curve for predicting prediabetes and cutoff points for maximum sum of sensitivity and specificity
ROC (95%CI)
Cutoff point
Sensitivity (%)
the relationship between TC/HDL-C ratio and prediabe-tes. In our study, although TC/HDL-C was positively correlated with prediabetes and T2DM, the diagnostic value was less than TG or TG/HDL-C.
Non-HDL cholesterol, including very-low-density lipo-protein (VLDL) remnant particles and intermediate dens-ity particles, is an indirect estimate of LDL particle number, and LDL particle number relates more closely to atherosclerosis and cardiovascular events than does LDL-C [24]. Liu et al. observed that non-HDL-C was superior to traditional cholesterol parameters in predicting incident
diabetes in women but not in men [25]. Ley et al. reported that higher non-HDL-C cholesterol was associated with incident T2DM and was superior to LDL-C or HDL-C cholesterol for distinguishing individuals with and without incident diabetes in an Aboriginal Canadian population [26]. Liu et al. also found that levels of non-HDL-C were elevated in adults with prediabetes [27]. In our study, non-HDL-C was positively correlated with prediabetes and T2DM, with similar AUROCs.
Another major finding in our study is that TG and TG/ HDL-C were associated with IGT and IPH. TG and TG/ HDL-C were therefore potential markers for distinguish-ing individuals with normal FBG but abnormal 2 h-PG. Previous data showed that about half of individuals with undiagnosed diabetes in Asia met the criteria for diabetes on the basis of an elevated 2 h-PG after OGTT, despite their FBG being in the normal range [28]. The risk of de-veloping diabetes was at least partly dependent on their post-load blood glucose level or glucose tolerance status [29, 30]. Individuals with IPH and IGT are often ignored and untreated owing to the higher cost and time-consuming nature of an OGTT; therefore, testing for TG and TG/HDL-C might be a convenient method to esti-mate levels of IPH and IGT. In our study, TG and TG/ HDL-C were associated with IGT or IPH independently
Fig. 2Area under the receiver operating characteristics curves (AUROCs) of lipid markers for prediabetes
Table 6ROC curve for predicting IGT or IPH and cutoff points for maximum sum of sensitivity and specificity
ROC (95%CI)
Cutoff point
Sensitivity (%)
of other risk factors. Our study also found evidence that TG and TG/HDL-C were promising predictors of IGT or IPH. TG and TG/HDL-C are routine tests obtained dur-ing general physical examination. On the basis of these two commonly used indexes, high risk individuals can be rapidly identified and recommended to receive an OGTT.
Several limitations should be considered when inter-preting the results of this study. First, the cross-sectional study design limits the ability to infer causality between lipid ratios and diabetes. Second, all participants were recruited from Jiangsu province, China. Therefore, it is uncertain whether these results are generalizable to other ethnic groups. Finally, the incidence of prediabetes and T2DM in individuals with TG and TG/HDL-C values above the cutoff values identified in this study re-quires exploration in a longitudinal study.
Conclusions
This is the first study performed in a Chinese population demonstrating that TG and TG/HDL-C correlate not only with prediabetes and T2DM but also with IGT or IPH. This study shows the promising values of TG and TG/HDL-C are accessible biomarkers for distinguishing individuals with different levels of glucose tolerance, in-cluding those with normal FBG but abnormal 2-hPG.
Abbreviations
2-hPG:2-h postchallenge plasma glucose; AUC: Area under the curve; BMI: Body mass index; CI: Confidence intervals; DBP: Diastolic blood pressure; FBG: Fasting blood glucose; HDL-C: High-density lipoprotein cholesterol; IGT: Impaired glucose tolerance; IPH: Isolated post-challenge hyperglycemia; LDL-C: Low-density lipoprotein cholesterol; NGT: Normal glucose tolerance; OGTT: Oral glucose tolerance test; OR: Odds ratio; ROC: Receiver operating characteristics; SBP: Systolic blood pressure; T2DM: Type 2 diabetes; TC: Total cholesterol; TG: triglyceride
Acknowledgments
We appreciate the help and support from all participants who took part in the study.
Authors’contributions
WG, NX and QZ participated in the study design. WG, QP, JL, XL and WZ were involved in the conduct of the study and data collection. WG and JW made contributions to data analysis and results interpretation. WG, QP and QZ wrote and modified the manuscript and prepared tables and figures. All authors read and approved the final manuscript.
Funding
This study was supported by National Natural Sciences Foundation of China (No. 81703027) and Science and Technology Department of Jiangsu Province (No. SBE2016740780).
Availability of data and materials
Data sharing is not applicable to this article as no data sets were generated or analyzed during the current study.
Ethics approval and consent to participate
This study was approved by the Ethical Committee of the First Affiliated Hospital of Nanjing Medical University (2016-SR-220). All subjects signed informed consent forms.
Consent for publication
Not applicable.
Competing interests
The authors declare that they have no competing interests.
Received: 19 December 2018 Accepted: 17 May 2019
References
1. Xu Y, Wang L, He J, Bi Y, Li M, Wang T, Wang L, Jiang Y, Dai M, Lu J, Xu M, Li Y, Hu N, Li J, Mi S, Chen C, Li G, Mu Y, Zhao J, Kong L, Chen J, Lai S, Wang W, Zhao W, Ning G. Prevalence and control of diabetes in Chinese adults. JAMA. 2013;310(9):948–59.
2. Barzin M, Hosseinpanah F, Malboosbaf R, Hajsheikholeslami F, Azizi F. Isolated post-challenge hyperglycaemia and risk of cardiovascular events: Tehran lipid and glucose study. Diab Vasc Dis Res. 2013;10(4):324–9. 3. Suzuki K, Takano H, Kubota Y, Inui K, Nakamura S, Tokita Y, Kato K, Asai K,
Shimizu W. Plaque characteristics in coronary artery disease patients with impaired glucose tolerance. PLoS One. 2016;11(12):e0167645.
4. Zhang M, Zhou J, Liu Y, Sun X, Luo X, Han C, Zhang L, Wang B, Ren Y, Zhao Y, Zhang D, Liu X, Hu D. Risk of type 2 diabetes mellitus associated with plasma lipid levels: the rural Chinese cohort study. Diabetes Res Clin Pract. 2018;135:150–7.
5. Hadaegh F, Hatami M, Tohidi M, Sarbakhsh P, Saadat N, Azizi F. Lipid ratios and appropriate cut off values for prediction of diabetes: a cohort of Iranian men and women. Lipids Health Dis. 2010;9:85.
6. Song Q, Liu X, Wang A, Wang Y, Zhou Y, Zhou W, Wang X. Associations between non-traditional lipid measures and risk for type 2 diabetes mellitus in a Chinese community population: a cross-sectional study. Lipids Health Dis. 2016;15:70.
7. Khaloo P, Hasheminia M, Tohidi M, Abdi H, Mansournia MA, Azizi F, Hadaegh F. Impact of 3-year changes in lipid parameters and their ratios on incident type 2 diabetes: Tehran lipid and glucose study. Nutr Metab (Lond). 2018;15:50.
8. Gao YX, Man Q, Jia S, Li Y, Li L, Zhang J. The fasting serum triglyceride levels of elderly population with different progression stages of diabetes mellitus in China. J Diabetes Complicat. 2017;31(12):1641–7.
9. Li J, Cao YF, Sun XY, Han L, Li SN, Gu WQ, Song M, Jiang CT, Yang X, Fang ZZ. Plasma tyrosine and its interaction with low high-density lipoprotein cholesterol and the risk of type 2 diabetes mellitus in Chinese. J Diabetes Investig. 2019;10(2):491–8.
10. Drew BG, Duffy SJ, Formosa MF, Natoli AK, Henstridge DC, Penfold SA, Thomas WG, Mukhamedova N, de Courten B, Forbes JM, Yap FY, Kaye DM, van Hall G, Febbraio MA, Kemp BE, Sviridov D, Steinberg GR, Kingwell BA. High-density lipoprotein modulates glucose metabolism in patients with type 2 diabetes mellitus. Circulation. 2009;119(15):2103–11.
11. Ley SH, Harris SB, Connelly PW, Mamakeesick M, Gittelsohn J, Wolever TM, Hegele RA, Zinman B, Hanley AJ. Utility of non-high-density lipoprotein cholesterol in assessing incident type 2 diabetes risk. Diabetes Obes Metab. 2012;14(9):821–5.
12. Kong FJ, Wu JH, Sun SY, Zhou JQ. The endoplasmic reticulum stress/ autophagy pathway is involved in cholesterol-induced pancreaticβ-cell injury. Sci Rep. 2017;7:44746.
13. Zheng T, Gao Y, Tian H. Relationship between blood lipid profiles and pancreatic isletβcell function in Chinese men and women with normal glucose tolerance: a cross-sectional study. BMC Public Health. 2012;12:634. 14. Yokoyama K, Tani S, Matsuo R, Matsumoto N. Increased
triglyceride/high-density lipoprotein cholesterol ratio may be associated with reduction in the low-density lipoprotein particle size: assessment of atherosclerotic cardiovascular disease risk. Heart Vessel. 2019;34(2):227–36. 15. Lee MY, Hsiao PJ, Huang JC, Hsu WH, Chen SC, Chang JM, Shin SJ.
Associations between triglyceride/high-density lipoprotein cholesterol ratio and micro- and macroangiopathies in type 2 diabetes mellitus. Endocr Pract. 2018;24(7):615–21.
16. Zhou M, Zhu L, Cui X, Feng L, Zhao X, He S, Ping F, Li W, Li Y. The triglyceride to high-density lipoprotein cholesterol (TG/HDL-C) ratio as a predictor of insulin resistance but not ofβcell function in a Chinese population with different glucose tolerance status. Lipids Health Dis. 2016; 15:104.
17. Uruska A, Zozulinska-Ziolkiewicz D, Niedzwiecki P, Pietrzak M, Wierusz-Wysocka B. TG/HDL-C ratio and visceral adiposity index may be useful in assessment of insulin resistance in adults with type 1 diabetes in clinical practice. J Clin Lipidol. 2018;12(3):734–40.
18. Maturu A, DeWitt P, Kern PA, Rasouli N. The triglyceride to high-density lipoprotein cholesterol (TG/HDL-C) ratio as a predictor ofβ-cell function in African American women. Metabolism. 2015;64(5):561–5.
19. He S, Wang S, Chen X, Jiang L, Peng Y, Li L, Wan L, Cui K. Higher ratio of triglyceride to high-density lipoprotein cholesterol may predispose to diabetes mellitus: 15-year prospective study in a general population. Metabolism. 2012;61(1):30–6.
20. Cheng C, Liu Y, Sun X, Yin Z, Li H, Zhang M, Zhang D, Wang B, Ren Y, Zhao Y, Liu D, Zhou J, Liu X, Liu L, Chen X, Liu F, Zhou Q, Hu D. Dose–response association between the triglycerides: high-density lipoprotein cholesterol ratio and type 2 diabetes mellitus risk: the rural Chinese cohort study and meta-analysis. J Diabetes. 2019;11(3):183–92.
21. Lin D, Qi Y, Huang C, Wu M, Wang C, Li F, Yang C, Yan L, Ren M, Sun K. Associations of lipid parameters with insulin resistance and diabetes: a population-based study. Clin Nutr. 2018;37(4):1423–9.
22. Kazemi T, Hajihosseini M, Moossavi M, Hemmati M, Ziaee M. Cardiovascular risk factors and Atherogenic indices in an Iranian population: Birjand east of Iran. Clin Med Insights Cardiol. 2018;12:1179546818759286.
23. Janghorbani M, Amini M. Utility of serum lipid ratios for predicting incident type 2 diabetes: the Isfahan diabetes prevention study. Diabetes Metab Res Rev. 2016;32(6):572–80.
24. CarbayoHerencia JA, Simarro Rueda M, PalazónBru A, Molina Escribano F, Ponce García I, ArtigaoRódenas LM, Caldevilla Bernardo D, Divisón Garrote JA, Gil Guillén VF. Evaluation of HDL cholesterol as a predictor of non-fatal cardiovascular events in a prospective population cohort. Clin Investig Arterioscler. 2018;30(2):64–71.
25. Liu L, Li Q, Yuan Z, Zhao M, Zhang X, Zhang H, Zheng D, Xu J, Gao L, Guan Q, Zhao J, Proud CG, Wang X, Hou X. Non-high-density lipoprotein cholesterol is more informative than traditional cholesterol indices in predicting diabetes risk for women with normal glucose tolerance. J Diabetes Investig. 2018;9(6):1304–11.
26. Ley SH, Harris SB, Connelly PW, Mamakeesick M, Gittelsohn J, Wolever TM, Hegele RA, Zinman B, Hanley AJ. Utility of non-high-density lipoprotein cholesterol in assessing incident type 2 diabetes risk. Diabetes Obes Metab. 2012;14(9):821–5.
27. Liu JR, Liu BW, Yin FZ. Change in non high-density lipoprotein cholesterol levels in adults with prediabetes. Medicine (Baltimore). 2017;96(44):e8461. 28. Qiao Q, Nakagami T, Tuomilehto J, Borch-Johnsen K, Balkau B, Iwamoto Y,
Tajima N. International diabetes epidemiology group, DECODA study group. Comparison of the fasting and the 2-h glucose criteria for diabetes in different Asian cohorts. Diabetologia. 2000;43(12):1470–5.
29. Abdul-Ghani M, Abdul-Ghani T, Ali N, Defronzo RA. One-hour plasma glucose concentration and the metabolic syndrome identify subjects at high risk for future type 2 diabetes. Diabetes Care. 2008;31(8):1650–5. 30. Unwin N, Shaw J, Zimmet P, Alberti KG. Impaired glucose tolerance and
impaired fasting glycaemia: the current status on definition and intervention. Diabet Med. 2002;19(9):708–23.
Publisher’s Note