RESEARCH
Simulating cyanobacterial phenotypes
by integrating flux balance analysis, kinetics,
and a light distribution function
Lian He
1, Stephen G. Wu
1, Ni Wan
2, Adrienne C. Reding
3and Yinjie J. Tang
1*Abstract
Background: Genome-scale models (GSMs) are widely used to predict cyanobacterial phenotypes in photobiore-actors (PBRs). However, stoichiometric GSMs mainly focus on fluxome that result in maximal yields. Cyanobacterial metabolism is controlled by both intracellular enzymes and photobioreactor conditions. To connect both intracel-lular and extracelintracel-lular information and achieve a better understanding of PBRs productivities, this study integrates a genome-scale metabolic model of Synechocystis 6803 with growth kinetics, cell movements, and a light distribution function. The hybrid platform not only maps flux dynamics in cells of sub-populations but also predicts overall pro-duction titer and rate in PBRs.
Results: Analysis of the integrated GSM demonstrates several results. First, cyanobacteria are capable of reaching high biomass concentration (>20 g/L in 21 days) in PBRs without light and CO2 mass transfer limitations. Second, fluxome in a single cyanobacterium may show stochastic changes due to random cell movements in PBRs. Third, insufficient light due to cell self-shading can activate the oxidative pentose phosphate pathway in subpopulation cells. Fourth, the model indicates that the removal of glycogen synthesis pathway may not improve cyanobacterial bio-production in large-size PBRs, because glycogen can support cell growth in the dark zones. Based on experimen-tal data, the integrated GSM estimates that Synechocystis 6803 in shake flask conditions has a photosynthesis effi-ciency of ~2.7 %.
Conclusions: The multiple-scale integrated GSM, which examines both intracellular and extracellular domains, can be used to predict production yield/rate/titer in large-size PBRs. More importantly, genetic engineering strategies predicted by a traditional GSM may work well only in optimal growth conditions. In contrast, the integrated GSM may reveal mutant physiologies in diverse bioreactor conditions, leading to the design of robust strains with high chances of success in industrial settings.
Keywords: Glycogen, Multiple-scale modeling, Photobioreactors, Photosynthesis efficiency, Self-shading, Synechocystis 6803
© 2015 He et al. This article is distributed under the terms of the Creative Commons Attribution 4.0 International License (http:// creativecommons.org/licenses/by/4.0/), which permits unrestricted use, distribution, and reproduction in any medium, provided you give appropriate credit to the original author(s) and the source, provide a link to the Creative Commons license, and indicate if changes were made. The Creative Commons Public Domain Dedication waiver (http://creativecommons.org/publicdomain/ zero/1.0/) applies to the data made available in this article, unless otherwise stated.
Background
In photobioreactors (PBRs), light penetration depth at high cell density can be as short as a few centimeters [1]. Thus, during large-size PBR cultivation, cyanobacte-ria move continuously between the “light zone” (where light is sufficient) and the “dark zone” (where light is
substantially shaded). As a consequence, cyanobacterial metabolism in PBRs is spatially and temporally depend-ent: cells have autotrophic growth in the light zone, and they perform heterotrophic growth in the dark zone by consuming energy-storage compounds. Moreover, PBR performances are also affected by the efficiency of CO2 gas–liquid transfer. To enhance mass transfer, people often use CO2-enriched air in combination with high intensity mixing. Many models have been developed to understand how cyanobacterial physiological dynamics
Open Access
*Correspondence: [email protected]
1 Department of Energy, Environmental and Chemical Engineering, Washington University, St. Louis, MO 63130, USA
are influenced by the light intensity, CO2 supply, tem-perature, and geometry of PBRs [2–6]. Those kinetic and reactor studies are useful in optimizing PBR design and operations. However, bioprocess modeling is unable to provide an understanding of intracellular enzyme func-tions and metabolic fluxes in cyanobacteria. To improve engineered microalgae strains’ metabolisms in large-size PBRs, it is necessary to link process models to metabolic models.
On the other hand, metabolic flux analyses (MFA) can quantify in vivo enzyme reaction rates, and thus allow us to investigate the flux phenotypes resulting from com-plicated gene-protein-metabolite regulations. 13C-MFA measures carbon fluxes through the central metabolism via 13C labeling experiments. Alternatively, genome-scale flux balance analysis (FBA) can generate a holistic intra-cellular flux distribution map [7] owing to its extended coverage of genomic information [8]. Computational platforms, such as COBRA [9] and OptForce [10], can predict genetic targets and guide rational designs of engineered strains. FBA can also be integrated with con-straint-based elementary flux mode analysis to identify optimal pathways for bio-productions [11]. However, an inherent limitation of traditional GSM is that it predicts only flux distributions that result in maximal yields in an optimal culture condition. They cannot forecast mutant strains’ production titers and rates in dynamic and het-erogeneous bioreactors.
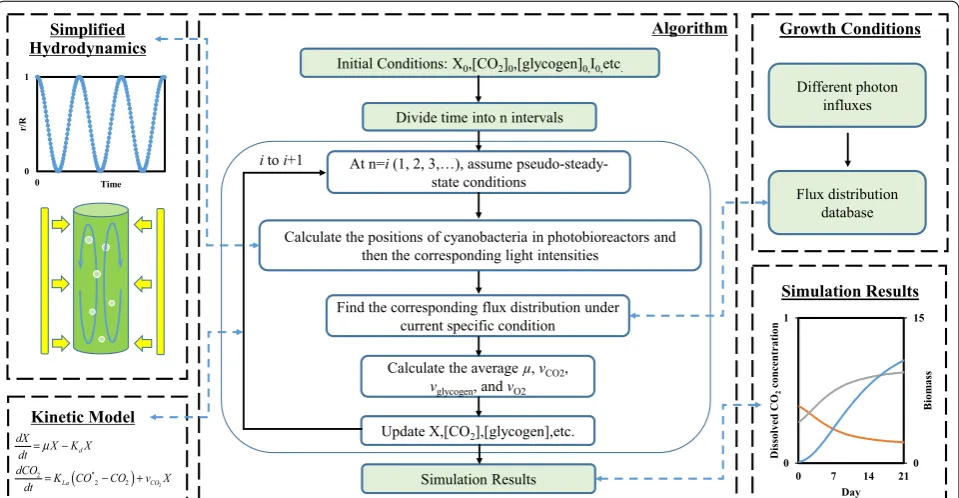
In this study, the major goal is to demonstrate multi-ple-scale modeling approaches by linking cell metabo-lisms to PBR environmental fluctuations. Specifically, the modeling efforts focus on Synechocystis 6803, a most widely used cyanobacterial biorefinery. Appealing traits of this species include amenability to genetic modifica-tions, well-studied genomics, and native genes for bio-synthesis of alkanes/alkenes and hydrogen [12–14]. To predict cyanobacterial growth and metabolic flux phe-notypes in PBR settings, we integrated a genome-scale cyanobacteria model, iJN678 [15], with growth kinetics, cell movements based on reported PBR hydrodynamics, and a heterogeneous light distribution (Fig. 1). The model assumption is that heterogeneous PBR conditions affect cyanobacteria, leading to heterogeneous cell metabolisms in different sub-populations. Such an approach can pro-vide biological information ranging from the intracellu-lar domain to the PBR domain, and fill the gaps between systems biology and the PBR process. The multiple-scale modeling is useful for estimating mutant strains’ poten-tials to achieve the production metrics required for commercialization.
Results
Simulation of cyanobacterial optimal growth in a cylindrical PBR
The integrated GSM was first applied to predict cyano-bacterial growth in a cylindrical PBR, which was assumed
Algorithm Initial Conditions: X0,[CO2]0,[glycogen]0,I0,etc.
Divide time into n intervals
At n=i (1, 2, 3,…), assume pseudo-steady-state conditions
Find the corresponding flux distribution under current specific condition
Calculate the average µ, vCO2,
vglycogen, and vO2
Update X,[CO2],[glycogen],etc.
Simulation Results
i to i+1
Calculate the positions of cyanobacteria in photobioreactors and then the corresponding light intensities
Flux distribution database Different photon
influxes
0 15
0 1
0 7 14 21
Biom
ass
Dissolved
CO
2
concentration
Day
Simulation Results Growth Conditions
0 1
0
r/R
Time
Simplified Hydrodynamics
( ) 2
* 2
2 2
d
La CO
dX X K X
dt
dCO K CO CO v X
dt µ = −
= − +
Kinetic Model
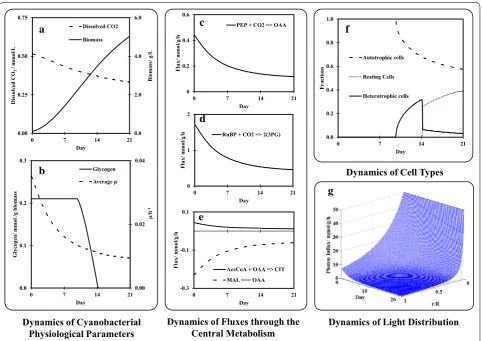
to have a radius of 60 mm and a constant surface light intensity of 50 µE/m2/s. Although the maximal photo-synthetic efficiency in photophoto-synthetic species can reach 4.6–6 % [16], not all incident radiation in PBRs can be efficiently used by cyanobacteria, thereby resulting in a lower conversion efficiency [17]. Hence, we chose a photosynthesis efficiency of 1.5 %, which was within a reasonable range of actual photosynthesis efficiencies of microalgae [18]. Based on a previous study, the mass transfer rate of CO2 was assumed to be 10 h−1 [19]. Under such a condition, cyanobacterial biomass con-centration could increase from 0.1 to 5 g/L in 3 weeks, provided that other mineral nutrients are supplied con-tinuously (Fig. 2a and Additional file 2: Fig. S1). The modelling results also showed continuous decreases in the growth rate (Fig. 2b) and intracellular fluxes in the central metabolism (Fig. 2c–e), which was caused by a
continuous decrease in local light intensity over time (Fig. 2g). As the ‘dark zone’ expanded, some cyanobac-teria switched from autotrophic growth to heterotrophic growth in the late growth phase, and eventually became resting cells (Fig. 2f). The expanding ‘dark zone’ also led to a gradual reduction in glycogen content per gram of biomass, which was the same when all the cells were located in the light zone (Fig. 2b). This prediction agrees with two previous studies [20, 21].
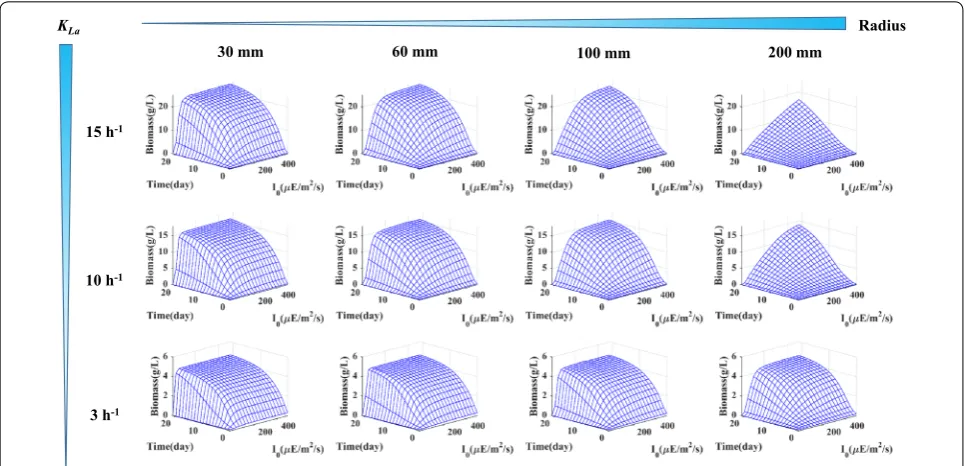
Next, we tested the sensitivity of biomass production to the mass transfer rate, PBR surface light intensity, and PBR diameter (Fig. 3) . With a light intensity of 100 µE/ m2/s and a moderate mass transfer rate of 15 h−1, small PBRs (30 mm radius) could produce 20 g/L of biomass in 21 days. Although such productivity has been exper-imentally observed in small PBRs [22], it can be hardly achieved in large-size PBRs. As shown by the model, the
0.0 2.0 4.0 6.0
0.00 0.25 0.50 0.75
0 7 14 21
Biom
ass/ g/L
Dissolved CO
2
/ mmo
l/L
Day Dissolved CO2
Biomass
a
0.00 0.02 0.04
0.0 0.1 0.2 0.3
0 7 14 21
µ/
h
-1
Glycogen/
mm
ol
/g biom
ass
Day Glycogen Average μ
b
0.0 0.2 0.4 0.6 0.8 1.0
0 7 14 21
Fracti
ons
Day Autotrophic cells
Resting Cells
Heterotrophic cells 0
0.2 0.4 0.6
0 7 14 21
Fl
ux/
mmo
l/g/h
Day
PEP + CO2 => OAA
0 1 2
0 7 14 21
Fl
ux/
mmo
l/g/h
Day RuBP + CO2 => 2(3PG)
-0.3 -0.1 0.1
0 7 14 21
Fl
ux/
mmo
l/g/h
Day
AceCoA + OAA => CIT MAL <=> OAA
Dynamics of Cyanobacterial
Physiological Parameters Dynamics of Fluxes through the Central Metabolism
Dynamics of Cell Types
Dynamics of Light Distribution
c
d
e
f
g
Fig. 2 Simulations of dynamics of cyanobacterial performance in a 60 mm-radius cylindrical PBR under 50 µE/m2/s surface light intensity. a
biomass productivity is highly sensitive to the surface-to-volume ratios of the PBRs, and increasing the PBR diam-eter reduces biomass productivity dramatically. Hence, to improve biomass production in PBRs, one needs to reduce the surface-to-volume ratios, increase the culture mixing and air flow rate [23], and maintain a sufficient surface light intensity.
Finally, the simulations also demonstrate that, due to random cell movements in PBRs, single cell fluxome may show stochastic changes (Additional file 2: Fig. S2 b, c). Additionally, we tested the sensitivity of biomass growth to circulation time. The model indicates that perturb-ing the circulation speeds of cell subpopulations did not affect total biomass production by PBRs, provided that the CO2 mass transfer and surface light were constant (Additional file 2: Fig. S3).
Simulation of cyanobacterial oxidative pentose phosphate pathway in a cylindrical PBR
In cyanobacteria, the oxidative pentose phosphate (OPP) pathway and the Calvin cycle operates in opposite direc-tions: The former generates CO2 and NADPH, while the latter consumes CO2 and NADPH. Figure 2d shows that the Calvin cycle had a strong flux in the early growth phase, while the OPP pathway remained silent under light-sufficient conditions (Fig. 4a). In the late growth stage, active fluxes through the OPP pathway appeared (Fig. 4a) due to the self-shading effect. The activity of the OPP pathway increased concurrently with the glycogen
consumption rate in darkness (Fig. 4a and Additional file 2: Fig. S4). Thus, an active OPP flux in photoauto-trophic cultures is the metabolic response to light defi-ciency in PBRs. Recent 13C-flux measurements also showed positive OPP fluxes in Synechocystis 6803 PBR cultures [24, 25]. To further confirm our model predic-tions, we examined the labelling patterns of histidine by growing Synechocystis 6803 with NaH13CO
3 and [1-13C] glucose. When glucose was metabolized via the OPP pathway, non-labeled ribose-5-phosphate was generated from [1-13C] glucose [26], which is a precursor to histi-dine. Therefore, an active OPP pathway was expected to reduce the 13C-enrichment of proteinogenic histidine. Figure 3b shows that the 12C-concentration of histidine was high under low light conditions, supporting the model prediction that light deficiency leads to an active OPP pathway for C6 sugar utilizations.
Investigation of cyanobacterial photosynthesis efficiency in shake flasks
Next, we used the integrated GSM to determine the pho-tosynthesis efficiency of Synechocystis 6803 by minimiz-ing the sum of squared errors between experimental and simulated averaged specific grow rates. We simplified the geometry of the shake flasks into a two-dimensional rec-tangle (Additional file 2: Fig. S5), and made the local light intensity dependent on the vertical distance from a cell to the light source. The CO2 mass transfer rates in shake flasks were calculated based on Eq. (9). As a consequence,
KLa
15 h-1
10 h-1
Radius 200 mm
100 mm 30 mm
3 h-1
60 mm
Fig. 3 Test of biomass growth performance sensitivity to the mass transfer rate (KLa in h−1), surface light intensity (I0 in µE/m2/s), and the bioreactor
a photosynthesis efficiency of 2.7 % (Additional file 2: Fig. S6) resulted from the best fit of specific growth rates under shake flask cultures (Diamond and circle markers in Fig. 5). Furthermore, this photosynthesis efficiency was used to simulate the growth of Synechococcus
elon-gatus UTEX 2973 (a fast-growing cyanobacterium
spe-cies) in a column PBR (with 3 % CO2 and under 500 µE/ m2/s light intensity) [27]. The model predicted slightly lower specific growth rate than the experimental value (Square marker in Additional file 2: Fig. S5). This differ-ence is possibly due to an increased photosynthesis activ-ity under high CO2 concentrations [28].
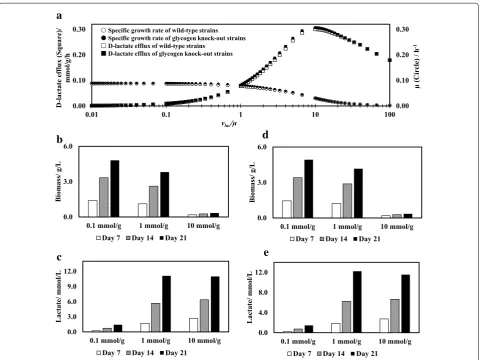
Model‑based investigation of lactate production by engineered cyanobacteria in PBRs
We further applied the integrated GSM to predict the growth and volumetric d-lactate productivity of engi-neered cyanobacterial strains, in which a mutated glyc-erol dehydrogenase was overexpressed for producing optically pure d-lactate [29]. The MOMA algorithm was applied to simulate the metabolism in engineered strains (See Methods). Growth-associated lactate production was assumed (i.e., lactate production was proportional to biomass synthesis). First, we tested the relationship between lactate efflux (vlac) and specific growth rate (µ)
using only the FBA model. Figure 6a shows vlac and µ as
functions of the ratio vlac/µ, which denotes the amount
of lactate produced per gram of biomass (or mmol lactate/g biomass). Within a wide vlac/µ range, from 0.01
to 100 mmol lactate/g biomass, µ decreased with increas-ing vlac/µ, but vlac showed a parabolic tendency, peaking
at 0.3 mmol/g/h (Fig. 6a). Next, we used the integrated
GSM to simulate the cyanobacterial growth and D-lac-tate production in PBRs at different vlac/µ ratios (Fig. 6b,
c). As a result, increasing the vlac/µ ratio led to lower
bio-mass production, which, however, did not necessarily
0 0.2 0.4 0.6 0.8
M+0 M+1 M+2 M+3 M+4 M+5 M+6
Relative
Abundanc
e
Low light/ early growth phase Low light/ late growth phase High light/ late growth phase Histidine [M-57]+
b
0.0000 0.0040 0.0080 0.0120
1g/L of
Biomass Biomass2g/L of Biomass3g/L of MaximumFlux
Fl
ux th
ro
ugh the OP
P
pathway/
mmo
l/g/h Wild-type strain
Glycogen-rich strain
*
*
a
Fig. 4 The oxidative pentose phosphate (OPP) pathway in cyanobacteria. a Comparison of simulated fluxes through the OPP pathway between wild-type (black bars) and glycogen-rich (white bars) cyanobacteria strains at different biomass concentrations. ‘Asterisk’ means the flux is zero. Com-pared to the wild type strain, the model assumes that the glycogen-rich strain accumulates five times more glycogen during autotrophic growth and consumes glycogen five times faster during heterotrophic growth. b Relative abundance of histidine labeling profile under different Synecho-cystis growth phases. Black bars (low light/early growth phase): light intensity of ~50 µE/m2/s; white bars (low light/late growth phase): light intensity
of ~50 µE/m2/s; grey bars (high light/late growth phase): light intensity of ~100 µE/m2/s
0.000 0.050 0.100 0.150
0.000 0.050 0.100 0.150
Specific
gr
owth rate determ
ined
by
experiment
Specific growth rate determined by model Fig. 5 Comparison of experimental and simulation results of cyano-bacterial growth rates in shake flasks. Diamond markers represent cultures with different volumes under the same light intensity of ~50 μE/m2/s. The volumes are 50, 100, and 150 mL, respectively,
cor-responding to diamond markers from top to bottom.Circle markers represent 15 mL cultures growing under different light conditions. The light intensities are ~15, ~25 and ~35 μE/m2/s, respectively,
cor-responding to circle markers from top to bottom. The specific growth rates were calculated based on OD730 values in the early exponential
improve the overall d-lactate production. For example, when vlac/µ was increased from 1 to 10 mmol/g, lactate
production in PBRs remained the same, but biomass production was significantly diminished. Enhancing the lactate pathway (i.e., increase vlac/µ ratio) can improve
lactate production, but excessive overexpression of this pathway may sacrifice biomass growth and impair overall lactate productivity. To resolve this problem, it is desir-able to induce the lactate synthesis pathway at late bio-mass growth phase.
Deleting carbon storage in cyanobacteria is one strat-egy to redirect carbon flux to product synthesis [30]. However, the integrated GSM shows that such a strategy may not offer significant improvements in final lactate productivity in PBRs (Fig. 6a, d, e). This finding is con-sistent with two recent reports: (1) Glycogen knockout did not enhance lactate productivity under nutrient-suf-ficient growth conditions [30]. (2) Removal of glycogen
in an isobutanol-producing cyanobacterium yielded no benefit in production titer and rate [31]. Possibly, glyco-gen serves as the carbon and energy reservoir to store the energy and carbon excess flow in the light zone, and this carbon and energy reservoir can maintain redox homeo-stasis under stressed growth conditions or in darkness [32]. Therefore, deleting glycogen or other carbon storage may impair cyanobacterial survival as well as its resist-ance to environmental stresses and contaminations.
Discussion
In this study, a genome-scale FBA model was integrated with information on kinetics, light distribution, and cell movement. Using the integrated GSM, one can simul-taneously learn both intracellular information (e.g., flux distributions as functions of time) and extracellular infor-mation (e.g., growth curve and nutrient changes in the medium) simultaneously.
a
0.00 0.10 0.20 0.30
0.00 0.10 0.20 0.30
0.01 0.1 1 10 100
µ (Cir
cle)
/ h
-1
D-lactate
efflux (Squa
re
)/
mm
ol
/g/h
vlac/µ
c
e
d
b
0.0 3.0 6.0
0.1 mmol/g 1 mmol/g 10 mmol/g
Biom
ass/ g/
L
Day 7 Day 14 Day 21
0.0 3.0 6.0 9.0 12.0
0.1 mmol/g 1 mmol/g 10 mmol/g
Lactate/
mmo
l/L
Day 7 Day 14 Day 21
0.0 3.0 6.0
0.1 mmol/g 1 mmol/g 10 mmol/g
Biom
ass/ g/
L
Day 7 Day 14 Day 21
0.0 4.0 8.0 12.0
0.1 mmol/g 1 mmol/g 10 mmol/g
Lactate/
mmo
l/L
Day 7 Day 14 Day 21
Specific growth rate of wild-type strains Specific growth rate of glycogen knock-out strains D-lactate efflux of wild-type strains
D-lactate efflux of glycogen knock-out strains
Fig. 6 Simulation results of d-lactate producing cyanobacteria performance. a FBA simulations of d-lactate flux and growth rate as functions of vlac/µ (mmol lactate/g biomass). Whitemarkers wild-type strain, black markers glycogen-knockout strain. b, c Simulation of biomass growth (b) and
d-lactate production (c) of wild-type cyanobacteria at different vlac/µ ratios in a cylindrical PBR. d, e Simulation of biomass growth (d) and d-lactate
In the extracellular domain, the integrated GSM can describe changes in nutrient concentrations, biomass accumulation, and local light intensities. As demonstrated by Fig. 3, cyanobacteria are intrinsically capable of reach-ing high biomass concentration in PBRs, however, their performance is usually limited by low light availability and low mass transfer rate. To reduce cell self-shading, high surface-to-volume ratio PBRs equipped with thin panel or hollow fibers have been employed [23]. To improve the mass transfer rate, enhancing aeration rates has proved efficient [19]. Better mixing conditions not only lead to better gas transfer rates, but also help maintain more homogeneous conditions for both cells and nutrients.
In the intracellular domain, we observed continu-ously changing fluxes in the cyanobacterial metabolic network, which were mostly affected by reduced energy and carbon inputs. One interesting finding is the OPP pathway activation as cell cultures get denser. It is a tra-ditional point of view that the Calvin cycle and the OPP pathway are separate systems because the two pathways are reciprocally regulated [33]. In this study, the inte-grated GSM describes that these two pathways could be employed by two different subpopulations in PBRs at the same time. This simulation explains that a measure-able flux through the OPP pathway could be observed in both wild type and engineered cyanobacterial strains via 13C-based flux analysis [24, 25]. In addition, the elemen-tary modes analysis shows that the Calvin cycle and the OPP pathway may function in complementary ways in photoautotrophs, since an active OPP pathway ensures a maintainable flux to triose phosphate synthesis from carbohydrate degradation in low light or darkness [33]. Furthermore, we noticed that an active OPP pathway was always present in the d-lactate producing strain, and it became stronger with increased d-lactate produc-tion (Addiproduc-tional file 2: Fig. S7). This indicates that the enhanced OPP activity benefits bio-production by pro-viding more reducing power. In summary, the plasticity of the OPP pathway endows cells with high vitality and energy flexibility [34, 35].
The traditional FBA model usually describes the opti-mal growth condition, and thus it may not be suitable for suboptimal and heterogeneous cultivation conditions. Our model, on the other hand, is integrated with growth kinetics and a heterogeneous light distribution in PBRs. Hence, the model can not only predict the production yield, titer and rate, but also offer insights into how cells adjust their internal metabolisms to survive under dif-ferent growth conditions and genetic manipulations. Moreover, the integrated GSM may give more accurate predictions of mutant physiology than GSM alone in bioreactor conditions. For example, the integrated GSM correctly indicates that glycogen knockout may not be
an effective strategy to improve PBR lactate production. Lastly, the integrated GSM can reveal real-time varia-tions/dynamics in metabolisms of different subpopula-tion cells, and thus improve understandings of cellular responses to large-size PBRs.
Nevertheless, our model still has limitations. For exam-ple, previous studies have shown that glycogen synthesis could be connected with unknown regulations affecting cyanobacterial viability under stress conditions [32, 36]. However, the integrated GSM may not give the same prediction without further constraints from knowledge of genetic regulations. Additionally, it has been demon-strated that cyanobacteria have circadian behaviors (i.e., their metabolism exhibits day and night rhythms) [37], while our model does not include this property. Finally, some inhibition factors may also influence cyanobacterial growth (e.g., effects of crowding), which are not included in the model. In the future, this model platform should be further improved via additional multi-scale modeling approaches.
Conclusion
This study demonstrates a genome-scale FBA model inte-grated with kinetics, cell movements, and a light distribu-tion funcdistribu-tion. With constraints obtained from bioprocess variables, the integrated GSM can not only simulate the dynamic metabolisms in sub-population cells but also predict PBR overall productivity under light and CO2 conditions. The integration of GSMs with PBR modeling can facilitate the development of new cyanobacterial strains for industrial settings.
Methods Cell cultivation
Synechocystis PCC 6803 was cultivated in a modified
BG-11 medium [26] at 30 °C and 180 rpm. We first tested the cyanobacterial growth in different culture volumes. In brief, 50, 100, and 150 mL of cell suspensions were cultivated in 250 mL shake flasks under continuous illu-mination of ~50 µE/m2/s. We also tested the cyanobacte-rial growth under different light conditions. Specifically, 15 mL of cultures were grown in 150 mL shake flasks under different light intensities (from ~15 to ~35 µE/ m2/s). OD
730 was used to measure biomass density, and the relationship between the biomass concentration and OD730 was 0.45 × OD730 = Biomass (g/L) [26]. We made duplicate cultures of each condition (n = 2).
13C‑Labelling experiment
[1-13C] glucose and 4 g/L NaH13CO
3 (tracers were pur-chased from Sigma-Aldrich, Saint Louis, USA). The TBDMS (N-tert-butyldimethylsilyl-N -methyltrifluoro-acetamide) method [26] was used to analyze the labeling patterns of proteinogenic histidine. In brief, cells were har-vested by centrifugation, and cell pellets were hydrolyzed in 6 mol/L HCl solution at 100 °C for 24 h. The amino acid solution was air-dried and then derivatized by TBDMS (Sigma-Aldrich, USA) at 70 °C for 1 h. A gas chromato-graph (GC) (Hewlett-Packard model 7890A; Agilent Tech-nologies, CA) equipped with a DB5-MS column (J&W Scientific, Folsom, CA) and a mass spectrometer (model 5975C; Agilent Technologies, CA) were used for analyz-ing amino acid labelanalyz-ing profiles. The GC–MS fragment [M-57]+ contains the complete amino acid backbone, and MS data M + 0, M + 1, and M + 2 represent isotopomers with zero, one, and two 13C atoms, respectively.
Flux balance analysis model
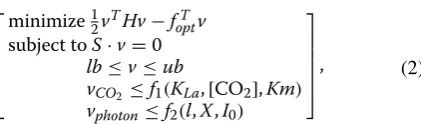
The FBA model was modified from the cyanobacte-rial model iJN878 [15], which has 843 reactions, includ-ing photosynthesis and the central carbon metabolism. A complete list of reactions is provided in Additional file 1. The iJN878 model contains a recently discovered γ-aminobutyrate shunt [38] which converts 2-oxoglutar-ate to succin2-oxoglutar-ate in Synechocystis 6803. In our model, two new reactions were added, namely ‘glycogen storage → glycogen [c]’ and ‘d-lactate [c] → d-lactate [external]’, which were respectively used to simulate glycogen stor-age/consumption and d-lactate production by an engi-neered cyanobacterial strain [29]. The mathematical description of our FBA model is as follows:
where µ represents the specific growth rate, S is the stoi-chiometric matrix, v represents a vector of flux distribu-tion, and lb and ub represent vectors of the lower and upper boundaries, respectively. Further, f1 is a function of
the mass transfer coefficient KLa, dissolved CO2 concen-tration [CO2], and half-saturation constant for dissolved CO2, Km; f2 is a function of the cell’s local position l,
bio-mass concentration X, and photon influx on the PBR sur-face vphoton,0. The linear optimization problem was solved
by the MATLAB® (2012b) built-in function ‘linprog’ using the ‘simplex’ algorithm. To estimate the flux distribution in engineered cyanobacterial strains, we used the MOMA (minimization of metabolic adjustment) algorithm [39], which was solved by the MATLAB built-in function ‘quadprog’ using the ‘interior-point-convex’ algorithm:
(1)
maximizeµ subject toS·v=0
lb≤v≤ub
vCO2 ≤f1(KLa,[CO2],Km)
vphoton ≤f2
�
l,X,vphoton,0�
,
where H is a unit matrix, and fopt is the optimal flux
dis-tribution of wild-type cyanobacteria. The remaining notations have the same meanings as above.
Moreover, we considered three growth states for cyanobacteria in the FBA model: (1) the ‘light condition’: an autotrophic sub-population in the light zone, (2) the ‘dark condition’: a heterotrophic sub-population in the dark zone, where the photon influx is below 0.4 mmol/ g/h (under which the cyanobacterial growth rate is lower than the heterotrophic growth rate in darkness) and gly-cogen is consumed at a rate of 0.01 mmol/g/h [40] to maintain minimal growth, and (3) the ‘resting condition’: a glycogen-depleted sub-population with no active fluxes in the dark zone. To improve the calculation efficiency, we built a database containing all the flux distributions in response to different photon influxes (Additional file 1). By having such a database, we could directly use pre-cal-culated fluxome from the database according to culture conditions in PBRs. Thereby, we did not need to redo flux calculations at each time interval during new simulations.
Simulation of cyanobacterial growth via integrating FBA, kinetics, and cell movements
Figure 1 shows our modeling algorithm. To simulate bio-mass growth as a function of time, we divided the entire time period into finite intervals of 0.002 h (Additional file 2: Fig. S1 shows that further decreasing the interval period did not change the simulation results). In each time interval, a simplified sinusoid equation [41] was used to estimate the cell location in a well-mixed PBR:
where l is the shortest distance between the PBR surface and the cell local position, in mm; r is the radius or thick-ness of the PBR, in mm; fr represents the cyanobacteria
circulation frequency, in h; and t is time, in h. Because cell circulation frequencies in PBRs vary from cell to cell, stochastic effects are induced on a single cell’s metabo-lism. In fact, the random movements of cells in PBRs have been measured and simulated, and, in the present study, are described by a probability distribution function [42]. In our model platform, we distinguished cell popu-lations with different circulation times (Additional file 2: Fig. S2-3). Thus, the whole culture was considered to be comprised of twelve sub-populations instead of a pleth-ora of cyanobacterial cells. Based on cell locations and
(2)
minimize12vTHv−foptT v
subject toS·v=0
lb≤v≤ub
vCO2 ≤f1(KLa,[CO2],Km) vphoton ≤f2(l,X,I0)
,
(3) l= r
2−
r
2cos( 2π
the biomass concentrations, we calculated the local light intensity [43]:
where vphoton and vphoton,0 represent the local and surface
photon influxes, respectively, in mmol/g/h; and X is bio-mass concentration, in g/L.
The CO2 uptake flux was described by a Michaelis– Menten equation:
where vCO2,max is the maximum uptake rate of dissolved
CO2/HCO3−, Km is the half-saturation constant, and
[CO2] represents dissolved CO2 concentration. This study assumed that pH was constant at 8.0, and that the dissolved CO2 and cell culture were homogeneous in PBRs. Because we assumed that cell metabolism was pseudo-steady in each interval [44], the FBA model could use linear optimization to profile the intracellular fluxes constrained by light and carbon input fluxes (Eqs. 4 and 5). The FBA model then pre-dicted the growth rates, glycogen synthesis rates, and CO2 uptake rates of cell populations with different circulation times in PBRs. Those values were averaged based on the probability distribution function (Additional file 2: Fig. S2a):
where Pi is the fraction of ith cell population (Additional
file 2: Fig. S2a), µapp is the apparent specific growth rate (4) vphoton
vphoton,0 =
1
(0.0216·l+1)1.54(0.130·X· +1)1.18
,
(5) vCO2 =vCO2,max [CO2]
Km+ [CO2] ,
(6) µapp=
n
i=1
Piµi
vCO2,app=
n
i=1
PivCO2,i
vglycogen,app=
n
i=1
Pivglycogen,i,
in PBRs, vCO2,app is the apparent CO2 uptake rate, and vglycogen,app is the overall glycogen production rate.
For the kinetic model, we used ordinary differential equations (ODEs) to describe changes in biomass pro-duction, glycogen accumulation, dissolved CO2/HCO3− concentrations, and so forth.
The ODEs were resolved in their numerical discrete form (Euler-like integration scheme):
where i and i + 1 represent the current and next intervals, respectively; Δt is the time interval (0.002 h); Kd is the death
rate, in h−1; β is the glycogen composition in the biomass, in mmol/g; [glycogen] is the overall glycogen concentration in the PBR, in mmol/L; KLa is the mass transfer rate of CO2, in h−1; [CO
2] represents the dissolved CO2 and HCO3− concentrations, in mmol/L; [CO2]* is the combined con-centrations of dissolved CO2 and HCO3− in equilibrium with atmospheric CO2 (0.039 %, v/v), in mmol/L; and µapp,
vglycogen,app, and vCO2,app are fluxes determined previously.
The updated values of the biomass concentration, dissolved CO2 concentration, etc., were then used to constrain the FBA model in the next interval. The kinetic parameters are given in Table 1. For shake flask conditions, KLa was
deter-mined by the following equation: [45]
(7)
dX
dt =µapp·X−Kd·X d[glycogen]
dt =vglycogen,app·X−β·Kd·X
d[CO2]
dt =KLa·([CO2]
∗
− [CO2])+vCO2,app·X,
(8) Xi+1=Xi+µapp·Xi·�t−Kd·Xi·�t
[glycogen]i+1= [glycogen]i+vglycogen,app·Xi·
�t−β·Kd·Xi·�t
[CO2,i+1] = [CO2,i] +KLa·([CO2]∗− [CO2,i])· �t+vCO2,app·Xi·�t,
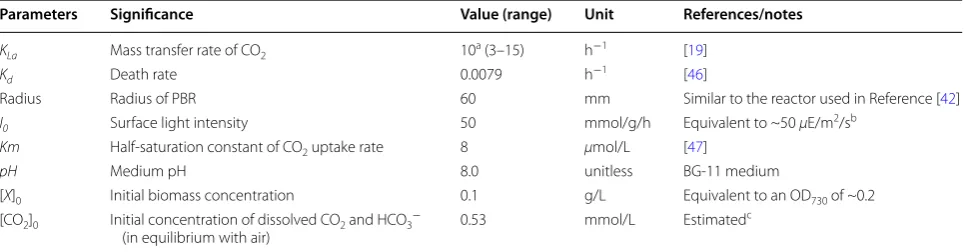
Table 1 List of parameters used to simulate the growth and metabolic fluxes of cyanobacteria growing in a cylindrical PBR
a The value is used in Figs. 2, 3 and 5; ba photosynthesis efficiency of 1.5 % is assumed in Figs. 2, 3 and 5; and ccalculation is based on experimental conditions
(Additional file 2)
Parameters Significance Value (range) Unit References/notes
KLa Mass transfer rate of CO2 10a (3–15) h−1 [19]
Kd Death rate 0.0079 h−1 [46]
Radius Radius of PBR 60 mm Similar to the reactor used in Reference [42]
I0 Surface light intensity 50 mmol/g/h Equivalent to ~50 µE/m2/sb
Km Half-saturation constant of CO2 uptake rate 8 µmol/L [47]
pH Medium pH 8.0 unitless BG-11 medium
[X]0 Initial biomass concentration 0.1 g/L Equivalent to an OD730 of ~0.2
[CO2]0 Initial concentration of dissolved CO2 and HCO3−
(in equilibrium with air) 0.53 mmol/L Estimated
where N is the rotation speed, in rpm; V is the shake flask volume, in mL; and L is the culture volume, in mL. MAT-LAB code of the integrated GSM is provided in Addi-tional file 3 and 4.
Author’s contributions
YJT and LH initialized this project. LH and SW built the integrated GSM. LH, NW, and AR performed the experiments. All authors read and approved the final manuscript.
Author details
1 Department of Energy, Environmental and Chemical Engineering, Washing-ton University, St. Louis, MO 63130, USA. 2 Department of Mechanical Engi-neering and Materials Science, Washington University, St. Louis, MO 63130, USA. 3 Department of Biochemistry and Molecular Biology, College of Wooster, Wooster, OH 44691, USA.
Acknowledgements
We would like to thank Dr. Le You for valuable discussions for this project. We are also grateful for the funding supports from a US DOE grant (DESC0012722) and an NSF Grant (CBET 1438125).
Competing interests
The authors declare that they have no competing interests.
Received: 7 October 2015 Accepted: 12 December 2015
References
1. Janssen M, Tramper J, Mur LR, Wijffels RH. Enclosed outdoor photobio-reactors: light regime, photosynthetic efficiency, scale-up, and future prospects. Biotechnol Bioeng. 2003;81:193–210.
2. Wu X, Merchuk JC. A model integrating fluid dynamics in photosynthesis and photoinhibition processes. Chem Eng Sci. 2001;56:3527–38. 3. Béchet Q, Shilton A, Guieysse B. Modeling the effects of light and
temperature on algae growth: state of the art and critical assessment for productivity prediction during outdoor cultivation. Biotechnol Adv. 2013;31:1648–63.
4. Cornet JF, Dussap CG. A simple and reliable formula for assessment of maximum volumetric productivities in photobioreactors. Biotechnol Prog. 2009;25:424–35.
5. Takache H, Christophe G, Cornet JF, Pruvost J. Experimental and theoreti-cal assessment of maximum productivities for the microalgae
Chla-mydomonas reinhardtii in two different geometries of photobioreactors.
Biotechnol Prog. 2010;26:431–40.
6. Cornet J, Dussap C, Dubertret G. A structured model for simulation of cultures of the cyanobacterium Spirulina platensis in photobioreactors: I. Coupling between light transfer and growth kinetics. Biotechnol Bioeng. 1992;40:817–25.
(9)
KLa=0.032×N
V L
0.845
,
Additional files
Additional file 1. Flux distribution database.
Additional file 2. Supplementary figures and tables.
Additional file 3. MATLAB file for simulating cyanobacterial performance in PBRs.
Additional file 4. Matrix of flux distribution database.
7. Orth JD, Thiele I, Palsson BO. What is flux balance analysis? Nat Biotechnol. 2010;28:245–8.
8. Lerman JA, Chang RL, Hyduke DR, Palsson BØ. Genome-scale models of metabolism and gene expression extend and refine growth phenotype prediction. Mol Syst Biol. 2013;9:693–705.
9. Becker SA, Feist AM, Mo ML, Hannum G, Palsson BØ, Herrgard MJ. Quan-titative prediction of cellular metabolism with constraint-based models: the COBRA Toolbox. Nat Protoc. 2007;2:727–38.
10. Ranganathan S, Suthers PF, Maranas CD. OptForce: an optimization procedure for identifying all genetic manipulations leading to targeted overproductions. PLoS Comput Biol. 2010;6:e1000744.
11. Teusink B, Wiersma A, Jacobs L, Notebaart RA, Smid EJ. Understanding the adaptive growth strategy of Lactobacillus plantarum by in silico optimisa-tion. PLoS Comput Biol 2009; 5:e1000410.
12. Schirmer A, Rude MA, Li X, Popova E, Del Cardayre SB. Microbial biosyn-thesis of alkanes. Science. 2010;329:559–62.
13. Bandyopadhyay A, Stöckel J, Min H, Sherman LA, Pakrasi HB. High rates of photobiological H2 production by a cyanobacterium under aerobic conditions. Nat Commun. 2010;1:139.
14. Berla BM, Saha R, Immethun CM, Maranas CD, Moon TS, Pakrasi HB. Synthetic biology of cyanobacteria: unique challenges and opportunities. Front Microbiol. 2013;4:246.
15. Nogales J, Gudmundsson S, Knight EM, Palsson BO, Thiele I. Detailing the optimality of photosynthesis in cyanobacteria through systems biology analysis. Proc Natl Acad Sci USA. 2012;109:2678–83.
16. Blankenship RE, Tiede DM, Barber J, Brudvig GW, Fleming G, Ghirardi M, Gunner M, Junge W, Kramer DM, Melis A. Comparing photosynthetic and photovoltaic efficiencies and recognizing the potential for improvement. Science. 2011;332:805–9.
17. Zhu X-G, Long SP, Ort DR. What is the maximum efficiency with which photosynthesis can convert solar energy into biomass? Curr Opin Bio-technol. 2008;19:153–9.
18. Melis A. Solar energy conversion efficiencies in photosynthesis: minimiz-ing the chlorophyll antennae to maximize efficiency. Plant Sci (Amster-dam, Neth). 2009;177:272–80.
19. Kazim SA. Experimental and empirical correlations for the determination of the overall volumetric mass transfer coefficients of carbon dioxide in stirred tank bioreactors. The University of Western Ontario. 2012. p. 48. 20. Aikawa S, Izumi Y, Matsuda F, Hasunuma T, Chang J-S, Kondo A. Syner-gistic enhancement of glycogen production in Arthrospira platensis by optimization of light intensity and nitrate supply. Bioresour Technol. 2012;108:211–5.
21. Hasunuma T, Kikuyama F, Matsuda M, Aikawa S, Izumi Y, Kondo A. Dynamic metabolic profiling of cyanobacterial glycogen biosynthesis under conditions of nitrate depletion. J Exp Bot 2013;64(10):2943–54. 22. Pirt SJ, Lee YK, Walach MR, Pirt MW, Balyuzi HH, Bazin MJ. A tubular
bio-reactor for photosynthetic production of biomass from carbon dioxide: design and performance. J Chem Technol Biotechnol. 1983;33:35–58. 23. Lee C-G, Palsson BØ. High-density algal photobioreactors using
light-emitting diodes. Biotechnol Bioeng. 1994;44:1161–7.
24. Young JD, Shastri AA, Stephanopoulos G, Morgan JA. Mapping photo-autotrophic metabolism with isotopically nonstationary 13C flux analysis. Metab Eng. 2011;13:656–65.
25. Xiong W, Morgan JA, Ungerer J, Wang B, Maness P-C, Yu J. The plasticity of cyanobacterial metabolism supports direct CO2 conversion to ethylene. Nat Plants 2015; 1.
26. You L, Berla B, He L, Pakrasi HB, Tang YJ. 13C-MFA delineates the photo-mixotrophic metabolism of Synechocystis sp. PCC 6803 under light- and carbon-sufficient conditions. Biotechnol J. 2014;9:684–92.
27. Yu J, Liberton M, Cliften PF, Head RD, Jacobs JM, Smith RD, Koppenaal DW, Brand JJ, Pakrasi HB. Synechococcus elongatus UTEX 2973, a fast grow-ing cyanobacterial chassis for biosynthesis usgrow-ing light and CO2. Sci Rep 2015; 5.
28. Levitan O, Rosenberg G, Setlik I, Setlikova E, Grigel J, Klepetar J, Prasil O, Berman-Frank I. Elevated CO2 enhances nitrogen fixation and growth in the marine cyanobacterium Trichodesmium. Glob Chang Biol. 2007;13:531–8.
lactic acid by Synechocystis sp. PCC6803 in a glycogen storage mutant. J Biotechnol. 2014;184:100–2.
31. Li X, Shen C, Liao J. Isobutanol production as an alternative metabolic sink to rescue the growth deficiency of the glycogen mutant of
Synecho-coccus elongatus PCC 7942. Photosynth Res. 2014;120:301–10.
32. Gründel M, Scheunemann R, Lockau W, Zilliges Y. Impaired glycogen syn-thesis causes metabolic overflow reactions and affects stress responses in the cyanobacterium Synechocystis sp. PCC 6803. Microbiology. 2012;158:3032–43.
33. Poolman MG, Fell DA, Raines CA. Elementary modes analysis of photosyn-thate metabolism in the chloroplast stroma. Eur J Biochem. 2003;270:430–9. 34. Wu S, Huang A, Zhang B, Huan L, Zhao P, Lin A, Wang G. Enzyme activity
highlights the importance of the oxidative pentose phosphate pathway in lipid accumulation and growth of Phaeodactylum tricornutum under CO2 concentration. Biotechnol Biofuels. 2015;8:78.
35. Wasylenko TM, Ahn WS, Stephanopoulos G. The oxidative pentose phos-phate pathway is the primary source of NADPH for lipid overproduction from glucose in Yarrowia lipolytica. Metab Eng. 2015;30:27–39. 36. Xu Y, Tiago Guerra L, Li Z, Ludwig M, Charles Dismukes G, Bryant DA.
Altered carbohydrate metabolism in glycogen synthase mutants of
Synechococcus sp. strain PCC 7002: Cell factories for soluble sugars. Metab
Eng. 2013;16:56–67.
37. Kondo T, Strayer CA, Kulkarni RD, Taylor W, Ishiura M, Golden SS, Johnson CH. Circadian rhythms in prokaryotes: luciferase as a reporter of circadian gene expression in cyanobacteria. Proc Natl Acad Sci USA. 1993;90:5672–6.
38. Xiong W, Brune D, Vermaas WF. The γ-aminobutyric acid shunt contrib-utes to closing the tricarboxylic acid cycle in Synechocystis sp. PCC 6803. Mol Microbiol. 2014;93:786–96.
39. Segre D, Vitkup D, Church GM. Analysis of optimality in natural and perturbed metabolic networks. Proc Natl Acad Sci USA. 2002;99:15112–7. 40. Knoop H, Gründel M, Zilliges Y, Lehmann R, Hoffmann S, Lockau W, Steuer
R. Flux balance analysis of cyanobacterial metabolism: the metabolic net-work of Synechocystis sp. PCC 6803. PLoS Comput Biol. 2013;9:e1003081. 41. Wu X, Merchuk JC. Simulation of algae growth in a bench-scale bubble
column reactor. Biotechnol Bioeng. 2002;80:156–68.
42. Luo H-P, Al-Dahhan MH. Verification and validation of CFD simulations for local flow dynamics in a draft tube airlift bioreactor. Chem Eng Sci. 2011;66:907–23.
43. Katsuda T, Arimoto T, Igarashi K, Azuma M, Kato J, Takakuwa S, Ooshima H. Light intensity distribution in the externally illuminated cylindrical photo-bioreactor and its application to hydrogen production by Rhodobacter
capsulatus. Biochem Eng J. 2000;5:157–64.
44. Feng X, Xu Y, Chen Y, Tang YJ. Integrating flux balance analysis into kinetic models to decipher the dynamic metabolism of Shewanella oneidensis
MR-1. PLoS Comput Biol. 2012;8:e1002376.
45. Nikakhtari H, Hill GA. Modelling oxygen transfer and aerobic growth in shake flasks and well-mixed bioreactors. Can J Chem Eng. 2005;83:493–9. 46. Kim HW, Vannela R, Zhou C, Rittmann BE. Nutrient acquisition and limita-tion for the photoautotrophic growth of Synechocystis sp. PCC6803 as a renewable biomass source. Biotechnol Bioeng. 2011;108:277–85. 47. Badger MR, Andrews TJ. Photosynthesis and inorganic carbon usage
by the marine cyanobacterium, Synechococcus sp. Plant Physiol. 1982;70:517–23.
• We accept pre-submission inquiries
• Our selector tool helps you to find the most relevant journal
• We provide round the clock customer support
• Convenient online submission
• Thorough peer review
• Inclusion in PubMed and all major indexing services
• Maximum visibility for your research
Submit your manuscript at www.biomedcentral.com/submit