R E S E A R C H
Open Access
The mixed benefit of low lipoprotein
(a)
in
type 2 diabetes
Michel P. Hermans
1*, Sylvie A. Ahn
2and Michel F. Rousseau
2Abstract
Background:Lipoprotein(a)(Lp(a)), a variant low-density lipoprotein (LDL), is a major genetic risk factor for cardiovascular disease. It is unknown whether an inverse relationship exists between Lp(a)andβ-cell function (BCF), as for LDL-cholesterol (LDL-C) lowering by statins.
We therefore assessedthe cardiometabolic phenotype of 340 men with type 2 diabetes mellitus (T2DM) in relation to Lp(a), focusing on BCF and hyperbolic product [BxS], which adjusts BCF to insulin sensitivity and secretion.
Methods:Two groups were analyzed according to Lp(a)quartiles (Q): a (very-)low Lp(a) (Q1;n= 85) vs a normal-to-high Lp(a) group (Q2-Q4;n= 255).
Results: In the overall cohort, mean Lp(a) was 52 nmol.L−1. Median Lp(a) was 6 nmol.L−1 (Q1) vs 38 nmol.L−1 (Q2-Q4). There were no differences between groups regarding age; education; diabetes duration; body mass index; body composition and smoking. Q1 had significantly worse glycemic control, higher systolic blood pressure, more severe metabolic syndrome, and more frequent hepatic steatosis. Insulin sensitivity was significantly lower (−37%) in Q1, who also had lesser hyperbolic product (−27%), and higher [BxS] loss rate (+ 15%). Q1 also had higher frequency (+31%) and severity (+20%) of atherogenic dyslipidemia. Microangiopathy and neuropathy were higher in Q1 (+ 34% and + 48%, respectively), whereas Q2-Q4 patients had increased macroangiopathy (+ 51%) and coronary artery disease (CAD; + 94%).
Conclusions:Low Lp(a) appears both beneficial and unhealthy in T2DM. It is associated with unfavourable cardiometabolic phenotype, lesser BCF, poorer glycemic control, and increased microvascular damage despite being linked to markedly reduced CAD, suggesting that Lp(a)-related vascular risk) follows a J-shaped curve.
Keywords:Lipoprotein(a), Diabetes, Insulin secretion, Microvascular, Atherogenic dyslipidemia, CAD
Background
In recent years, a controversy in the general media has overstated the potential risks of statins, while minimi-zing the cardiovascular (CV) benefits of the class to re-duce atherosclerosis. An unexpected positive aspect of this debate was a better understanding of the hypergly-cemic effect of statins [1–3]. This impact, of little clin-ical significance, was often observed in large clinclin-ical trials, as new-onset diabetes and/or as modest depres-sion of glycemic control in known diabetics. This hyperglycemic effect was variously ascribed to inhi-bition of islet 3-hydroxy-3-methylglutaryl-coenzyme A
reductase, lesser peripheral insulin sensitivity (IS), and/ or decreased uptake of low-density lipoprotein choles-terol (LDL-C) by the β-cell secondary to reduction in circulating LDLs. Conversely, patients with familial hypercholesterolemia, whose baseline LDLs were ex-ceedingly high for decades, are at lesser risk of develo-ping type 2 diabetes mellitus (T2DM) [4].
Lipoprotein(a)(Lp(a)) is a variant LDL covalently at-tached to its specific apolipoprotein Apo(a), encoded by the LPA gene. The latter determines the number of pretzel-like domain-IV duplicates, inversely correlated with Lp(a)number, which, as a result, is genetically de-termined for each individual. Although Lp(a)is in itself a distinct subclass within LDLs, its physiological role(s) remain(s) unknown, despite the fact that elevated Lp(a)
* Correspondence:michel.hermans@diab.ucl.ac.be
1Division of Endocrinology and Nutrition, Cliniques universitaires St-Luc and Institut de Recherche Expérimentale et Clinique (IREC), Université catholique de Louvain, Avenue Hippocrate UCL 54.74, B-1200 Brussels, Belgium Full list of author information is available at the end of the article
markedly increases atherothrombosis risk and incident CVD [5–11].
While it is established that statins and/or low LDL-C levels impair insulin secretion in non-diabetic, pre-diabetic and T2DM subjects, it is unclear whether the same relationship exists with respect to Lp(a). As early as 1976, Dahlën & Berg found that Lp(a) modulates glucose and insulin levels, observations also reported later [5, 7]. Lp(a) was inversely associated with new-onset diabetes in the general population, as shown in the Women Health and the Copenhagen City Heart studies, independent of body mass index (BMI); gly-cated hemoglobin (HbA1c), or triglycerides (TG) [8],
the inverse association being ascribed to lesser insulin resistance [6, 9].
More fundamentally, there has been no specific inves-tigation of the relationship between Lp(a) and β-cell function (BCF), in particular it is unknown whether, as in the case of common LDLs, low numbers of Lp(a) particles are linked toβ-cell function loss in T2DM. In this context, we analyzed the cardiometabolic phe-notype of T2DM men in relation to Lp(a), focusing in particular on BCF, hyperbolic product (which adjusts BCF to insulin sensitivity (IS)), and secular loss of insu-lin secretion.
Methods
Study design
The study was retrospective and included 340 adult Caucasian males with T2DM, followed by the same physician and coauthor of this study (MPH) at the Clin-iques universitaires St-Luc (Brussels) between January 2010 and December 2016. Exclusion criteria included patients chronically treated with medications that could substantially change IS or BCF, including systemic or topical corticosteroids, antiretroviral drugs, immune-modulatory drugs, and anti-psychotics. Were also ex-cluded patients with chronic inflammatory diseases, cancer or major organ failure (respiratory, heart, and liver). Two groups were analyzed in parallel according to quartiles (Q) of Lp(a): a Q1 group (n= 85) vs a group combining Q2; Q3 and Q4 patients (n= 255).
Patients characteristics
The following socio-demographic and clinical variables were recorded: age; highest educational attainment (as proxy for socio-economic status) based on four catego-ries: (i) secondary school with leaving certificate (no graduation); (ii) school leaving certificate (with gradu-ation); (iii) further education, but no degree; and (iv) university degree or similar, with highest educational at-tainment dichotomized as lower [(i) + (ii)] vs higher [(iii) + (iv)]; diabetes duration; presence of 1st-degree familial history (mother and/or father and/or siblings)
for DM, and/or for familial history of EOCHD (early-on-set coronary heart disease), defined as occurrence of a 1st CVD event < 55 years (men) and < 65 years (women), with the exclusion of familial hypercholesterolemia; smoking history; and habitual ethanol intake. Hyperten-sion prevalence was defined as systolic blood pressure (BP) ≥140 mmHg and/or diastolic BP ≥90 mmHg and/ or current treatment with BP-lowering drug(s) pre-scribed for treating high BP.
Weight, height, and body mass index (BMI) were de-termined, together with body fat and skeletal muscle mass (BodyFat Analyzer, Omron BF 500; Omron Healthcare Europe B.V., Hoofddorp, The Netherlands). Waist circumference and conicity index were deter-mined as surrogates for central/upper body adiposity (co-nicity index: waist circumference (m)/0.109√[weight(kg)/ height (m)]). The presence of a metabolic syndrome (MetS) was defined by a score ≥3/5 for the following items: (i) impaired fasting glucose or diabetes; (ii) hyper-tension; (iii) enlarged waist; (iv) hypertriglyceridemia; and (v) decreased high-density lipoprotein (HDL) cholesterol, according to the IDF-NHLBI-AHA-WHF-IAS-IASO harmonized definition [12]. Non-alcoholic fatty liver (NAFL) was based on the finding on abdominal ultra-sonography by a trained radiologist of hepatorenal echo contrast and liver brightness, in the absence of etio-logical factors associated with liver steatosis, including excess ethanol intake].
Each subject underwent non-invasive combined as-sessment of BCF and -IS using the Homeostasis Model Assessment (HOMA-2, computer-based, version: http:// www.dtu.ox.ac.uk), from triplicates means of fasting glu-cose and specific insulin levels obtained after an overnight fast and discontinuation of all glucose-lowering or glucose-sensitizing therapies for 24 h (48 h in case of in-sulin glargine and long-acting sulfonylureas and 2–28 days in case of GLP-1-RA with short/long duration of action). For patients treated with pioglitazone, HOMA was per-formed prior to introduction of this long-acting insulin-sensitizer [13, 14].
with a [BxS] value of 100% conferring normal carbohy-drate homeostasis, and (ii) that the loss of [BCF] is, for the most part, linear over the years [15, 16].
Ongoing therapies and comorbidities
Current medications were recorded: glucose-lowering drugs (metformin; sulfonylureas/glinides; pioglitazone; dipeptidyl peptidase-4 inhibitors (DPP-4-I); glucagon-like peptide-1 receptor agonists (GLP-1-RA); insulin); and CV drugs [BP-lowering agents; aspirin (as anti-platelet agent); lipid-modifying drugs (LMD): statins; fibrates and/or ezetimibe]. Estimated glomerular filtra-tion rate (eGFR) was calculated using the Modification of Diet in Renal Diseaseequation [17]. Normo, microal-buminuria and macroalmicroal-buminuria were defined as urin-ary albumin excretion < 30 (normo-), 30–299 (micro-) and ≥300 μg.mg creatinine−1.1.73 m2 (macro-), from first-morning urine sample. Diabetic retinopathy and nephropathy were defined using ICD-9-CM diagnoses and procedure codes. The presence of a peripheral neuropathy was based on clinical examination (knee and ankle reflexes; Semmes-Weinstein monofilament test) and/or electromyography. Eye visual examinations by an experienced ophthalmologist and/or fluorescein angiography were performed to diagnose retinopathy.
Coronary artery disease (CAD) diagnosis was based on medical history (myocardial infarction, angioplasty, stenting, revascularization surgery and/or significant coronary stenosis confirmed by angiography), systematic review of all procedures, and/or screening (exercise test-ing; echocardiography; magnetic resonance imagtest-ing; or other subclinical disease imaging techniques). Cerebro-vascular disease was defined as a history of stroke (UK Prospective Diabetes Studycriteria: any neurological def-icit ≥1 month, without distinction between ischemic, embolic and haemorrhagic events) and/or transient is-chaemic attack [18]. Peripheral artery disease (PAD) was defined by a medical history of lower-limb(s) claudica-tion and/or clinical or imaging evidence for ischemic diabetic foot, angioplasty, stenting, revascularization sur-gery and/or lower-limb artery stenosis at Doppler ultra-sonography and/or angiography.
Laboratory values
HbA1c; fasting lipids (total cholesterol (C), HDL-C,
tri-glycerides; LDL-C (computed using Friedewald’s for-mula), Lp(a), and non-HDL-C (by subtracting HDL-C from total C)); apolipoproteins A-I (apoA-I) and B100
(apoB100); hsCRP; thyroid-stimulating hormone (TSH);
serum total and free testosterone; sex hormone-binding globulin (SHBG); and albuminuria were determined by routine methods. Total cholesterol and TG were
deter-mined using SYNCHRON® system (Beckman Coulter
Inc., Brea, CA). HDL-C was determined with
ULTRA-N-geneous® reagent (Genzyme Corporation, Cambridge, MA). ApoA-I and apoB100were determined with
immu-nonephelometry on BNII Analyzer® (Siemens Healthcare Products GmbH, Marburg (Germany). Lp(a) concentra-tion was determined by turbidimetric analysis of fresh plasma samples (Tina-quant® Lipoprotein(a) Gen. 2 on Cobas c 502 module analyzer (Roche Diagnostics SA, Rotkreuz (Switzerland); measurement range: 7–240 nmol/ L, regardless of isoforms; threshold value for Lp(a)-related CV risk increase > 75 nmol/L). Mean (SD) local reference values for Lp(a)obtained from a group of 50 healthy Cau-casian male volunteers were 40 (37) nmol.L−1(median 26 [IQR 10–72] nmol.L−1; range 7–124 nmol.L−1).
Atherogenic dyslipidemia (AD) was defined as the combination of low HDL-C (< 40 mg.dL−1) and high fasting TG (≥150 mg.dL−1) based on the MetS defini-tion’s cutoffs for non-LDL lipids. AD prevalence, was established from the combined occurrence of low HDL-C plus high TG, from last available fasting TG and HDL-C measurements prior to LMD implementation [LMD(s)-treated patients], or from current fasting TG and HDL-C [LMD-naïve patients], respectively. AD se-verity was quantified as continuous variable using log(TG)/HDL-C ratio [19, 20].
Results are presented as means (± 1 standard devi-ation (SD)) or as median [interquartile range (IQR)]. The significance of differences between means was assessed by Student’s t test or by alternate Welch’s test for data sets with significant differences in SDs, and by Fisher’s Exact test for differences in proportions. Re-sults were considered significant or non-significant (NS) for p < or≥0.05 respectively.
Results
Patients characteristics
There were no differences between Q1 and Q2–4 pa-tients regarding age; education (lower vs higher: 45% vs 55% (Q1) and 44% vs 56% (Q2–4)); diabetes duration; family history (DM and/or EOCHD); and smoking (Table 1). Habitual ethanol intake and self-reported leisure-time physical activity were also similar between groups (not shown). Glycemic control was on average above target, with mean HbA1c in the overall
MetS was high and similar in both groups; however, Q1 patients had higher MetS severity score (8% re-lative increase). They also had a markedly increased frequency of non-alcoholic hepatic steatosis (33% re-lative increase).
Cardiometabolic phenotype
For all patients, mean insulin sensitivity was lowered (56% of normal), indicative of substantial insulin re-sistance (Table 2). Fasting insulinaemia was higher (by 36%) in Q1 patients, whose insulin sensitivity was Table 1Patients characteristics
1st Quartile Lp(a) Quartiles 2–4 Lp(a) P
n 85 255 ~
age years 68 (10) 67 (12) NS
diabetes duration years 18 (9) 16 (9) NS
HbA1c mmol.mol−1 61 (13) 58 (10) 0.0276
diabetes family history % 48 50 NS
EOCHD family history % 12 10 NS
smokinga 35 - 46 - 19 33 - 49 - 18 NS
hypertension % 98 89 0.0140
systolic blood pressure mm Hg 144 (21) 139 (19) 0.0416
body mass index kg.m−2 29.0 (5.0) 28.8 (5.3) NS
waist circumference cm 105 (13) 105 (14) NS
fat mass % 26.7 (6.0) 25.9 (6.1) NS
visceral fat 0–30 score 14 (4) 14 (5) NS
skeletal muscle mass % 32.9 (2.8) 33.2 (3.1) NS
conicity index m2.kg−1 1.36 (0.07) 1.36 (0.08) NS
metabolic syndrome % 86 80 NS
0/5 to 5/5 3.9 (1.1) 3.6 (1.1) 0.0301
hepatic steatosis % 92 69 <0.0001
Results are expressed as means (1 SD) or proportions (%).a
never-former-current;EOCHDearly-onset coronary heart disease,HbA1cglycated haemoglobin, Lp(α)lipoprotein(α),NSnot significant
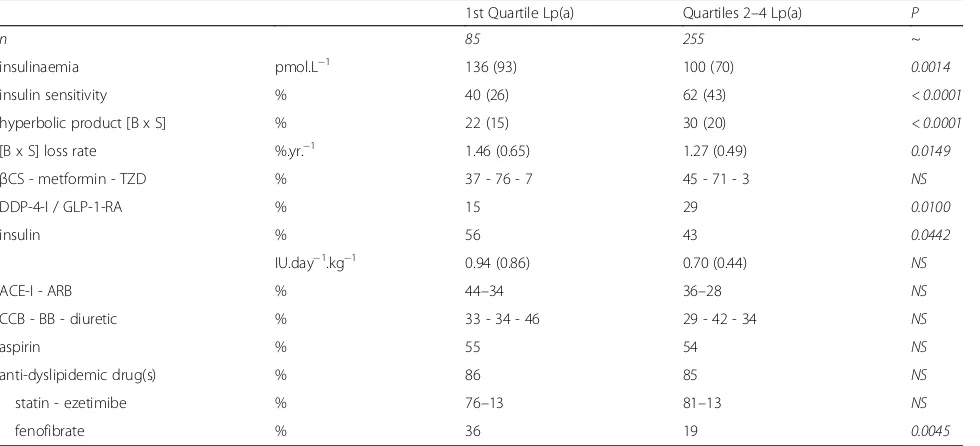
Table 2Cardiometabolic phenotype & therapies
1st Quartile Lp(a) Quartiles 2–4 Lp(a) P
n 85 255 ~
insulinaemia pmol.L−1 136 (93) 100 (70) 0.0014
insulin sensitivity % 40 (26) 62 (43) < 0.0001
hyperbolic product [B x S] % 22 (15) 30 (20) < 0.0001
[B x S] loss rate %.yr.−1 1.46 (0.65) 1.27 (0.49) 0.0149
βCS - metformin - TZD % 37 - 76 - 7 45 - 71 - 3 NS
DDP-4-I / GLP-1-RA % 15 29 0.0100
insulin % 56 43 0.0442
IU.day−1.kg−1 0.94 (0.86) 0.70 (0.44) NS
ACE-I - ARB % 44–34 36–28 NS
CCB - BB - diuretic % 33 - 34 - 46 29 - 42 - 34 NS
aspirin % 55 54 NS
anti-dyslipidemic drug(s) % 86 85 NS
statin - ezetimibe % 76–13 81–13 NS
fenofibrate % 36 19 0.0045
Results are expressed as means (1 SD) or proportions (%).ACE-Iangiotensin-converting enzyme inhibitorARBangiotensin II type−1 receptor (AT1) blocker,
significantly lower (by a relative 37%) compared to Q2–4 patients (p < 0.0001). In the general cohort, the hyperbolic product ([BxS]; a measure of residual β -cell function) was markedly reduced (28.1%), the mean annual loss of [BxS] being 1.32%.
This hyperbolic product was further reduced in Q1 pa-tients, whose residual β-cell function was decreased by 8% (absolute) and by 27% (relative) compared to Q2–4 patients. [BxS] loss rate was significantly more severe in Q1 patients (1.46%.year−1), ie a 15% faster loss rate (rela-tive value).
With respect to glucose-lowering therapies, Q1 pa-tients were significantly less often treated with incretin-based therapies, and more often (+ 30%) treated with insulin. There were no differences between groups re-garding metformin, β-cell stimulant and/or glitazone use. CV medications were used in similar proportions in the 2 groups, except for a markedly increased use of fenofibrate (+ 89%) by Q1 patients (Table 2).
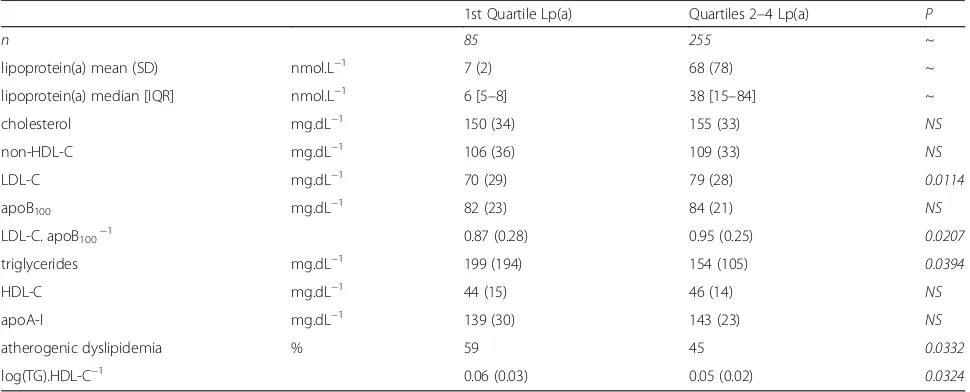
Lipids and lipoproteins
Table 3 shows the lipids and lipoproteins values of the Q1 and Q2–4 groups. For the overall cohort, mean Lp(a) was 52 (73) nmol.L−1 (median 24 nmol.L−1; IQR 24–69 nmol.L−1; range 2–545 nmol.L−1). Median Lp(a) values were 6 (Q1); 11 (Q2); 38 (Q3); and 120 nmol.L−1 (Q4). More than 3/4 of the overall cohort had normal Lp(a), ie < 75 nmol.L−1; a cutoff corresponding to the 78th percentile of the overall cohort. Median Lp(a) in Q2–4 patients was 38 nmol.L−1, which means that Q1 patients had median Lp(a)more than 6-fold lower than the median value for the 3 upper Qs.
LDL-C level was significantly higher in Q2–4 (+ 13%), whereas total C; non-HDL-C; HDL-C; apoB100 and
apoA-I levels were similar in the 2 groups. LDL size, es-timated by the LDL-C/apoB100ratio, was significantly
re-duced (−8%) in Q1 patients, in whose both the
frequency (+ 31%) and severity (+20% of log (TG)/HDL-C) of AD were significantly increased (Table 3). Regard-ing non-lipid laboratory values, there were no differ-ences between groups with respect to hsCRP; SHBG;
total and free testosterone; and TSH (not shown). In a multiple regression analysis taking into account poten-tially confounders of Lp(a) and glycemic/metabolic con-trol (age; duration of diabetes, glomerular filtration rate; BMI; sedentarity; waist; insulin resistance; atherogenic dyslipidemia; HbA1c), no relationship was found but for
a very modest effect of age (r2= 0.0121;p0.039).
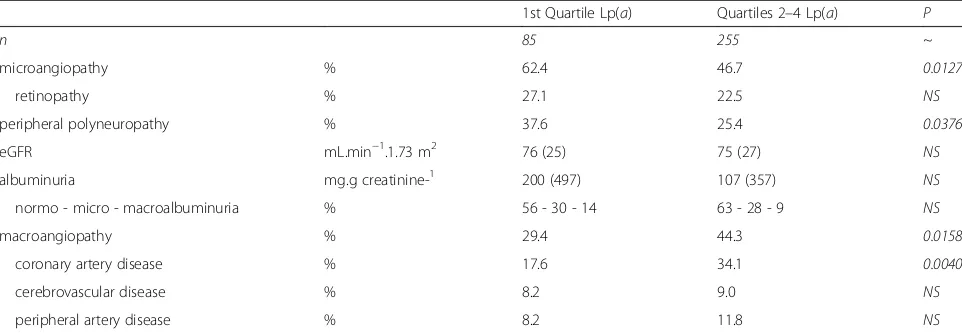
Comorbidities
Damage to target organs is described in Table 4. Overall microangiopathy was markedly and significantly more prevalent in Q1 patients (+ 34%), with microangiopathy frequencies within Q2 to Q4: 39% (Q2); 49% (Q3), and 52% (Q4; NS for trend). Retinopathy frequency was in-creased by 20% in Q1 relative to Q2–4, although the dif-ference did not reach significance. Of all the quartiles, Q2 patients had the lowest prevalence in microangiopa-thies, and were on par with Q1 with respect to lower rates of overall macroangiopathy. Q1 patients had a sig-nificantly increased prevalence of neuropathy (+ 48%) vs the frequencies within Q2 to Q4: 18% (Q2); 28% (Q3); and 31% (Q4; p NS for trend). There was no difference between groups with regard to eGFR and (micro)albumi-nuria prevalence or severity. On the other hand, for large vessels, Q2–4 patients showed a markedly in-creased prevalence in overall macroangiopathy (+ 51% relative; + 15% absolute), more specifically CAD, which
Table 3Lipids & lipoproteins
1st Quartile Lp(a) Quartiles 2–4 Lp(a) P
n 85 255 ~
lipoprotein(a) mean (SD) nmol.L−1 7 (2) 68 (78) ~
lipoprotein(a) median [IQR] nmol.L−1 6 [5–8] 38 [15–84] ~
cholesterol mg.dL−1 150 (34) 155 (33) NS
non-HDL-C mg.dL−1 106 (36) 109 (33) NS
LDL-C mg.dL−1 70 (29) 79 (28) 0.0114
apoB100 mg.dL−1 82 (23) 84 (21) NS
LDL-C. apoB100−1 0.87 (0.28) 0.95 (0.25) 0.0207
triglycerides mg.dL−1 199 (194) 154 (105) 0.0394
HDL-C mg.dL−1 44 (15) 46 (14) NS
apoA-I mg.dL−1 139 (30) 143 (23) NS
atherogenic dyslipidemia % 59 45 0.0332
log(TG).HDL-C−1 0.06 (0.03) 0.05 (0.02) 0.0324
was increased by + 94% (relative) and + 17% (absolute). Overall macroangiopahy frequencies within Q2 to Q4 were: 29% (Q2); 52% (Q3), and 52% (Q4; p for trend 0.0034), with CAD prevalence of 20% (Q2); 40% (Q3); and 42% (Q4; p for trend 0.0021).
Discussion
The work aimed to determine whether T2DM patients with low Lp(a)have a variant phenotype, beyond the ex-pectation of lesser risk of macrovascular damage. To do this, we compared patients with low to very-low Lp(a) (Q1) to a group of patients with normal (Q2 and Q3) or elevated (Q4) Lp(a).Our results show that low Lp(a)is associated with a specific cardiometabolic phenotype, combining higher systolic BP and hypertension; poorer glycemic control; greater microangiopathy and neur-opathy frequency; and lesser macrovascular disease. They also had a more severe MetS score, and more fre-quent liver steatosis, the latter associated with hyperin-sulinemia; AD prevalence, and smaller-denser LDLs.
Concerning carbohydrate homeostasis, Q1 patients were characterized by greater insulin resistance, poorer insulin secretion, and more pronounced BCF loss. Thenceforth, it is hardly surprising that more of them could not stay on oral glucose-lowering drugs only and were switched to insulin. These differences in glucose homeostasis are likely determinants of poorer glycemic control in (very) low Lp(a)patients, as diabetes duration was similar between groups.
As regards the increased prevalence of microangiopa-thy in (very) low Lp(a) patients, it is unlikely that it stemmed directly from the low level of the lipoprotein, based on the current paradigm of diabetic microvascular disease [21]. On the other hand, at least four aspects of the unfavorable cardiometabolic phenotype associated with low Lp(a) may have contributed to the genesis (or aggravation) of small vessel damage, namely (i) poorer
glycemic control; (ii) higher BP; (iii) greater MetS score; and (iv) more prevalent and severe AD [19, 20, 22–25].
As expected, overall macroangiopathy, including CAD, was significantly more frequent in patients with higher Lp(a), consistent with previous transversal or longitu-dinal studies in diabetic [10, 11] and non-diabetic pa-tients [26–28]. Macroangiopathy prevalence increased already in the 3rd quartile, suggesting enhanced vulner-ability of large vessels at modestly high Lp(a) levels in diabetes. All this implies relativizing the current “ nor-mality” threshold for Lp(a) in diabetics. Regarding microvascular risk, it is rather linked to having a low (ra-ther than a high) Lp(a), with“normality”thereby consid-ered beyond Q1. In contrast, the risk to large vessels appears linear over quartiles, with a marked increase in complications from Q3 onwards. As the median Lp(a) value of Q3 patients was well below the pathological threshold for non-diabetics (≥75 nmol.L−1), it seems ob-vious that the macrovascular cutoff should be revised downwards in T2DM. If one takes the vascular system as a whole (all vessel sizes combined), it becomes clear that the risk linked to Lp(a)in diabetes follows a J curve that is conditional on the size of the vessels involved, with a rise in small vessels risk at (very) low levels, and, as expected, higher macrovascular risk (especially CAD) at increasing Lp(a)levels.
The study population was exclusively male and Caucasian, which restricts the applicability of our findings in terms of gender and ethnicity. Another limitation of this study is related to the transverse design, which does not formally establish the direction of causality of the reported associations. The lack of association between Lp(a) levels and a series of cardiometabolic variables in multiple regression analysis is consistent with literature data showing that few non-genetic/acquired determinants are able to influence Lp(a) level in a given individual, with the exception of severe renal impairment or certain drugs, Table 4Cardiovascular complications
1st Quartile Lp(a) Quartiles 2–4 Lp(a) P
n 85 255 ~
microangiopathy % 62.4 46.7 0.0127
retinopathy % 27.1 22.5 NS
peripheral polyneuropathy % 37.6 25.4 0.0376
eGFR mL.min−1.1.73 m2 76 (25) 75 (27) NS
albuminuria mg.g creatinine-1 200 (497) 107 (357) NS
normo - micro - macroalbuminuria % 56 - 30 - 14 63 - 28 - 9 NS
macroangiopathy % 29.4 44.3 0.0158
coronary artery disease % 17.6 34.1 0.0040
cerebrovascular disease % 8.2 9.0 NS
peripheral artery disease % 8.2 11.8 NS
such as niacin or proprotein convertase subtilisin/kexin type 9 inhibitors. Thus, the stability of Lp(a) level over time is such that the observed associations are likely to be linked to Lp(a), and not that Lp(a)levels would have been modulated by an unfavorable phenotype or the presence of vascular complications.
Conclusions
Having a low level of Lp(a) appears both beneficial and unhealthy in T2DM. At the microvascular level, a low rate is associated with lesser ß-cell function, poorer gly-cemic control, and increased microvascular damage and neuropathy. On the other hand, the same low level of Lp(a) is associated, as in the general population, with a reduced prevalence of macrovascular disease, despite a less favorable cardiometabolic phenotype. This suggests that the overall vascular risk associated with Lp(a) fol-lows a J-shaped curve in the particular T2DM popula-tion when the vascular system is being studied as a global target organ, all sizes of vessels combined.
Abbreviations
AD:Atherogenic dyslipidemia; ApoA-I: Apolipoprotein A-I;
apoB: apolipoprotein B100; [B]: HOMA-measured BCF; BCF:β-cell function;
BMI: Body mass index; BP: Blood pressure; [BxS]: Hyperbolic product between β-cell function and IS; C: Cholesterol; CAD: Coronary artery disease; CHD: Coronary heart disease; CRP: C-reactive protein; CV: Cardiovascular; CVD: Cardiovascular disease; DM: Diabetes mellitus; DPP4-I: Dipeptidyl peptidase-4 inhibitor; eGFR: Estimated glomerular filtration rate;
EOCHD: Early-onset CHD; GLP-1-RA: Glucagon-like peptide-1 receptor agonist; HbA1c: Glycated hemoglobin; HDL: density lipoprotein; HDL-C:
High-density lipoprotein cholesterol; HOMA: Homeostasis model assessment; IS: Insulin sensitivity; LDL: Low-density lipoprotein; LDL-C: Low-density lipoprotein cholesterol; LMD: Lipid-modifying drug; Lp(a): Lipoprotein(a); MetS: Metabolic syndrome; NAFL: Non-alcoholic fatty liver; HDL-C: non-high-density lipoprotein cholesterol; NS: Non-significant; PAD: Peripheral artery disease; Q: Quartile; [S]: HOMA-measured insulin sensitivity;
SD: Standard deviation; SHBG: Sex hormone-binding globulin; T2DM: Type 2 diabetes mellitus; TG: Triglycerides (triacylglycerols); TSH: Thyroid- stimulating hormone
Acknowledgments Not applicable.
Funding
This study received no financial support.
Availability of data and materials
Data are available at the Division of Endocrinology & Nutrition, Cliniques universitaires St-Luc and Institut de Recherche Expérimentale et Clinique (IREC), Université catholique de Louvain, Brussels (Belgium)(person of contact: Prof MP Hermans).
Authors’contributions
All authors contributed equally to the manuscript. All authors read and approved the final version of the manuscript, and gave their consent for publication.
Author’s information Not applicable.
Ethics approval and consent to participate
The study protocol was approved by the Commision d’Ethique Biomédicale Hospitalo-facultaire de l’Université catholique de Louvain (Bruxelles) 2009/
20avr/141 reg N° B4032009/6275. All patients agreed that their clinical record data be used for retrospective study purposes.
Consent for publication Not applicable.
Competing interests
The authors declare that they have no competing interests.
Publisher’s Note
Springer Nature remains neutral with regard to jurisdictional claims in published maps and institutional affiliations.
Author details
1Division of Endocrinology and Nutrition, Cliniques universitaires St-Luc and Institut de Recherche Expérimentale et Clinique (IREC), Université catholique de Louvain, Avenue Hippocrate UCL 54.74, B-1200 Brussels, Belgium. 2
Division of Cardiology, Cliniques universitaires St-Luc and Pôle de Recherche Cardiovasculaire, Institut de Recherche Expérimentale et Clinique (IREC), Université catholique de Louvain, Brussels, Belgium.
Received: 9 May 2017 Accepted: 4 September 2017
References
1. Chan DC, Pang J, Watts GF. Pathogenesis and management of the diabetogenic effect of statins: a role for adiponectin and coenzyme Q10. Curr Atheroscler Rep. 2015;17:472.
2. Hermans MP, Ahn SA, Rousseau MF. Effect of lipid management on coronary heart disease risk in patients with diabetes. Diabetes in cardiovascular disease: a companion to Braunwald's heart disease. Editors: Darren K. McGuire & Nikolaus Marx. Philadelphia: Elsevier Saunders 2015; pp 181-202.
3. Betteridge DJ, Carmena R. The diabetogenic action of statins - mechanisms and clinical implications. Nat Rev Endocrinol. 2016;12:99–110.
4. Besseling J, Kastelein JJ, Defesche JC, Hutten BA, Hovingh GK. Association between familial hypercholesterolemia and prevalence of type 2 diabetes mellitus. JAMA. 2015;313:1029–36.
5. Dahlën G, Berg K. Confirmation of an influence of the inherited Lp(a) variation on serum insulin and glucose levels. Clin Genet. 1979;16:418–27. 6. Haffner SM, Karhapaa P, Rainwater DL, Mykkanen L, Aldrete G Jr, Laakso M.
Insulin sensitivity and Lp(a) concentrations in normoglycemic men. Diabetes Care. 1995;18:193–9.
7. Paige E, Masconi KL, Tsimikas S, Kronenberg F, Santer P, Weger S, Willeit J, Kiechl S, Willeit P. Lipoprotein(a) and incident type-2 diabetes: results from the prospective Bruneck study and a meta-analysis of published literature. Cardiovasc Diabetol. 2017;16:38.
8. Mora S, Kamstrup PR, Rifai N, Nordestgaard BG, Buring JE, Ridker PM. Lipoprotein(a)and risk of type 2 diabetes. Clin Chem. 2010;56:1252–60. 9. Boronat M, Saavedra P, Pérez-Martín N, López-Madrazo MJ, Rodríguez-Pérez C,
Nóvoa FJ. High levels of lipoprotein(a) are associated with a lower prevalence of diabetes with advancing age: results of a cross-sectional epidemiological survey in Gran Canaria Spain. Cardiovasc Diabetol. 2012;11:81.
10. Qi Q, Qi L. Lipoprotein(a) and cardiovascular disease in diabetic patients. Clin Lipidol. 2012;7:397–407.
13. Hermans MP, Levy J, Morris RJ, Turner RC. Comparison of insulin sensitivity tests across a range of glucose tolerance from normal to diabetes. Diabetologia. 1999;42:678–87.
14. Hermans MP, Levy J, Morris RJ, Turner RC. Comparison of tests of beta-cell function across a range of glucose tolerance from normal to diabetes. Diabetes. 1999;48:1779–86.
15. Hermans MP. Diabetic macro- and microvascular disease in type 2 diabetes. Diabetes Vasc Dis Res. 2007;4:S7–11.
16. Munoko T, Hermans MP. Phenotypic characterization of first generation Maghrebian migrants with type 2 diabetes: a gender-based comparison with a reference north-Caucasian Belgian cohort. Diab Met Syndr. 2008;2:115–24.
17. Levey AS, Bosch JP, Lewis JB, Greene T, Rogers N, Roth D. A more accurate method to estimate glomerular filtration rate from serum creatinine: a new prediction equation. Modification of diet in renal disease study group. Ann Intern Med. 1999;130:461–70.
18. Stevens RJ, Coleman RL, Adler AI, Stratton IM, Matthews DR, Holman RR. UKPDS 66: risk factors for myocardial infarction case fatality and stroke case fatality in type 2 diabetes. Diabetes Care. 2004;27:201–7.
19. Hermans MP, Ahn SA, Rousseau MF. Log(TG)/HDL-C is related to both residual cardiometabolic risk and ?-cell function loss in type 2 diabetes males. Cardiovasc Diabetol. 2010;9:88.
20. Hermans MP, Ahn SA, Rousseau MF. The atherogenic dyslipidemia ratio [log(TG)/HDL-C] is associated with residual vascular risk,β-cell function loss and microangiopathy in type 2 diabetes females. Lipids Health Dis. 2012;11:132.
21. Brownlee M. The pathobiology of diabetic complications: a unifying mechanism. Diabetes. 2005;54:1615–25.
22. Hermans MP, Ahn SA, Amoussou-Guenou KD, Rousseau MF. Impact of metabolic syndrome on microvascular complications in type 2 diabetes. Diab Metab Syndr. 2010;4:150–4.
23. Hermans MP, Amoussou-Guenou KD, Bouenizabila E, Sadikot SS, Ahn SA, Rousseau MF. Size, density and cholesterol load of HDL predict microangiopathy, coronary artery disease andβ-cell function in men with T2DM. Diabetes Metab Syndr. 2016 Sep 1; doi:10.1016/j.dsx.2016.08.029. [Epub ahead of print] 24. Sacks FM, Hermans MP, Fioretto P, Valensi P, Davis T, Horton E, Wanner C,
Al-Rubeaan K, Aronson R, Barzon I, Bishop L, Bonora E, Bunnag P, Chuang LM, Deerochanawong C, Goldenberg R, Harshfield B, Hernández C, Herzlinger-Botein S, Itoh H, Jia W, Jiang YD, Kadowaki T, Laranjo N, Leiter L, Miwa T, Odawara M, Ohashi K, Ohno A, Pan C, Pan J, Pedro-Botet J, Reiner Z, Rotella CM, Simo R, Tanaka M, Tedeschi-Reiner E, Twum-Barima D, Zoppini G, Carey VJ. Association between plasma triglycerides and high-density lipoprotein cholesterol and microvascular kidney disease and retinopathy in type 2 diabetes mellitus: a global case-control study in 13 countries. Circulation. 2014;129:999–1008.
25. Hermans MP, Fruchart J-C, Davignon J, Al-Rubeaan K, Amarenco P, Assmann G, Barter P, Betteridge J, Bruckert E, Chapman MJ, Cuevas A, Farnier M, Ferrannini E, Fioretto P, Genest J, Ginsberg HN, Gotto AM, Hu D, Kadowaki T, Kodama T, Krempf M, Matsuzawa Y, Nuñez-Cortes JM, Calvo Monfil C, Ogawa H, Plutzky J, Rader DJ, Reiner Z, Sadikot S, Santos RD, Shlyakhto E, Sritara P, Sy R, Tall A, Tan CE, Tokgözoglu L, Toth PP, Valensi P, Wanner C, Zambon A, Zhu J, Zimmet P. Residual microvascular risk in type 2 diabetes in 2014: is it time for a re-think? A perspective from the residual risk reduction initiative (R3i). J Diabetes Metab. 2014;5:8.
26. Berglund L, Ramakrishnan R. Lipoprotein(a): an elusive cardiovascular risk factor. Arterioscler Thromb Vasc Biol. 2004;24:2219–26.
27. Kamstrup PR, Tybjaerg-Hansen A, Steffensen R, Nordestgaard BG. Genetically elevated lipoprotein(a) and increased risk of myocardial infarction. JAMA. 2009;301:2331–9.
28. Emerging Risk Factors Collaboration, Erqou S, Kaptoge S, Perry PL, Di Angelantonio E, Thompson A, White IR, Marcovina SM, Collins R, Thompson SG, Danesh J. Lipoprotein(a) concentration and the risk of coronary heart disease, stroke, and nonvascular mortality. JAMA. 2009;302:412–23.
• We accept pre-submission inquiries
• Our selector tool helps you to find the most relevant journal
• We provide round the clock customer support
• Convenient online submission
• Thorough peer review
• Inclusion in PubMed and all major indexing services
• Maximum visibility for your research
Submit your manuscript at www.biomedcentral.com/submit