R E S E A R C H
Open Access
Randomized controlled trial of a computer-tailored
multiple health behaviour intervention in general
practice: 12-month follow-up results
Sanjoti Parekh
1*, David King
2, Frances M Boyle
3and Corneel Vandelanotte
4Abstract
Background:Effective strategies to address risk factors of non-communicable diseases are required to curtail the expanding costs of health care. This trial tested the effectiveness over one year of a minimal intervention targeting multiple health behaviours (diet, physical activity, alcohol and smoking) in a general practice setting, through the provision of personalised, computer-tailored feedback.
Methods:Patients who had attended a general practice in the previous 6 months were recruited from 21 general practitioners in Brisbane, Australia. Baseline data were collected using self-reports on adherence to ten health behaviours and summarised into a health score from 0 to 10. This randomised controlled trial used a 2×2 factorial design, with one arm randomising subjects to the intervention or control group. The other arm was either feedback at baseline (single contact) or an additional assessment with feedback at 3 months (dual contact). As such, 4 study groups created were, to which participants were randomised blindly: A. Intervention with single contact; B. Intervention with dual contact; C. Control with single contact and D. Control with dual contact. All participants were assessed again at 12 months.
Results:Of the 4676 participants randomised, 3065 completed questionnaires at 12 months. Both single and dual contact groups improved their 10 item health scores (+0.31 and +0.49 respectively) relative to control group outcomes (+0.02; p < 0.01). Improvement in adherence to guidelines for fish intake, type of milk consumed, vegetable and fruit intake, and alcohol intake were observed in single and dual contact intervention groups (p < 0.01). Both intervention groups showed greater improvement than controls for individual health behaviours, apart from red meat intake, smoking behaviour, physical activity and body weight. Interestingly, there was an improvement in reported non-smoking rates in both intervention and control groups (3% single contact; 4.5% dual contact).
Conclusions:Small but meaningful long-term changes in health behaviours can be achieved with a low-intensity intervention, which may reduce health care costs if implemented on a large scale. Further research is needed to better understand the mechanism by which maintenance of behaviour change can be achieved.
Trial Registration:The Australian New Zealand Clinical Trials Registry: ACTRN12611001213932.
Keywords:General practice, Prevention, Non-communicable disease, Computer-tailored, Randomised controlled trial
* Correspondence:[email protected] 1
School of Population Health, The University of Queensland, Herston, Queensland 4006, Australia
Full list of author information is available at the end of the article
Background
A set of common risk factors including unhealthy diet, insufficient physical activity, excessive alcohol intake and smoking is linked with multiple non-communicable dis-eases (NCDs) [1]. Ideally these multiple behavioural health risk factors could be addressed simultaneously but little research has examined the efficacy of such interventions [2]. As a result, significant challenges remain in selecting the optimal mix of strategies for prevention of NCDs, par-ticularly at the population-wide level.
General practitioners (GPs) are ideally placed to con-tribute to the prevention of NCDs, as the majority of Australians visit a GP each year [3]. However, many bar-riers to GP involvement in addressing health behaviours have been identified, with lack of time featuring promin-ently [4]. Prevention strategies that are minimally dis-ruptive to routine patient care and place no additional burden on GPs are needed. Computer-tailored health pro-motion interventions that provide patients with personal feedback meet these criteria and have shown promising results [5]. Tailored communications have been reported as better remembered, more often read, and perceived as more relevant or credible compared with non-tailored communication [6]. Tailored approaches developed using computer-based algorithms can be used repeatedly to reach large groups with little effort and are potentially cost-effective [7].
Evidence that multiple health behaviours can be summed into a single, composite score to estimate overall impact on health [8-10] might assist interventions to focus on multiple behaviours simultaneously. In a cohort of 12,203 elderly men, Spencer et al. showed that a simple score summarising eight health behaviours had a significant pre-dictive ability for mortality from all causes over five years [11,12]. Research that focuses on both clustering of health behaviours and adherence is scarce though clustering of healthy behaviours may be associated with greater uptake of clinical preventive practices [13]. For many individual health behaviours, including dietary patterns [14,15], phys-ical activity [16], salt intake [17] and weight loss [18-20] long term adherence is found to be poor without support and reinforcement.
Combining various strategies such as addressing mul-tiple lifestyle factors concurrently, delivery through gen-eral practice, applying a combined score to summarise health behaviours and providing computer-tailored advice offers a pragmatic approach to promoting long-term life-style behaviour change that has the ability to be applied on a population-wide scale. In our previous research we developed a validated data collection tool that assesses and summarises multiple health behaviours using a single “Prudence Score” [21]. A computer-tailored intervention (10 Small Steps) was developed to provide feedback derived from this summary score [22] and its effectiveness
at 3 months has been reported [23]. The aim of the current study is to report on the longer-term outcomes of the intervention; specifically, (a) to assess the effectiveness of the 10 Small Steps intervention after 12 months, and (b) to determine whether additional reinforcement at 3 months improves outcomes at 12 months.
Methods
Overview of design
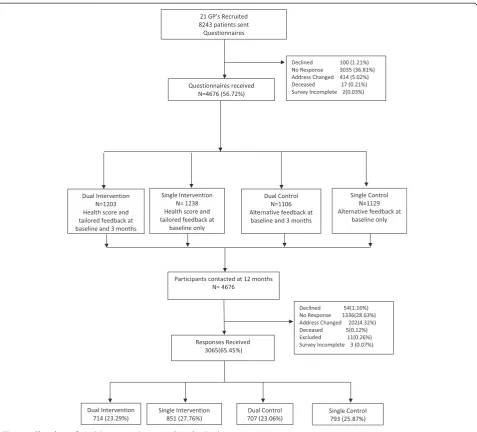
In 2008, 30 GPs in metropolitan Brisbane, Australia, were invited to participate in the 10 Small Steps study. The study protocol has been detailed elsewhere (21). Briefly, participating GPs nominated all eligible patients aged between 18 to 70 years who had consulted them in the previous six months. Patients with active cancer, re-ceiving renal dialysis, recent cardiovascular event, demen-tia, any other terminal illness or recent bereavement were excluded. Names and addresses of eligible patients were provided to the research team, who sent each patient a written invitation to participate, together with a baseline questionnaire and reply-paid envelope. The GP’s letter-head and electronic signature was used for this corres-pondence. Non-responders were sent up to two reminder letters and a new copy of the questionnaire at two weekly intervals. Completion and return of the questionnaire was regarded as consent to participate. Participants could decline involvement in the study at any stage. Figure 1 outlines the participant flow.
For the trial, survey respondents were randomised using a permuted block procedure stratified by GP. Participants residing at the same address were allocated to the same group to avoid contamination across groups. This rando-mised controlled trial used a 2×2 factorial design, with one arm randomising subjects to the intervention of feedback on combined health score and personalised computer tailored advice, or a control group receiving alternative feedback. The other arm was either feedback at baseline (single contact) or an additional assessment and compu-terised feedback at 3 months (dual contact). The 4 study groups created were (A) Intervention with single contact; (B) Intervention with dual contact; (C) Control with single contact and (D) Control with dual contact. The partici-pants were blinded to the group to which they were rando-mised. All participants were assessed again at 12 months with self-reporting of the 10 health behaviours.
Ethics approval was obtained from the Behavioural and Social Sciences Ethical Review Committee of The University of Queensland, Australia. This trial is registered under The Australian New Zealand Clinical Trials Registry: ACTRN12611001213932.
Measurement Instrument
and nine questions collecting demographic information. Responses to items addressing smoking, physical activity (short International Physical Activity Questionnaire [24]), intake of alcohol, meat, fish, vegetables and fruit (V&F), use of unsaturated fats as spreads, avoidance of added salt, type of milk consumed, and body mass index (BMI) were dichotomised. Each behavioural item was assigned a score of ‘1’if adhering to health recommenda-tions or ‘0’ when not adhering to health recommenda-tions. Scores were based on guidelines promulgated by the National Health and Medical Research Council (NHMRC) and the National Heart Foundation of Australia (NHF). Individual health behaviour scores were summed to yield a combined score ranging from 0 to 10. The remaining items in the baseline questionnaire addressed other health behaviours such as tetanus immunization, sun protection
behaviour, non-smoking policies in the home, and partici-pation in mammography and cervical cytology screening. These items did not contribute to the combined score, but were used to provide the control groups with alternative feedback and minimise the risk of attrition.
Intervention content
The information material for intervention group partici-pants consisted of:
(1)Personalised computer-tailored feedback: This focused on six dietary behaviours as well as responses to smoking behaviour, alcohol intake, physical activity and BMI. A one-page, personalised, computer-tailored feedback letter indicating the participant’s combined health score and behaviours
not meeting guideline recommendations. This letter was printed on the treating GP’s letterhead and encouraged the adoption of at least one behaviour not already contributing to the participant’s Prudence Score. The decision as to which additional behaviour (s) to improve was the patient’s own.
(2)Health Promotion Information Material: One-page health promotion information sheets were distributed to participants only for behaviours not meeting national guidelines. For example, participants who did not meet NHMRC guidelines for vegetable intake but did meet recommendations for fruit intake only received the information sheet related to daily vegetable intake.
The information material for control group participants consisted of:
(1)Personalised computer-tailored feedback: This focused on 5 other health protective behavaiours (tetanus immunization, sun protection behaviour, non-smoking policies in the home, and participation in mammography and cervical cytology screening). A one-page, personalised, computer-tailored feedback letter indicating behaviours that meet guideline recommendations was provided. This letter was printed on the treating GP’s letterhead and encouraged the adoption of at least one behaviour not already followed by the participant.
(2)Health Promotion Information Material: One-page health promotion information sheets were distributed to participants only for behaviours not meeting national guidelines for 5 listed behaviours. For example, participants who did not meet Cancer Council guidelines for sun protection behaviour but did meet recommendations for non-smoking policies at home only received the information sheet related to sun protection.
Follow-up
The same assessment questionnaire used at baseline was posted to participants at 3 and/or 12 months. Non-responders were sent up to two reminders along with copies of the cover letter and questionnaire at two week intervals following the initial mailing.
Analysis
All analyses were pre-planned and based on the primary aims of the study. The completed surveys that had more than 10% of missing data were excluded from the study. Baseline differences in groups were analysed with one-way ANOVA for continuous variables and Chi squared test for categorical variables. Participants were classified by their study group and initial analysis performed to
examine comparability across baseline Prudence Score, age, gender, marital status, employment status, education level and area of residence. Participants were compared with non-responders at each follow-up period.
The primary analysis compared change in Prudence Scores of the intervention group over and above the change in control group at 12 months using General Estimating Equations Models. Change in this score was also calcu-lated for dual and single contact groups again using General Estimating Equations Models. Change in indi-vidual health behaviours at 12 months was also examined across the four study groups. The per-protocol analysis was performed along with the intention-to-treat analysis which was based on the assumption that non-completers did not change their behaviour in any direction. Hence all the data collected at baseline, 3 months and 12 months was analysed using General Estimating Equations Models adjusted for age and educational status. Significance was set atP< 0.05 for all analyses.
Power calculations for the main study were based on pilot study results [21] (mean Prudence Score 4.94, SD 1.7). To have a 95% chance of the proportion with a Prudence score of 6 or more increase from 39% to 45%, using two-sidedα= 0.05, required a total of 6600 invitations to par-ticipate, accounting for 20% loss to follow up and response fraction of 60% achieved in the pilot study.
Results
Twenty-one of the thirty invited GPs agreed to partici-pate. In total 8243 patients of these GPs were included in the list of eligible patients. 4678 participants returned questionnaires at baseline and 3068 completed the self-reported questionnaire at 12 months. However, two surveys at baseline and three surveys at 12 months had more than 10% missing data, hence were excluded. Therefore, the number of participants at baseline was 4676 and at 12 was 3065 (completion fraction: 65.45%) (Figure 1).
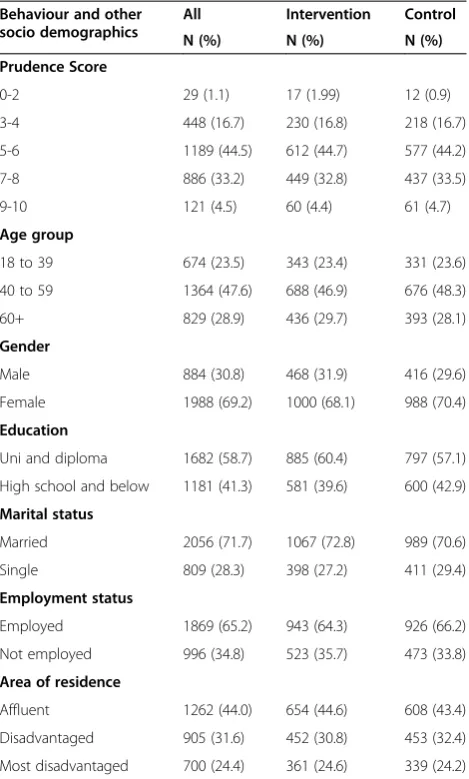
Demographics
Change in prudence score
Table 3 compares change in Prudence Score for the dual and single contact groups. From 1421 participants in dual contact and 1644 in single contact group; complete data were available for 1328 dual contact and 1545 single contact participants. In the per protocol analysis a
greater change was observed at 12 months for partici-pants who received dual contact. (difference of +0.49) compared to participants receiving single contact (differ-ence of +0.31); however this differ(differ-ence was not signifi-cant (coefficient 0.02 [CI =−0.07 to 0.11] & p = 0.70). The changes in mean Prudence Score over 12 months be-tween intervention and control groups were significant even after controlling for baseline differences: for single contact (coefficient 0.16 [CI = 0.09 to 0.23]; p < 0.01) and dual contact (coefficient 0.17 [CI = 0.10 to 0.24]; p < 0.01) groups. For men the change in Prudence Score from base-line was smaller than for women, and of similar size in both dual and single contact groups (Table 3). For women, the increase in Prudence Score at 12 months for interven-tion group was larger in dual versus single contact group (+0.54 vs. +0.32; p = 0.33).
An intention-to-treat analysis was undertaken assum-ing that the participants who did not reply at 12 months did not change their baseline Prudence Score. The ana-lysis showed smaller but still significant change in the mean Prudence Score for the intervention group com-pared to the control group (t = 3.43, p = 0.001). For the dual contact group difference between intervention and control mean Prudence Score was +0.15 and for the sin-gle contact group it was +0.22, showing again no statisti-cally significant difference between dual and single contact groups at 12 months (p = 0.22).
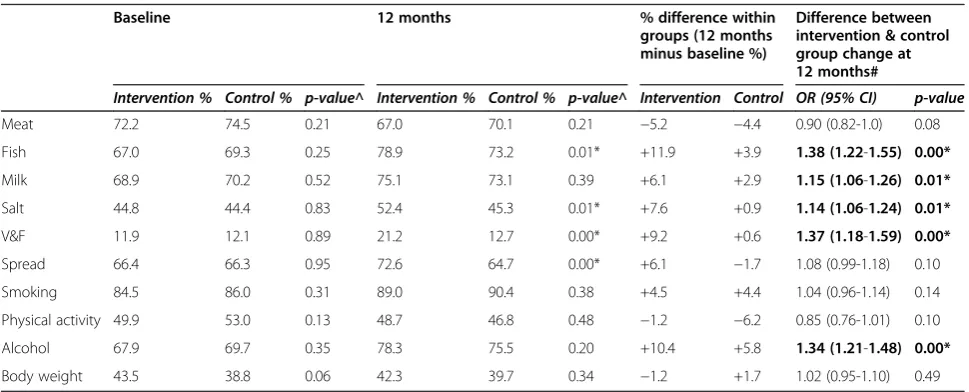
Change in individual health behaviours
The percentage change in adherence to ten individual health behaviours in the dual and single contact groups are shown in Table 4 and Table 5. At baseline there were no significant differences between groups for any of the ten behaviours. At 12 months both dual and single inter-vention participants had significantly improved (when compared to their respective control groups) five out of ten behaviours. None of the groups showed statistically significant improvement in meat intake, smoking, physical activity or BMI at 12 months after the intervention. How-ever, both dual intervention and dual control groups showed positive improvement (+4.48% dual intervention; +4.42% dual control) in adherence to smoking guidelines. Statisti-cally significant odds ratios reflecting improvements in Table 1 Baseline characteristics for 12 months follow-up
respondents
Behaviour and other socio demographics
All Intervention Control
N (%) N (%) N (%)
Prudence Score
0-2 29 (1.1) 17 (1.99) 12 (0.9)
3-4 448 (16.7) 230 (16.8) 218 (16.7)
5-6 1189 (44.5) 612 (44.7) 577 (44.2)
7-8 886 (33.2) 449 (32.8) 437 (33.5)
9-10 121 (4.5) 60 (4.4) 61 (4.7)
Age group
18 to 39 674 (23.5) 343 (23.4) 331 (23.6)
40 to 59 1364 (47.6) 688 (46.9) 676 (48.3)
60+ 829 (28.9) 436 (29.7) 393 (28.1)
Gender
Male 884 (30.8) 468 (31.9) 416 (29.6)
Female 1988 (69.2) 1000 (68.1) 988 (70.4)
Education
Uni and diploma 1682 (58.7) 885 (60.4) 797 (57.1)
High school and below 1181 (41.3) 581 (39.6) 600 (42.9)
Marital status
Married 2056 (71.7) 1067 (72.8) 989 (70.6)
Single 809 (28.3) 398 (27.2) 411 (29.4)
Employment status
Employed 1869 (65.2) 943 (64.3) 926 (66.2)
Not employed 996 (34.8) 523 (35.7) 473 (33.8)
Area of residence
Affluent 1262 (44.0) 654 (44.6) 608 (43.4)
Disadvantaged 905 (31.6) 452 (30.8) 453 (32.4)
Most disadvantaged 700 (24.4) 361 (24.6) 339 (24.2)
Total number of participants vary for each characteristic due to missing data.
Table 2 Socio-demographic differences for respondents and non-respondents at 3 and 12 months follow-up
3 months participants (n = 2309) 12 months participants (n = 4676)
Respondents N = 1711
Non-respondents N = 598
p-value^ Respondents N = 3065
Non-respondents N = 1611
p-value^
Gender (% men) 30.3 34.9 0.07 30.9 33.1 0.15
Age (% > 50 years) 50.2 68.4 0.00 49.1 67.4 0.00
Education (% university or diploma holders)
57.5 51.8 0.02 58.1 54.7 0.05
SES (% affluent) 43.8 48.6 0.06 44.1 47.4 0.12
fish, milk, V&F, and alcohol were common to both interven-tion groups, with the single group showing an improvement in type of spread used, and the dual group showing im-proved adherence to recommended guidelines for salt in-take. The increase in adherence to guidelines for some behaviours was considerable, especially in the dual interven-tion group: for example, fish intake (+11.87%), V&F intake (+9.23%) and safe alcohol consumption levels (+10.42%).
Discussion
The 10 Small Steps project demonstrates that a computer tailored, multiple health behaviour intervention can be
implemented successfully [22,23] and improve adherence to healthy behaviours over a 12-month period. The inter-vention group sustained behaviour changes following a non-contact period of 9 or 12 months. While the dual contact intervention did not result in a statistically signifi-cant benefit over the single contact intervention for the former group there was a trend to larger change in some individual behaviours. Importantly, a significant positive change remained in both groups compared to their re-spective control groups at 12 months.
This intervention trial combined a number of strategies that individually have shown to be important in improving Table 3 Change in mean Prudence Score at 12 months
Dual contact group Single contact group Coefficient^ and p-value
Baseline 12 months Net change Baseline 12 months Net change
All (n = 2872)
Intervention 5.78 (5.69-5.88) 6.27 (6.15-6.39) +0.49 5.82 (5.72-5.91) 6.13 (6.03-6.24) +0.31 0.02 (−0.07-0.11) p = 0.70
Control 5.87 (5.77-5.97) 5.89 (5.77-6.01) +0.02 5.77 (5.67-5.87) 5.93 (5.82-6.04) +0.16
Coefficient^ 0.17 (0.10-0.24) , p < 0.01 0.16 (0.09-0.23), p < 0.01
Men (n = 884)
Intervention 5.62 (5.46-5.78) 6.00 (5.77-6.22) +0.38 5.72 (5.57-5.88) 6.04 (5.86-6.22) +0.32 0.04 (−0.21-0.13) p = 0.64
Control 5.70 (5.52-5.87) 5.66 (5.47-5.87) −0.04 5.54 (5.36-5.71) 5.57 (5.38-5.77) +0.03
Coefficient^ 0.25 (0.8-0.42), p < 0.01 0.16 (0.5-0.18), p < 0.01
Women (n = 1988)
Intervention 5.87 (5.75-5.98) 6.39 (6.25-6.53) +0.52 5.86 (5.74-5.97) 6.18 (6.05-6.37) +0.32 0.06 (−0.06-0.18) p = 0.33
Control 5.94 (5.83-6.06) 5.98 (5.84-6.13) +0.04 5.87 (5.75-5.98) 6.08 (5.95-6.21) +0.21
Coefficient^ 0.22 (0.13-0.31), p < 0.01 0.15 (0.07-0.24), p < 0.01
^Generalised estimating equations used to calculate coefficient and p-value. Analysis adjusted for age and education status.
Table 4 Percentage of dual contact participants adhering to individual health behaviours (n = 1328)
Baseline 12 months % difference within
groups (12 months minus baseline %)
Difference between intervention & control group change at 12 months#
Intervention % Control % p-value^ Intervention % Control % p-value^ Intervention Control OR (95% CI) p-value
Meat 72.2 74.5 0.21 67.0 70.1 0.21 −5.2 −4.4 0.90 (0.82-1.0) 0.08
Fish 67.0 69.3 0.25 78.9 73.2 0.01* +11.9 +3.9 1.38 (1.22-1.55) 0.00*
Milk 68.9 70.2 0.52 75.1 73.1 0.39 +6.1 +2.9 1.15 (1.06-1.26) 0.01*
Salt 44.8 44.4 0.83 52.4 45.3 0.01* +7.6 +0.9 1.14 (1.06-1.24) 0.01*
V&F 11.9 12.1 0.89 21.2 12.7 0.00* +9.2 +0.6 1.37 (1.18-1.59) 0.00*
Spread 66.4 66.3 0.95 72.6 64.7 0.00* +6.1 −1.7 1.08 (0.99-1.18) 0.10
Smoking 84.5 86.0 0.31 89.0 90.4 0.38 +4.5 +4.4 1.04 (0.96-1.14) 0.14
Physical activity 49.9 53.0 0.13 48.7 46.8 0.48 −1.2 −6.2 0.85 (0.76-1.01) 0.10
Alcohol 67.9 69.7 0.35 78.3 75.5 0.20 +10.4 +5.8 1.34 (1.21-1.48) 0.00*
Body weight 43.5 38.8 0.06 42.3 39.7 0.34 −1.2 +1.7 1.02 (0.95-1.10) 0.49
^Chi2 used to test the significant difference for % adherence between intervention and control groups.
#GEE used for measuring statistical significance for difference between changes in intervention group over and above the change in control group. *Significant results (Bolded Text).
health behaviours in the context of primary care. These include: the use of low-intensity computer-tailored feed-back [5], simultaneous focus on multiple health behav-iours [25], endorsement of GPs [26,27], and the use of an intervention reinforcement [28]. A direct comparison of the outcomes of the current study with other studies is not possible, as other studies have incorporated some but not all of these elements. For example, a low inten-sity intervention in a primary care setting for reducing fat and fibre intake was effective after 12 months [29,30]. En-dorsement of the intervention by practitioners was pro-posed as the possible reason for long term success [29]. A number of primary care interventions applying computer-tailored approaches have demonstrated effect-iveness, though they were focused on single risk factors, in-tensive (including more than one or two sessions with computer-tailored advice) or focused on secondary preven-tion only [31-33]. Another successful computer-tailored intervention addressed two behaviours simultaneously but was more comprehensive in content [34].
Many computer-tailored interventions targeting behav-iours, show intervention effects declining quickly after intervention completion, despite initial effectiveness [35,36]. Notably, this was not the case for the ‘10 Small Steps’ study. At 12 months the participants still showed signifi-cant improvements in the health behaviours suggesting that the inclusion of additional strategies alongside com-puter tailoring, such as the endorsement of GPs, may have added benefits in bringing about and maintaining be-haviour change. It is difficult to attribute the positive out-comes observed in the ‘10 Small Steps’ study to any individual strategy and the synergistic effects of the above proven strategies are likely to be responsible for underlying
success in promoting adoption and maintenance of health behaviours in this study.
Most studies evaluating long-term effectiveness of in-terventions indicate that maintenance of healthy behav-iours is difficult. Smoking cessation, for example, has been shown to require a comprehensive and intensive personally tailored approach to help smokers quit in the long term [37]. Similarly, a systematic review of physical activity interventions suggested that additional tailored exercise prescription strategies and booster interventions such as via phone, mail or internet were needed to facili-tate long-term (at least 12 months) effectiveness [38]. This lack of intensity in our pragmatic intervention may explain the failure to achieve significant improvements in‘difficult to change’behaviours such as physical activ-ity, smoking and BMI. However, all intervention and control groups returned positive changes of 3 to 4% in smoking behaviour, which is significant. This indicates that even the ‘control group’ received an intervention, simply by completing a health assessment questionnaire sent with approval of their GP, even without additional focused and tailored feedback. Background smoking rates are declining in Australia, but not to this extent in one year. From 1991 to 2004 the prevalence of smoking in Australia fell from 27.1% to 19.0%, a fall of 8.1% in ab-solute terms, averaging 0.58% per year decline in smok-ing, which is far less than the observed decline in this study [39,40].
There were noticeable similarities in dual and single contact groups: increased fish intake, increased use of low fat milk, increased V&F intake and a higher propor-tion of participants drinking alcohol within guidelines. However, there were some discrepancies between the Table 5 Percentage of single contact participants adhering to individual health behaviours (n = 1545)
Baseline 12 months % difference within
groups (12 months minus baseline %)
Difference between change in intervention & control at 12 months#
Intervention % Control % p^ Intervention % Control % P^ Intervention Control OR p-value
Meat 70.9 71.8 0.62 70.3 72.1 0.27 −0.6 +0.3 0.97 (0.88-1.08) 0.68
Fish 68.5 67.8 0.27 74.4 71.7 0.225 +5.9 +3.9 1.26 (1.10-1.45) 0.00*
Milk 68.5 69.5 0.59 72.7 71.8 0.553 +4.2 +2.3 1.15 (1.05-1.25) 0.00*
Salt 41.6 42.8 0.54 46.3 42.7 0.136 +4.8 −0.2 1.05 (0.97-1.14) 0.19
V&F 13.9 11.2 0.10 18.8 11.9 0.000* +4.9 +0.7 1.22 (10.6-1.41) 0.00*
Spread 67.5 65.1 0.223 71.2 67.9 0.159 +3.6 +2.8 1.12 (1.02-1.23) 0.01*
Smoking 87.3 86.7 0.65 90.2 89.8 0.63 +2.9 +3.1 1.06 (0.95-1.18) 0.23
Physical activity 52.4 50.4 0.348 51.8 47.3 0.06 −0.5 −3.1 0.91 (0.82-1.02) 0.12
Alcohol 68.4 69.5 0.605 76.9 74.4 0.246 +8.5 +4.9 1.37 (1.19-1.57) 0.00*
Body weight 40.7 40.7 0.98 41.7 41.9 0.923 +1.0 +1.2 1.06 (0.92-1.21) 0.37
^Chi2 used to test the significant difference for % adherence between intervention and control groups.
#GEE used for measuring statistical significance for difference between changes in intervention group over and above the change in control group. *Significant results (Bolded Text).
intervention groups as well: while the single contact group increased the use of spreads other than butter, this was not the case with the dual contact group. The dual contact reduced use of salt which was not the case with the single contact group. It is possible that certain behaviours such as salt intake are habitual and require repeated efforts to change. Habit formation theory posits that habit strength increases as a result of repetition and positive reinforcement and that any type of repetitive be-haviour requires decreasing mental effort before eventu-ally becoming habitual [41,42]. In our study, participants in the dual contact group who reduced salt intake might also have been successful in changing other behaviours during 12 months of intervention. The inconsistencies in the adoption of various behaviours in our study suggest that the role of habit formation in relation to behaviour change needs to be further explored. It is also possible that there is a limit to how much an individual can change and, as a result, individuals may “swap” habits by, for example, giving up one healthy habit to take up another that is perceived as more important. There are studies illustrating the limitations of self-regulatory cap-acity and the operating of concepts such as decision fa-tigue, indicating that it might be difficult for an individual to make multiple behavioural changes simultaneously [43]. However, attention to simultaneous or multiple-behaviour change is likely to have a greater impact on public health than sequential or single-behaviour change, possibly by giving individual the autonomy to choose behaviours they perceive as easiest to change. This process can build self-efficacy to change other unhealthy behaviours. Research also suggests simultaneous interventions are more cost ef-fective than sequential interventions which require more resources to repeatedly reach out to participants [34].
Limitations of our study include the use of a dichotom-ous scoring system for health behaviours, where relevant sub-threshold change in behaviour remains undetected. Thus our results may have underestimated the real extent of behaviour change. Secondly, the ten component behaviours of the Prudence Score are equally weighted, rather being weighted according to their relative impacts on health. Also, dietary factors are over represented com-pared to exercise and smoking, which only contributed a single score each. Assessing the impact on morbidity and mortality is beyond the scope of this trial. However, a study employing an equally weighted lifestyle scoring system using all the same items as the Prudence Score (except vegetable and fruit intake and type of spread ) was able to predict mortality in both healthy elderly men and elderly men with established vascular disease [12,44]. This suggests that the aggregate unweighted score is still a meaningful summary of an individual’s effort to protect their health. As change in health behaviours was examined in two ways (as individual behaviours and as a sum score)
it is possible that some significant findings might be attrib-uted to conducting multiple analyses. Thirdly, the use of self-reported data was a potential weakness despite using a previously validated assessment questionnaire [21]. Whilst some behaviour can be monitored object-ively, for example physical activity levels, this is prob-lematic for most dietary behaviours, and alternatives are either extremely costly or impractical. However, the same survey instrument was used to assess behaviours before and after interventions. Another limitation of this study is its inability to undertake a cost-effectiveness analysis as it was not one of the planned outcomes of the trial. However, it is important that future studies consider such analysis.
Although the results of this study do not show a major shift in health behaviours, small individual level changes can be meaningful and contribute to reducing the bur-den of chronic disease on a population level if the inter-vention is implemented on a large scale. Composite health scores that showed significant improvements are associated with better health [9,45] and successful aging [46]. The concept of changing health score on the popu-lation wide scale is in keeping with Geoffrey Rose’s pub-lic health approach, focusing on shifting the distribution of population risk exposure toward a lower mean rather than simply focussing on high risk individuals [47,48]. While the issue of optimal balance between targeted high risk strategies and wider population health strategies is often debated [49], it is important that these strategies work synergistically. Targeting patients using bio-markers can help identifying high risk population whereas using a simple but comprehensive lifestyle behaviour score such as the Prudence Score can be helpful in addressing deter-minants of ill health for the entire populations. Such life-style scores do not rely on biological tests and are easy to comprehend by the lay public. Moreover, interventions such as 10 Small Steps have the ability to work as a trigger for practitioners to briefly and confidently discuss health risk behaviours with their patients, further enhancing be-havioural outcomes.
results of this study can be generalised to the primary care setting.
Conclusions
The challenge for reducing NCDs lies in translating current knowledge about risk factors into meaningful and sustainable behaviour change. This requires feasible strategies that go beyond simply communicating mes-sages to facilitating and empowering individuals to adopt and maintain healthy behaviours. This trial provides evi-dence that long-term changes in health behaviours can be achieved with a low-intensity intervention. Previous research has established that combined health scores are well correlated with morbidity and mortality. This research used the combined health score to positively motivate be-haviour change, in concert with other bebe-haviour change strategies in its design. Further research is needed to better understand the mechanism by which behaviour change and maintenance is achieved and which attributes of this intervention promoted improved health behaviours.
Competing interests
The authors declare that they have no competing interests.
Authors’contributions
SP recruited the general practitioners and study participants, collected and analysed the data and drafted the manuscript. DK participated in recruiting general practitioners. CV also provided supervision in generating tailored feedback and health promotion materials. DK, FB and CV helped to draft the manuscript. KJ conceived the study, and contributed to its design prior to his death in 03/2010. SP, CV, DK, and FB read and approved the final manuscript.
Acknowledgements
We acknowledge the late Professor Konrad Jamrozik’s contribution to the conception, design and implementation of the study prior to his death in March 2010. This work was funded by theMBF Foundation(currently BUPA Health Foundation), a charitable organisation. SP was supported by a National Health and Medical Research Council of Australia post-graduate scholarship (2007–09). CV is supported by a National Health and Medical Research Council of Australia (#519778) and National Heart Foundation of Australia (#PH 07B 3303) post-doctoral research fellowship. We sincerely thank the patients, doctors and staff of the general practices involved with this project.
Author details
1School of Population Health, The University of Queensland, Herston, Queensland 4006, Australia.2School of Medicine, The University of
Queensland, Herston, Queensland, Australia.3Head of Social Science & Health Systems Group, School of Population Health, The University of Queensland, Herston, Queensland, Australia.4Director, Centre for Physical Activity Studies, NHF & NHMRC Research Fellow, Institute for Health and Social Science Research Central Queensland University, Rockhampton, Queensland, Australia.
Received: 10 July 2013 Accepted: 10 March 2014 Published: 19 March 2014
References
1. Australian Institute of Health and Welfare:Risk Factors Contributing to Chronic Disease. Cat No. PHE 157.Canberra: AIHW; 2012.
2. Goldstein MG, Whitlock EP, DePue J:Multiple behavioral risk factor interventions in primary care: summary of research evidence.Am J Prev Med2004,27(2 Suppl):61–79.
3. Australian Institute of Health and Welfare:Australia’s Health 2008. Cat. no. AUS 99.Canberra: AIHW; 2008.
4. Ampt AJ, Amoroso C, Harris MF, McKenzie SH, Rose VK, Taggart JR: Attitudes, norms and controls influencing lifestyle risk factor management in general practice.BMC Fam Pract2009,10(59):59. Epub 2009/08/27.
5. Kroeze W, Werkman A, Brug J:A systematic review of randomized trials on the effectiveness of computer-tailored education on physical activity and dietary behaviors.Ann Behav Med2006,31(3):205–223.
6. Skinner CS, Campbell MK, Rimer BK, Curry S, Prochaska JO:How effective is tailored print communication?Ann Behav Med1999,21(4):290–298. Epub 2000/03/18.
7. Lairson DR, Newmark GR, Rakowski W, Tiro JA, Vernon SW:Development costs of a computer-generated tailored intervention.Eval Program Plann 2004,27:161–169.
8. Jiao L, Mitrou PN, Reedy J, Graubard BI, Hollenbeck AR, Schatzkin A, Stolzenberg-Solomon R:A combined healthy lifestyle score and risk of pancreatic cancer in a large cohort study.Arch Intern Med2009, 169(8):764–770.
9. Khaw KT, Wareham N, Bingham S, Welch A, Luben R, Day N:Combined impact of health behaviours and mortality in men and women: the EPIC-Norfolk prospective population study.PLoS Med2008,5(1):e12. 10. Myint PK, Luben RN, Wareham NJ, Bingham S, Khaw KT:Combined effect
of health behaviours and risk of first ever stroke in 20,040 men and women over 11 years' follow-up in Norfolk cohort of European Prospect-ive Investigation of Cancer (EPIC Norfolk): prospectProspect-ive population study. Bmj2009,338:b349.
11. Spencer CA, Jamrozik K, Lawrence-Brown M, Norman PE:Lifestyle still predicts mortality in older men with established vascular disease.Prev Med 2005,41(2):583–588.
12. Spencer CA, Jamrozik K, Norman PE, Lawrence-Brown M:A simple lifestyle score predicts survival in healthy elderly men.Prev Med2005,40(6):712–717. 13. Galan I, Rodriguez-Artalejo F, Diez-Ganan L, Tobias A, Zorrilla B, Gandarillas
A:Clustering of behavioural risk factors and compliance with clinical preventive recommendations in Spain.Prev Med2006,42(5):343–347. Epub 2006/03/21.
14. Brinkworth GD, Noakes M, Keogh JB, Luscombe ND, Wittert GA, Clifton PM: Long-term effects of a high-protein, low-carbohydrate diet on weight control and cardiovascular risk markers in obese hyperinsulinemic subjects.Int J Obes Relat Metab Disord2004,28(5):661–670. Epub 2004/03/10. 15. Kontogianni MD, Vidra N, Farmaki AE, Koinaki S, Belogianni K, Sofrona S,
Magkanari F, Yannakoulia M:Adherence rates to the Mediterranean diet are low in a representative sample of Greek children and adolescents. J Nutr2008,138(10):1951–1956. Epub 2008/09/23.
16. Gine-Garriga M, Martin C, Puig-Ribera A, Anton JJ, Guiu A, Cascos A, Ramos R: Referral from primary care to a physical activity programme: establishing long-term adherence? A randomized controlled trial. Rationale and study design.BMC Public Health2009,9:31. Epub 2009/01/24.
17. Korhonen MH, Litmanen H, Rauramaa R, Vaisanen SB, Nishanen L, Uusitupa M: Adherence to the salt restriction diet among people with mildly elevated blood pressure.Eur J Clin Nutr1999,53(11):880–885. Epub 1999/11/11. 18. Franz MJ, VanWormer JJ, Crain AL, Boucher JL, Histon T, Caplan W, Bowman
JD, Pronk NP:Weight-loss outcomes: a systematic review and meta-analysis of weight-loss clinical trials with a minimum 1-year follow-up.J Am Diet Assoc2007,107(10):1755–1767. Epub 2007/10/02.
19. Goldberg JH, King AC:Physical activity and weight management across the lifespan.Annu Rev Public Health2007,28:145–170. Epub 2006/12/16. 20. Hollis JF, Gullion CM, Stevens VJ, Brantley PJ, Appel LJ, Ard JD, Champagne
CM, Dalcin A, Erlinger TP, Funk K, Laferriere D, Lin PH, Loria CM, Samuel-Hodge C, Vollmer WM, Svetkey LP:Weight loss during the intensive intervention phase of the weight-loss maintenance trial.Am J Prev Med 2008,35(2):118–126. Epub 2008/07/12.
21. Parekh S, King D, Owen N, Jamrozik K:Spousal concordance and reliability of the 'Prudence Score' as a summary of diet and lifestyle.Aust New Zeal J Publ Health2009,33(4):320–324. Epub 2009/08/20.
22. Parekh S, Vandelanotte C, King D, Boyle FM:Design and baseline
characteristics of the 10 Small Steps Study: a randomised controlled trial of an intervention to promote healthy behaviour using a lifestyle score and personalised feedback.BMC Public Health2012,12:179. Epub 2012/03/13. 23. Parekh S, Vandelanotte C, King D, Boyle FM:Improving diet, physical
general practice: a randomised controlled trial.Int J Behav Nutr Phys Act 2012,9:108. Epub 2012/09/12.
24. Craig CL, Marshall AL, Sjostrom M, Bauman ML, Ainsworth BE, Pratt M, Ekelund U, Yngve A, Sallis JF, Oja P:International physical activity questionnaire: 12-country reliability and validity.Med Sci Sports Exerc 2003,35(8):1381–1395. Epub 2003/08/06.
25. Prochaska JO:Multiple health behavior research represents the future of preventive medicine.Prev Med2008,46(3):281–285.
26. Glasgow RE, Bull SS, Gillette C, Klesqes LM, Dzewaltowski DA:Behavior change intervention research in healthcare settings: a review of recent reports with emphasis on external validity.Am J Prev Med2002, 23(1):62–69.
27. Kreuter MW, Chheda SG, Bull FC:How does physician advice influence patient behavior? Evidence for a priming effect.Arch Fam Med2000, 9(5):426–433.
28. Ashby WWG:Behavior therapy for obesity:booster sessions and long-term maintenance of weight loss.Behav Res Ther1977,15(6):451–463.
29. Beresford SA, Curry SJ, Kristal AR, Lazovich D, Feng Z, Wagner EH:A dietary intervention in primary care practice: the Eating Patterns Study.Am J Public Health1997,87(4):610–616. Epub 1997/04/01.
30. Shannon J, Kristal AR, Curry SJ, Beresford SA:Application of a behavioral approach to measuring dietary change: the fat- and fiber-related diet behavior questionnaire.Cancer Epidemiol Biomarkers Prev1997, 6(5):355–361. Epub 1997/05/01.
31. Brug J, Glanz K, Van Assema P, Kok G, van Breukelen GJ:The impact of computer-tailored feedback and iterative feedback on fat, fruit, and vegetable intake.Health Educ Behav1998,25(4):517–531. Epub 1998/ 08/05.
32. Unrod M, Smith M, Spring B, DePue J, Redd W, Winkel G:Randomized controlled trial of a computer-based, tailored intervention to increase smoking cessation counseling by primary care physicians.J Gen Intern Med2007,22(4):478–484.
33. Van Sluijs EM, Van Poppel MN, Twisk JW, Brug J, Van Mechelen W:The positive effect on determinants of physical activity of a tailored, general practice-based physical activity intervention.Health Educ Res2005,20 (3):345–356.
34. Vandelanotte C, Bourdeaudhuij ID, Brug J:Two-year follow-up of sequential and simultaneous interactive computer-tailored interventions for increasing physical activity and decreasing fat intake.Ann Behav Med 2007,33(2):213–219.
35. Krebs P, Prochaska JO, Rossi JS:A meta-analysis of computer-tailored interventions for health behavior change.Prev Med2010,51(3–4):214–221. Epub 2010/06/19.
36. Short CE, James EL, Plotnikoff RC, Girgis A:Efficacy of tailored-print interventions to promote physical activity: a systematic review of randomised trials.Int J Behav Nutr Phys Act.2011,8:113. Epub 2011/10/18.
37. Dijkstra A, De Vries H, Roijackers J:Long-term effectiveness of computer-generated tailored feedback in smoking cessation.Health Educ Res1998, 13(2):207–214. Epub 1998/05/07.
38. Muller-Riemenschneider F, Reinhold T, Nocon M, Willich SN:Long-term effectiveness of interventions promoting physical activity: a systematic review.Prev Med2008,47(4):354–368. Epub 2008/08/05.
39. Australian Institute of Health and Welfare:2004 National Drug Strategy Household Survey: First Results. AIHW cat. no. PHE 57.Canberra: AIHW (Drug Statistics Series No. 13); 2005.
40. Chapman S:Falling prevalence of smoking: how low can we go?Tobacco control2007,16(3):145–147. Epub 2007/06/15.
41. Aarts H, Paulussen T, Schaalma H:Physical exercise habit: on the conceptualization and formation of habitual health behaviours. Health Educ Res1997,12(3):363–374. Epub 1997/08/05.
42. Aarts H, Verplanken B, Knippenberg A:Predicting behavior from actions in the past: repeated decision making or a matter of habit?J Appl Soc Psychol1998,28(15):1355–1374.
43. Vohs KD, Baumeister RF, Schmeichel BJ, Twenge JM, Nelson NM, Tice DM: Making choices impairs subsequent self-control: a limited-resource account of decision making, self-regulation, and active initiative.J Pers Soc Psychol2008,94(5):883–898. Epub 2008/05/01.
44. Spencer CA, Jamrozik K, Lambert L:Do simple prudent health behaviours protect men from myocardial infarction?Int J Epidemiol1999,28(5):846–852.
45. Van Dam RM, Li T, Spiegelman D, Franco OH, Hu FB:Combined impact of lifestyle factors on mortality: prospective cohort study in US women. Bmj.2008,337:a1440.
46. Sabia S, Singh-Manoux A, Hagger-Johnson G, Cambois E, Brunner EJ, Kivimaki M:Influence of individual and combined healthy behaviours on successful aging.CMAJ2012,184(18):1985–1992. Epub 2012/10/24. 47. Rose G:Sick individuals and sick populations.Int J Epidemiol1985,
14(1):32–38. Epub 1985/03/01.
48. Rose G:High-risk and population strategies of prevention: ethical considerations.Ann Med1989,21(6):409–413. Epub 1989/12/01. 49. Marmot M, Friel S, Bell R, Houweling TA, Taylor A, Commission on Social
Determinants of Health Collaborators:Closing the gap in a generation: health equity through action on the social determinants of health. Lancet2008,372(9650):1661–1669. Epub 2008/11/11.
50. Britt H, Miller GC, Charles J, Henderson J, Bayram C, Valenti L, Pan Y, Harrison C, Fahridin S, O'Halloran J:General Practice Activity in Australia 1999–00 to 2008–09: 10 year Data Tables.Canberra: AIHW; 2010.
doi:10.1186/1479-5868-11-41
Cite this article as:Parekhet al.:Randomized controlled trial of a computer-tailored multiple health behaviour intervention in general practice: 12-month follow-up results.International Journal of Behavioral Nutrition and Physical Activity201411:41.
Submit your next manuscript to BioMed Central and take full advantage of:
• Convenient online submission
• Thorough peer review
• No space constraints or color figure charges
• Immediate publication on acceptance
• Inclusion in PubMed, CAS, Scopus and Google Scholar
• Research which is freely available for redistribution