R E S E A R C H
Open Access
Validity and reliability of HOP-Up: a
questionnaire to evaluate physical activity
environments in homes with
preschool-aged children
Carolyn Cheng
1, Jennifer Martin-Biggers
1, Virginia Quick
1*, Kim Spaccarotella
2and Carol Byrd-Bredbenner
1Abstract
Background:Early identification of physical activity (PA) opportunities in the home and neighborhood
environment may help obesity prevention efforts in households with young children. This cross-sectional study’s purpose was to develop a brief, easy-to-use, self-report inventory called Home Opportunities for Physical activity check-Up (HOP-Up), to evaluate the availability and accessibility of PA space and equipment in and near homes with preschool children, and establish its validity and reliability.
Methods:The HOP-Up was field tested by two trained researchers and parents of preschool-aged children (n= 50; 71 % white). To establish criterion validity, researchers were the‘gold standard’and visited participants’homes to assess their PA environments using the HOP-Up, while participants separately completed their HOP-Up. Two weeks later, parents completed the HOP-Up online for test-retest reliability. After minor survey refinements, exploratory and confirmatory factor analysis using a split-half cross validation procedure was conducted in a larger sample of participants (n= 655, 60 % white) who completed the HOP-Up online to examine its factor structure. To establish convergent validity, correlations were conducted to compare HOP-Up scales from the factor solution generated with PA behavior and cognitions, and reported screen time.
Results:Intra-class correlations (ICCs) examining HOP-Up item agreement between researcher and parents revealed slight to substantial agreement (range 0.22 to 0.81) for all items. ICCs for all HOP-Up items ranged from fair to substantial agreement between parent responses at both time points (range 0.42 to 0.95). Exploratory factor analysis revealed a five factor solution (18 items), supported eigen values, scree plots, review for contextual sense, and confirmatory factor analysis. Additionally, there were significant (p< 0.05) positive correlations among nearly all five HOP-Up scales with parent and child physical activity levels (range 0.08 to 0.35), and values parents placed on PA for self and child (range 0.16 to 0.35), and negative correlations of Neighborhood Space & Supports for PA scale with parent and child reported screen time (r=−0.11,r=−0.13, respectively).
Conclusions:Findings support the psychometric properties of this brief, easy-to-use, HOP-Up questionnaire, which may help parents, prevention researchers, residential planners, and practitioners increase their understanding of how the home environment—inside, outside, and the neighborhood—impacts preschool children’s physical activity levels.
Keywords:Physical activity, Environment, Neighborhood, Yard, Home, Children, Parent, Availability, Accessibility, Space, Questionnaire
Abbreviations:BMI, Body mass index; HOP-Up, Home opportunities for physical activity check-up questionnaire; ICC, Intra-class correlations
* Correspondence:[email protected]
1Rutgers, The State University of New Jersey, 26 Nichol Avenue, New Brunswick, NJ 08901, USA
Full list of author information is available at the end of the article
Background
Daily physical activity is key to maintaining a healthy lifestyle and preventing excess weight gain [1, 2]. Ac-cording to the Social Cognitive Theory [3], behaviors, such as physical activity, and the environment interact simultaneously and reciprocally. Behavior can affect the environment, but the environment also shapes behavior [3]; consequently, changing the physical activity environ-ment potentially could increase physical activity and reduce sedentary activity.
A barrier to being physically active is environments that are not supportive of physical activity. For instance, half of the children in the United States do not have a park, community center, and/or sidewalk in their neigh-borhood [4]. Perceptions of crime, traffic safety, and walkability among families with children and adolescents also influence use of physical activity supports (e.g., parks, playgrounds) [5]. Children residing in urban areas engage in significantly less physical activity than peers living in suburban areas, and urban parents express more anxiety about neighborhood safety [5–8].
Home environments supportive of physical activity are especially important for young children because of the proportion of time they spend at home. Children living in homes that provide many opportunities for sedentary behaviors, such as those with many televisions, com-puters, and other electronic media devices, may be less active [9] and get more than the recommended 2 h of screen time daily [10–13]. Additionally, screen time tends to increase energy intake by promoting snacking behavior and suppressing satiety cues during screen time [14, 15]. Evidence also indicates that having physical ac-tivity equipment in the home is negatively correlated with TV viewing [16], and parents’physical activity, sup-port, and time spent with child are positively correlated with their children’s physical activity levels [17, 18].
Equally important to supporting physical activity are access to equipment, programs, and space [19]. Accessi-bility may help to promote “ease of use and cueing of behavior,”[20] and is thus, important as a prompt to en-gage in specific behaviors (e.g., use of available equip-ment). In a prior review, access to facilities and physical activity programming was related to increased children’s physical activity [19] and may be an important predictive barrier to physical activity among adults [16], who model physical activity behaviors for their children.
Early identification of the availability and accessibility of physical activity opportunities in the home and neigh-borhood environment may help childhood obesity pre-vention efforts. Several studies have focused on the neighborhood physical activity environment [2, 21–23]; however, little is known about physical activity oppor-tunities in and around the outside of homes where families with young children reside. In addition, many
previous home environment assessments have not considered the frequency with which available physical activity supports are accessed [24]. Furthermore, existing questionnaires for assessing home physical activity environments tend to be burdensome (lengthy, difficult to use), not well matched to households with preschool children, and/or do not report psychometric data [16, 20, 25–32]. Few existing questionnaires are validated and/or have established reliability [20, 25, 27, 28, 32]. The variability and lack of standard questionnaires specific to households with preschoolers make published data difficult to compare [2, 16, 20–23, 25–33]. Thus, the purpose of this study was to develop a brief, easy-to-use, self-report inventory to evaluate the availability and accessibility of physical activity space and equipment in and near homes with preschool children between the ages of 2 and 5 years and to establish the validity and reliability of the questionnaire.
Methods
The HOP-Up (Home Opportunities for Physical activity check-Up) questionnaire aimed to assess the availability of physical activity equipment and space inside the homes, immediately outside the homes (yard), and in the neighborhoods of families with preschool-aged children and how frequently equipment and space are accessed. Ethical approval to conduct this study was granted by the institutional review board at Rutgers University.
Questionnaire development
Questionnaire development was a ten-phase process (Table 1). The first phase was an extensive examination of published questionnaires designed to assess physical activity supports and frequency of access in the home, immediately outside the home (yard), and in the neighbor-hood to identify key components to incorporate in the study questionnaire [2, 16, 20–23, 25, 26, 28, 29, 31, 34]. The second phase involved creating a bank of items from the review conducted in the first phase that, based on this study’s purpose, could be used or adapted and organized by location in and around the home (i.e., inside the home, immediately outside the home, and neighbor-hood). Items were derived from numerous published questionnaires [23, 25–27, 31, 35–38].
items that did not pertain to physical activities that were age-appropriate for preschool children (e.g., presence of basketball hoop at the home). Guidelines for develop-ment of instrudevelop-ment items were carefully followed throughout the development and refinement of the questionnaire [39–41].
In phase five, items were formatted and scoring proce-dures established. In phase six, the questionnaire under-went review by a panel of experts (n= 8) in tests and measurements, physical activity, and community-based obesity prevention programs to establish content validity and further refine the items. Experts were instructed to determine whether the items comprehensively reflected the key environmental factors in and around the home that could affect activity levels of preschool-aged chil-dren. Experts felt that the questionnaire adequately reflected the key environmental factors, such as space and active play supports related to physical activity levels of preschool-aged children in and around the home and agreed the questionnaire had content validity. They had minor suggestions for streamlining the questionnaire.
In phase seven, the questionnaire was subjected to cognitive testing [42] to ensure that the parents of pre-schoolers (n= 5) interpreted the items as intended and to establish face validity. During cognitive testing, par-ents were asked to read each item aloud, describe in their own words what the question was asking, and then explain how they would answer the question using the response choices provided. Researchers assessed results to determine how accurately participants understood the question and response choices. Cognitive testing results and suggestions from parents were used to refine the questionnaire. Refinements included improvements in instructions, adding definitions of active play to each section of the questionnaire (i.e., active play means doing activities that make the child sweat and breathe harder than normal, like riding scooters or tricycles, running, dancing, jumping, and horseplay or wrestling), and incorporation of bolding, italicizing, and underlining to emphasize keywords, such asinside [the home],outside [the home], neighborhood, and active play to reinforce the question to help ensure accurate responses.
Table 1The 10-phases of the HOP-Up physical activity environment questionnaire development
Phase 1 Literature Review
▪Extensive review of published questionnaires that assess physical activity and/or sedentary activity supports and frequency of use in the home to identify key components of the home and near environments related to obesity risk
Phase 2 Item Bank Creation
▪Identification of items pertinent to study purpose
▪Adaptation, enhancement, and expansion of questionnaire items
▪Organization of items by location category (i.e., inside the home, immediately outside the home [i.e., yards], and neighborhoods [i.e., playgrounds])
Phase 3 Initial Expert Review of Items
▪Expert review (n= 6) of items to identify appropriateness, gaps in assessment, and suitability for use in homes with preschool children
Phase 4 Item Refinement
▪Further item adaptation, expansion, andde novodevelopment
▪Revision or elimination of items that were age-inappropriate (e.g., presence of basketball hoop at the home)
Phase 5 Questionnaire Design
▪Creation of questionnaire layout
▪Development of scoring procedures Phase 6 Content Validity Review
▪Second expert (n= 8) review and refinement to establish content validity and confirm scoring procedure
▪Refinement of items Phase 7 Cognitive Testing
▪Cognitive testing conducted with parents of preschoolers (n= 5) to ensure accurate comprehension and establish face validity
▪Refinement of items
Phase 8 Field Testing to Establish Criterion Validity and Test-Retest Reliability
▪Field-tested questionnaire with parents age≥18 and <45 years and having at least one child 2- to 5-years-old
▪Part 1: At home visits, parents and researchers simultaneously, but independently, completed the questionnaire (researchers served as the“gold standard”or criterion and followed specific guidelines)
▪Part 2: ~2 weeks later, parents completed the questionnaire online again to establish test-retest reliability
▪Refinement of the questionnaire based on field testing results. Phase 9 Establishing Scale Unidimensionality, Internal Consistency, and Convergent Validity
▪Factor analysis of the refined questionnaire with parents (N= 655) having at least one child 2- to 5-years-old completing baseline questionnaires for the HomeStyles intervention.
▪Split-half cross-validation with exploratory (n= 327) and confirmatory (n= 330) halves to examine factor structure of the measure using Principal Components Analysis with varimax rotation (orthongonal) and Kaiser normalization to establish unidimensionality of the scales.
▪Part 1: Iterative exploratory factor analysis conducted to identify strong factor solutions (minimum loading of 0.4) and eliminate cross-loading items (loadings on >1 scale within <0.2 of each other).
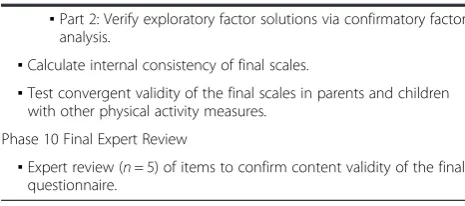
Table 1The 10-phases of the HOP-Up physical activity environment questionnaire development (Continued)
▪Part 2: Verify exploratory factor solutions via confirmatory factor analysis.
▪Calculate internal consistency of final scales.
▪Test convergent validity of the final scales in parents and children with other physical activity measures.
Phase 10 Final Expert Review
In phases 8, 9, and 10, the questionnaire was field tested, tested with a large sample of preschool parents, and subjected to a final expert review, respectively. The focus of this article is to report on the last three phases of development (i.e., phases 8 to 10).
Phase 8
The goal of the phase 8 was to field test the HOP-Up questionnaire and establish criterion validity and test-retest reliability. HOP-Up evaluated the physical activity environment in three main locations: inside the home, area right outside the home (yard), and neighborhood. Table 2 shows the items and organization of the ques-tionnaire used in phase 8. The phase 8 version of the Physical Activity Environment Inside the Home section of the questionnaire had three scales. TheAvailability of Space & Supports Inside scale assessed space available inside the home for active play (2 items) and supports for physical activity inside (e.g., toys, active video games, playmates) (3 items). TheAccessibility Inside scales eval-uated parent policy related to time permitted for active indoor play (1 item) and the ease with which preschool children can access indoor play supports and play in-doors without help from parents (2 items). Availability of Space & Supports InsideandAccessibility Insidescales had a 5-point Likert scale (i.e., strongly disagree to strong agree). The 3-itemFrequency of Inside Active Play scale measured how often preschool children play inside, use physical activity supports, and play with siblings or friends. Answer choices were a 5-point scale ranging from almost never to every day.
The Physical Activity Environment Outside the Home (Yard) section focuses on areas in the yard or areas im-mediately outside the home and has three scales analo-gous to those from the inside the home section of the questionnaire. The Availability of Space & Supports Outside (Yard) scale assessed space for active play (3 items) and supports for active play (e.g., swings and slides; toys like balls and wheeled toys, and play shoes and clothes; 4 items). The 3-item Accessibility Outside (Yard) scale appraised parent policy with regard to time allowed for playing outdoors and how easy it is for pre-school children to access outdoor play equipment and to play outside without adult help. All items on the Avail-ability of Space & Supports Outside (Yard) and Accessi-bility Outside (Yard) scales had 5-point Likert response choices ranging from strongly disagree to strongly agree, except for the item asking parents the size of the play area outside their homes which asked participants to estimate the equivalent number of parking spaces avail-able for outside play. The Frequency of Outside (Yard) Home Play scale evaluated how often children played outside and played with a dog (2 items). TheFrequency
of Outside(Yard)Home Playitems had the same answer choices as theFrequency of Inside Active Playscale.
Similar to the other two sections of the questionnaire, the Physical Activity Environment in the Neighborhood section also had three analogous scales. TheAvailability of Space & Supports in the Neighborhood scale assessed space availability for active play (e.g., parks, pools, play-grounds, recreation centers; 2 items) and active play supports (e.g., swing sets, slides, other play equipment for children; 2 items). TheNeighborhood Access & Safety scale assessed neighborhood safety (e.g., traffic, crime, biting insects, crowding; 6 items) and ease with which neighborhood play areas can be accessed (1 item). An-swer choices for items on these scales were a 5-point Likert scale ranging from strongly disagree to strongly agree; however, a “don’t know” choice was available in case parents were not well acquainted with their neigh-borhood. The 2-item Frequency of Neighborhood Active Play scale assessed how frequently neighborhood active play areas were used and had the same answer choices as used on analogous scales for inside the home and out-side (yard) areas.
All Physical Activity Environment items with a 5-point Likert scale were scored as 5, 4, 3, 2, or 1 points if an-swered strongly agree, agree, neither agree nor disagree, disagree, or strongly disagree, respectively, when the item had a positive polarity. Scoring was reversed for items with a negative polarity. “Don’t know” answer choices were not scored. Frequency items were scored as 5, 4, 3, 2, or 1 points for answers every day, 5 to 6 times a week, 3 to 4 times a week, 1 or 2 times a week, or almost never, respectively. The item estimating phys-ical activity space in the yard (in terms of parking spaces) was scored as follows: 1 = 0 or 1 space, 2 = 2 to 3 spaces, 3 = 4 to 5 spaces, 4 = 6 to 7 spaces, 5 = more than 7 spaces. Scores for each item in a scale were averaged to create the scale score. Higher scores indi-cated greater availability of space, greater availability of active play supports, more positive parent policies toward active play, easier accessibility to physical ac-tivity, greater sense of safety for active play, and greater frequency of active play.
Phase 8 sample
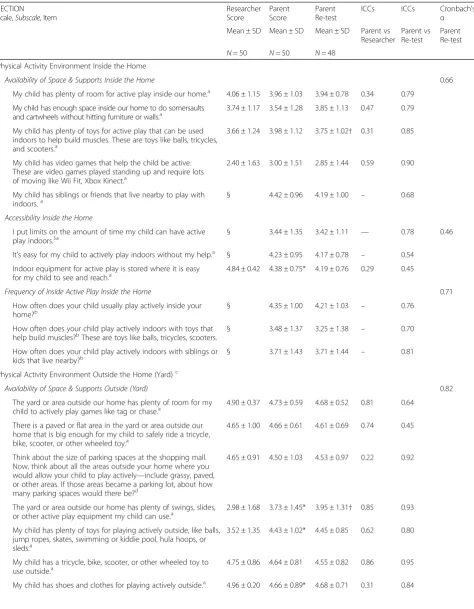
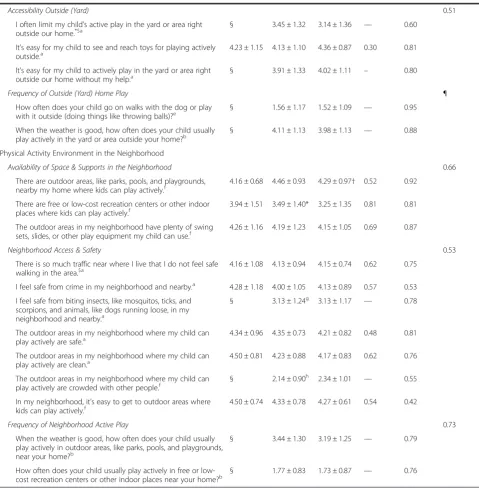
Table 2Phase 8-field testing results of the HOP-Up physical activity environment questionnaire: researcher and parent scores and intraclass correlations (ICCs)
SECTION Scale,Subscale, Item
Researcher Score
Parent Score
Parent Re-test
ICCs ICCs Cronbach’s
α Mean ± SD Mean ± SD Mean ± SD Parent vs
Researcher
Parent vs Re-test
Parent Re-test
N= 50 N= 50 N= 48
Physical Activity Environment Inside the Home
Availability of Space & Supports Inside the Home 0.66
My child has plenty of room for active play inside our home.a 4.06 ± 1.15 3.96 ± 1.03 3.94 ± 0.78 0.34 0.79 My child has enough space inside our home to do somersaults
and cartwheels without hitting furniture or walls.a
3.74 ± 1.17 3.54 ± 1.28 3.85 ± 1.13 0.47 0.79
My child has plenty of toys for active play that can be used indoors to help build muscles. These are toys like balls, tricycles, and scooters.a
3.66 ± 1.24 3.98 ± 1.12 3.75 ± 1.02† 0.31 0.85
My child has video games that help the child be active. These are video games played standing up and require lots of moving like Wii Fit, Xbox Kinect.a
2.40 ± 1.63 3.00 ± 1.51 2.85 ± 1.44 0.59 0.90
My child has siblings or friends that live nearby to play with indoors.a
§ 4.42 ± 0.96 4.19 ± 1.00 – 0.68
Accessibility Inside the Home
I put limits on the amount of time my child can have active
play indoors.$a § 3.44 ± 1.35 3.42 ± 1.11 — 0.78 0.46
It’s easy for my child to actively play indoors without my help.a § 4.23 ± 0.95 4.17 ± 0.78 – 0.54 Indoor equipment for active play is stored where it is easy
for my child to see and reach.a 4.84 ± 0.42 4.38 ± 0.75* 4.19 ± 0.76 0.29 0.45
Frequency of Inside Active Play Inside the Home 0.71
How often does your child usually play actively inside your
home?b § 4.35 ± 1.00 4.21 ± 1.03 – 0.76
How often does your child play actively indoors with toys that
help build muscles?bThese are toys like balls, tricycles, scooters. § 3.48 ± 1.37 3.25 ± 1.38 – 0.70 How often does your child play actively indoors with siblings or
kids that live nearby?b
§ 3.71 ± 1.43 3.71 ± 1.44 – 0.81
Physical Activity Environment Outside the Home (Yard)c
Availability of Space & Supports Outside (Yard) 0.82
The yard or area outside our home has plenty of room for my child to actively play games like tag or chase.a
4.90 ± 0.37 4.73 ± 0.59 4.68 ± 0.52 0.81 0.64
There is a paved or flat area in the yard or area outside our home that is big enough for my child to safely ride a tricycle, bike, scooter, or other wheeled toy.a
4.65 ± 1.00 4.66 ± 0.61 4.61 ± 0.69 0.74 0.45
Think about the size of parking spaces at the shopping mall. Now, think about all the areas outside your home where you would allow your child to play actively—include grassy, paved, or other areas. If those areas became a parking lot, about how many parking spaces would there be?d
4.65 ± 0.91 4.50 ± 1.03 4.53 ± 0.97 0.22 0.92
The yard or area outside our home has plenty of swings, slides,
or other active play equipment my child can use.a 2.98 ± 1.68 3.73 ± 1.45* 3.95 ± 1.31† 0.85 0.93 My child has plenty of toys for playing actively outside, like balls,
jump ropes, skates, swimming or kiddie pool, hula hoops, or sleds.a
3.52 ± 1.35 4.43 ± 1.02* 4.45 ± 0.85 0.62 0.80
My child has a tricycle, bike, scooter, or other wheeled toy to use outside.a
4.75 ± 0.86 4.64 ± 0.81 4.55 ± 0.82 0.86 0.95
Table 2Phase 8-field testing results of the HOP-Up physical activity environment questionnaire: researcher and parent scores and intraclass correlations (ICCs)(Continued)
Accessibility Outside (Yard) 0.51
I often limit my child’s active play in the yard or area right
outside our home.*$a § 3.45 ± 1.32 3.14 ± 1.36 — 0.60
It’s easy for my child to see and reach toys for playing actively outside.a
4.23 ± 1.15 4.13 ± 1.10 4.36 ± 0.87 0.30 0.81
It’s easy for my child to actively play in the yard or area right
outside our home without my help.a § 3.91 ± 1.33 4.02 ± 1.11 – 0.80
Frequency of Outside (Yard) Home Play ¶
How often does your child go on walks with the dog or play with it outside (doing things like throwing balls)?e
§ 1.56 ± 1.17 1.52 ± 1.09 — 0.95
When the weather is good, how often does your child usually
play actively in the yard or area outside your home?b § 4.11 ± 1.13 3.98 ± 1.13 — 0.88 Physical Activity Environment in the Neighborhood
Availability of Space & Supports in the Neighborhood 0.66
There are outdoor areas, like parks, pools, and playgrounds, nearby my home where kids can play actively.f
4.16 ± 0.68 4.46 ± 0.93 4.29 ± 0.97† 0.52 0.92
There are free or low-cost recreation centers or other indoor
places where kids can play actively.f 3.94 ± 1.51 3.49 ± 1.40* 3.25 ± 1.35 0.81 0.81
The outdoor areas in my neighborhood have plenty of swing sets, slides, or other play equipment my child can use.f
4.26 ± 1.16 4.19 ± 1.23 4.15 ± 1.05 0.69 0.87
Neighborhood Access & Safety 0.53
There is so much traffic near where I live that I do not feel safe
walking in the area.$a 4.16 ± 1.08 4.13 ± 0.94 4.15 ± 0.74 0.62 0.75
I feel safe from crime in my neighborhood and nearby.a 4.28 ± 1.18 4.00 ± 1.05 4.13 ± 0.89 0.57 0.53 I feel safe from biting insects, like mosquitos, ticks, and
scorpions, and animals, like dogs running loose, in my neighborhood and nearby.a
§ 3.13 ± 1.24g 3.13 ± 1.17 — 0.78
The outdoor areas in my neighborhood where my child can play actively are safe.a
4.34 ± 0.96 4.35 ± 0.73 4.21 ± 0.82 0.48 0.81
The outdoor areas in my neighborhood where my child can
play actively are clean.a 4.50 ± 0.81 4.23 ± 0.88 4.17 ± 0.83 0.62 0.76
The outdoor areas in my neighborhood where my child can play actively are crowded with other people.f
§ 2.14 ± 0.90h 2.34 ± 1.01 — 0.55
In my neighborhood, it’s easy to get to outdoor areas where
kids can play actively.f 4.50 ± 0.74 4.33 ± 0.78 4.27 ± 0.61 0.54 0.42
Frequency of Neighborhood Active Play 0.73
When the weather is good, how often does your child usually play actively in outdoor areas, like parks, pools, and playgrounds, near your home?b
§ 3.44 ± 1.30 3.19 ± 1.25 — 0.79
How often does your child usually play actively in free or low-cost recreation centers or other indoor places near your home?b
§ 1.77 ± 0.83 1.73 ± 0.87 — 0.76
*Researcher score significantly different from parent score (P< .05) using independent t-tests †Parent score significantly different from parent re-test (P< .05) using paired t-tests
§ Item could not be observed by researchers and thus could not be included in the criterion validity assessment $
Reverse score item
¶ Too few families (n= 13) report having a dog, making intraclass correlations inappropriate a
Answer choices: Strongly disagree, disagree, neither agree nor disagree, agree, strongly agree; score = 1 to 5, respectively bAnswer choices: Almost never, 1–2 times/week, 3–4 times/week, 5–6 times/week, every day; score = 1 to 5, respectively c
The sample size for the Physical Activity Environment Outside the Home (Yard) items was 48 for researcher, 48 for parent, and 44 for parent retest because 2 individuals did not have space outside their home and 4 did not take the survey online
d
Answer choices: 0 to 2 = 1, 3 to 4 = 2, 5 to 6 = 3, 7 to 8 = 4,≥9 = 5 e
Answer choice: 1 = No dog or Almost never walk/play with dog, 2 = 1 or 2 times a week walk/play with dog, 3 = 3 to 4 times a week walk/play with dog, 4 = 5 to 6 times a week walk/play with dog, 5 = Every day walk/play with dog)
f
Answer choices: Strongly disagree, disagree, neither agree nor disagree, agree, strongly agree, don’t know; score = 1 to 5, respectively and items with“don’t know”answers were omitted from score
g
n= 47 because 1 parent did not respond to this item at the home visit 1 and another 2 parents did not complete the survey online (retest) h
Phase 8 design
The phase 8 field test had two parts. In part one, two trained researchers visited the homes of participants. Participants were asked to make no changes to their home environments prior to the visit. During the home visit, researchers and parents simultaneously, but inde-pendently, assessed the physical and sedentary activity
environment of parents’ home environments using a
pencil and paper format. Parents completed the entire phase 8 questionnaire and researchers completed only the items that could be readily observed (see Table 2). Researchers assessed the neighborhood using online re-sources (e.g., Google Maps) and conducted visual obser-vations upon arrival into the neighborhood. To ensure uniformity and objectivity in answering items across households, researchers’ responses to the questionnaire were based on a set of specific criteria (e.g., for items re-lated to “plenty of toys”, researchers counted total toys and selected among strongly disagree to strong agree an-swer choices based on the number of toys set equivalent to the answer choice).
The purpose of part one in phase 8 was to allow re-searchers to serve as the “gold standard”or comparison for parent responses in order to establish criterion valid-ity of the questionnaire. In part two of the study, parents completed the questionnaire two weeks later using an online format. The purpose of part two (re-test) was to compare parent responses with part one (test) responses to determine test-retest reliability of the questionnaire. Parents were compensated $20 for completing part one and $30 for part two of the study.
Phase 8 data analysis
Data were analyzed with IBM SPSS Statistics 22.0 (SPSS, Chicago, IL). For part 1 of phase 8, mixed effects with consistency agreement intraclass correlation coefficients (ICC) between each item completed by parents and re-searchers at the home visit were calculated to assess cri-terion validity. Additionally, independent t-tests between researcher and parent scores were conducted to assess significant differences of survey items. To determine test-retest reliability (phase 8, part 2), parents completed the questionnaire independently during the home visit (test) and again 2 weeks later (re-test) as an online sur-vey. Significance was set at P< 0.05. ICCs for the test and re-test responses were calculated for each item to determine agreement. Paired t-tests were conducted to determine whether significant differences occurred be-tween test and re-test responses. Internal consistency for all scales of the parent re-test online survey was assessed using Cronbach’s alpha. For all ICCs, agreement of data was assigned ratings using guidelines proposed by Shrout’s cut-off points (i.e., ICC < 0.10 = virtually none,
0.11–0.40 = slight, 0.41–0.60 = fair, 0.61–0.80 = moderate, 0.81–1.0 = substantial) [43].
Phase 9
This phase commenced after refining the HOP-Up ques-tionnaire using phase 8 results. Phase 9 served to establish scale unidimensionality, internal consistency, and conver-gent validity of the refined HOP-Up questionnaire.
Phase 9 sample
In phase 9 (spring 2014 to summer 2015), parents of preschool children were recruited via electronically mailed announcements, and verbal recruitment efforts to participate in the HomeStyles healthy family living intervention. Eligible parents were between the ages of 20 and 45 years and had at least one preschool child.
Phase 9 design
Phase 9 data were collected via an online cross-sectional survey. Parents that consented and completed the entire baseline assessment survey online were compensated $15.
The survey included the HOP-Up questionnaire, as well as scales assessing physical activity behaviors and cognitions. Physical activity was assessed by a physical activity index for the parent and their preschool child that was built on the activity categories (i.e., vigorous, moderate, and walking) defined by the International Physical Activity Questionnaire [44]. This index is based on the days per week (0 to 7 days) vigorous activities (e.g., heavy lifting, digging, aerobics; activities that make an individual sweat or breathe a lot harder than usual), moderate activities (e.g., carrying light loads, bicycling at a regular pace; activities that make an individual sweat or breathe a little harder than usual), and walking for at least 10 min at a time are completed [45]. The index score is calculated as follows: (#days/week of vigorous activities × 3) + (# days/week of moderate activities × 2) + (# days/week of walking ≥10 min at a time). Vigorous activity is weighted higher than other types of activities given differences in calorie expenditure of these activ-ities. Possible score range is 0 to 42 with higher scores indicating greater physical activity.
for self, physical activity for child, and not modeling sed-entary behaviors and more positive outcomes expected from engaging in physical activity. The fifth scale mea-sured the frequency with which parents modeled moder-ate and vigorous physical activity for their child. Responses to this 2-item scale were on a 7-point scale ranging from almost never to everyday [25–27, 31]. Items were averaged for an overall score with higher scores indicating greater frequency of modeling physical activity for their preschool children. The survey also captured total parent screen time daily and amount of screen time parents permitted preschool children to have daily (i.e., TV/movie time, sedentary computer/ media device time, and active video game time).
Phase 9 data analysis
A split-half cross validation procedure was conducted by randomly splitting the sample into exploratory and con-firmatory factor analysis halves using the random selec-tion procedure in SPSS 22.0 (SPSS, Chicago, IL). Exploratory factor analysis was performed via iterative Principal Components Analysis with varimax rotation (orthogonal) and Kaiser normalization, and commenced with all items included. Factor loadings were examined after each analysis with one item at a time being re-moved in an iterative fashion. Items were retained based on factor loading strength (i.e., ≥0.4), not cross loading (i.e., cross loading defined as loading on >1 factor within <0.2 of each other), and whether the strongest loading made contextual sense with regard to other items strongly loading on the same factor [46]. This process was repeated until each remaining item was contextually similar to other items strongly loading on the same fac-tor, total number of factors were in agreement with the sharpest turn in the slope of the scree plot, factor eigen values exceeded 1, and each factor generated an accept-able Cronbach’s alpha coefficient.
In the confirmatory factor analysis, the final factors remaining in the exploratory factor analysis were subjected to the same factor analysis procedures used as in the exploratory factor analysis to confirm the unidimensionality of the scale items. Cronbach’s alpha coefficients of internal consistency were calculated for each factor in the confirmatory analysis and for the combined split-half samples. To establish convergent validity, Spearman rank-order correlations were con-ducted to compare HOP-Up scales with physical activity behavior and cognitions as well as screen time measures.
Phase 10
A final expert review of the factor solutions generated in phase 9 was conducted in Fall 2015 to confirm scale content validity. Five experts in tests and measurements,
physical activity, and community-based obesity preven-tion programs conducted this review.
Results and discussion
Phase 8 field test
A total of 128 parents responded to recruitment notices for the phase 8 field test, with 104 completing the eligi-bility screener. Of those, 97 were eligible; parents living within 30 miles of the study site (n= 67) were invited to participate and the remainder (n= 30) were placed on a waiting list. Home visits were scheduled as soon as eli-gible parents accepted the participation invitation until the study quota of 50 homes was reached. Home visits took a maximum of 45 min to complete. Participants were mainly non-Hispanic, white (71 %) or Hispanic (19 %), female (94 %), had completed at least some col-lege (90 %), and were overweight or obese (48 %).
A comparison of parent and researcher responses to each item on the Physical Activity Environment Inside the Homescale revealed ICCs ranging from 0.29 to 0.59, indicating slight to fair agreement (see Table 2). Re-searcher and parent scores did not differ significantly for any item, except the item assessing how easy it is for child to see and reach stored indoor equipment for ac-tive play.
A comparison of thePhysical Activity Environment in the Area Immediately Outside the Home (Yard) items showed slight to substantial agreement between parents and researchers (range = 0.22 to 0.86). Researcher mean scores for two items related to equipment and toys to support active play outside were significantly lower than parents whereas researcher scores for the item related to outdoor clothing and shoes was significantly higher than parent scores.
Researcher and parent score ICCs for thePhysical Ac-tivity Environment in the Neighborhood items showed fair to substantial agreement (range = 0.48 to 0.81). There were no significant differences between researcher and parent scores for any of the items, except for one item where researchers scored significantly (p< 0.05) higher on rating whether there are free or low-cost recreation centers or other indoor places for kids to play compared to parents.
In part 2 of phase 8, ICCs for all physical activity items ranged from fair to substantial agreement between par-ent responses at both time points (tesretest). Paired t-tests indicated few significant differences between test and retest scores (see Table 2).
that were given to researchers may have been incongru-ent with parincongru-ent perceptions. For instance, parincongru-ent scores for two items on the Availability of Space & Supports Outside(Yard) (“The yard or area outside our home has plenty of swings…”and “My child has plenty of toys for playing…”) were significantly higher than researchers, suggesting that perceptions of what constitutes “plenty” to parents differed from instructions given to re-searchers. Phrasing of these items was reviewed and six items were revised to increase clarity. Five items associ-ated with the ease with which children can actively play without adult help and access play supports were deleted because they were highly correlated with frequency of play items, which are proxies for ease of access and in-dependent play. Another item on availability of low-cost recreation centers for kids to play actively also was de-leted as it was significantly highly correlated with the frequency of going to these low-cost recreation facilities for indoor play.
Phase 9 establishing scale unidimensionality, internal consistency, convergent validity, and readability
A total of 655 parents completed the refined HOP-Up questionnaire and were randomly split into two groups: 327 for exploratory factor analysis and 330 for confirma-tory factor analysis. Participants were mostly non-Hispanic, white (60 %) or Hispanic (21 %), in their 30’s (age 32.63 ± 5.70SD years), female (92 %), and nearly half had a college degree. There were no significant sociode-mographic differences between the exploratory and con-firmatory factor analysis participants.
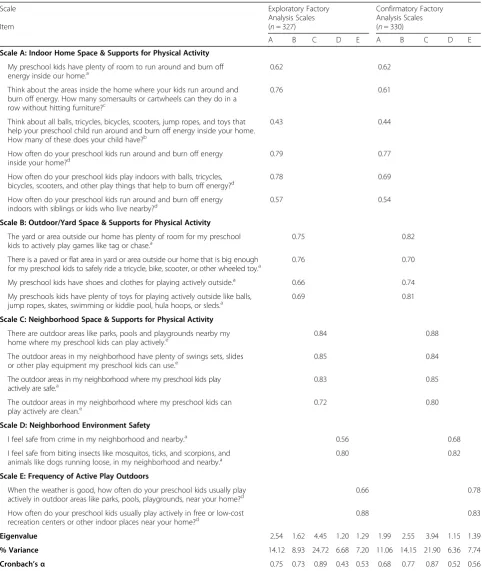
The item related to frequency of playing with the fam-ily dog was eliminated from analysis prior to beginning exploratory factor analysis because a substantial number of participants (55 %) did not have a dog. Exploratory factor analysis indicated that 9 items did not meet the criteria for retention described in Data Analysis. As shown in Table 3, the final exploratory factor analysis results revealed a five factor solution, supported eigen values, scree plots, a review for contextual sense, and the confirmatory factor analysis. The 18 items in the five factor solution had loadings ranging from 0.43 to 0.88 for the exploratory factor analysis and 0.44 to 0.88 for the confirmatory factor analysis.
Five scales were identified from this five factor solution and renamed to more adequately reflect the item content of each scale. The Indoor Home Space & Supports for Physical Activity scale has 6-items that assesses the space available inside the home for active play, supports for physical activity inside, and frequency of use. The 4-item Outdoor/Yard Space & Supports for Physical Activityscale assesses space and supports avail-able immediately outside the home (yard) for active play. TheNeighborhood Space & Supports for Physical Activity
scale has 4-items that assess neighborhood active play space and supports. The 2-item, Neighborhood Environ-ment Safety scale assesses perceived environmental safety of active play in the neighborhood. The 2-item Frequency of Active Play Outdoors scale assesses how often preschool kids play actively in outdoor areas and in nearby recreation centers or other indoor areas. All items are scored using a 5-point Likert scale (strongly disagree to strongly agree), except frequency of use items which have a 5-point scale ranging from almost never to everyday. The Neighborhood Space & Supports for Phys-ical Activityscale also has a“don’t know”answer option in case parents are not aware of neighborhood resources. Scale scores are calculated by averaging responses to all items in the scale, except “don’t know” answers which are not scored or averaged in scale scores. Internal consistency measured by Cronbach’s alpha was good for three scales and, given their brevity, acceptable for the two-item scales.
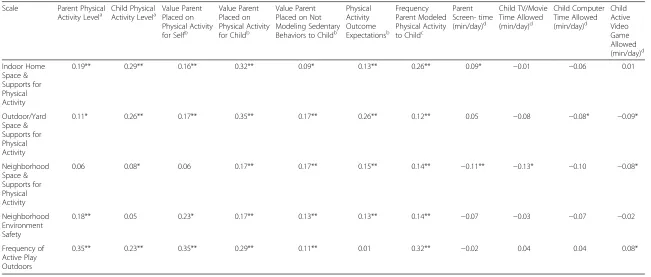
Spearman rank-order correlations were conducted to compare scale scores with physical activity behavior and cognitions, and screen time to establish convergent val-idity. There were significant positive correlations among nearly all scale scores and parent and child physical ac-tivity levels, value parents placed on physical acac-tivity for self and child, importance parents placed on not model-ing sedentary behaviors, physical activity outcome ex-pectations, and frequency that parents modeled physical activity (Table 4). These strong, positive correlations among behaviors and cognitions and the five scales indi-cate strong convergent validity of the HOP-Up. Add-itionally, there were significant negative correlations of parent and child screen time (minutes/day) with a few of the HOP-Up scales such as Neighborhood Space & Sup-ports for Physical Activity and Outdoor/Yard Space & Supports for Physical Activity indicating convergent validity.
Assessment of readability grade level using the Flesch-Kincaid statistic indicated an 8th grade reading level of this 18-item measure. Thus, the HOP-Up questionnaire is readable and understandable by a large proportion of the population, but caution should be exercised when using with lower literacy populations.
Phase 10 final expert review
Table 3Factor loadings from the exploratory and confirmatory factory analysis of the HOP-Up physical activity environment questionnaire
Scale Exploratory Factory
Analysis Scales
Confirmatory Factory Analysis Scales
Item (n= 327) (n= 330)
A B C D E A B C D E
Scale A: Indoor Home Space & Supports for Physical Activity
My preschool kids have plenty of room to run around and burn off
energy inside our home.a 0.62 0.62
Think about the areas inside the home where your kids run around and burn off energy. How many somersaults or cartwheels can they do in a row without hitting furniture?c
0.76 0.61
Think about all balls, tricycles, bicycles, scooters, jump ropes, and toys that help your preschool child run around and burn off energy inside your home. How many of these does your child have?b
0.43 0.44
How often do your preschool kids run around and burn off energy inside your home?d
0.79 0.77
How often do your preschool kids play indoors with balls, tricycles,
bicycles, scooters, and other play things that help to burn off energy?d 0.78 0.69 How often do your preschool kids run around and burn off energy
indoors with siblings or kids who live nearby?d
0.57 0.54
Scale B: Outdoor/Yard Space & Supports for Physical Activity
The yard or area outside our home has plenty of room for my preschool
kids to actively play games like tag or chase.a 0.75 0.82
There is a paved or flat area in yard or area outside our home that is big enough for my preschool kids to safely ride a tricycle, bike, scooter, or other wheeled toy.a
0.76 0.70
My preschool kids have shoes and clothes for playing actively outside.a 0.66 0.74
My preschools kids have plenty of toys for playing actively outside like balls,
jump ropes, skates, swimming or kiddie pool, hula hoops, or sleds.a 0.69 0.81
Scale C: Neighborhood Space & Supports for Physical Activity
There are outdoor areas like parks, pools and playgrounds nearby my home where my preschool kids can play actively.e
0.84 0.88
The outdoor areas in my neighborhood have plenty of swings sets, slides
or other play equipment my preschool kids can use.e 0.85 0.84
The outdoor areas in my neighborhood where my preschool kids play actively are safe.a
0.83 0.85
The outdoor areas in my neighborhood where my preschool kids can
play actively are clean.e 0.72 0.80
Scale D: Neighborhood Environment Safety
I feel safe from crime in my neighborhood and nearby.a 0.56 0.68
I feel safe from biting insects like mosquitos, ticks, and scorpions, and animals like dogs running loose, in my neighborhood and nearby.a
0.80 0.82
Scale E: Frequency of Active Play Outdoors
When the weather is good, how often do your preschool kids usually play
actively in outdoor areas like parks, pools, playgrounds, near your home?d 0.66 0.78
How often do your preschool kids usually play actively in free or low-cost recreation centers or other indoor places near your home?d
0.88 0.83
Eigenvalue 2.54 1.62 4.45 1.20 1.29 1.99 2.55 3.94 1.15 1.39
% Variance 14.12 8.93 24.72 6.68 7.20 11.06 14.15 21.90 6.36 7.74
Cronbach’sα 0.75 0.73 0.89 0.43 0.53 0.68 0.77 0.87 0.52 0.56
a
Answer choices: Strongly disagree, disagree, neither agree nor disagree, agree, strongly agree; score = 1 to 5, respectively b
Number of toys scored 1 = 0 to 4, 2 = 5 to 10, 3 = 11 to 15, 4 = 16 to 20, 5= >20 c
Number of somersaults scored 1 = <2, 2 = 2, 3 = 3, 4 = 4 to 5, 5= >5 somersaults
dAnswer choices: Almost never, 1–2 times/week, 3–4 times/week, 5–6 times/week, every day; score = 1 to 5, respectively e
Table 4Spearman rank-order correlations of HOP-Up questionnaire scales and physical activity level and cognitions (N= 655)
Scale Parent Physical
Activity Levela Child PhysicalActivity Levela Value ParentPlaced on
Physical Activity for Selfb
Value Parent Placed on Physical Activity for Childb
Value Parent Placed on Not Modeling Sedentary Behaviors to Childb
Physical Activity Outcome Expectationsb
Frequency Parent Modeled Physical Activity to Childc
Parent Screen- time (min/day)d
Child TV/Movie Time Allowed (min/day)d
Child Computer Time Allowed (min/day)d
Child Active Video Game Allowed (min/day)d
Indoor Home Space & Supports for Physical Activity
0.19** 0.29** 0.16** 0.32** 0.09* 0.13** 0.26** 0.09* −0.01 −0.06 0.01
Outdoor/Yard Space & Supports for Physical Activity
0.11* 0.26** 0.17** 0.35** 0.17** 0.26** 0.12** 0.05 −0.08 −0.08* −0.09*
Neighborhood Space & Supports for Physical Activity
0.06 0.08* 0.06 0.17** 0.17** 0.15** 0.14** −0.11** −0.13* −0.10 −0.08*
Neighborhood Environment Safety
0.18** 0.05 0.23* 0.17** 0.13** 0.13** 0.14** −0.07 −0.03 −0.07 −0.02
Frequency of Active Play Outdoors
0.35** 0.23** 0.35** 0.29** 0.11** 0.01 0.32** −0.02 0.04 0.04 0.08*
*p< 0.05 **p< 0.01
a
Physical activity level assessed using 3-items adapted from the International Physical Activity Questionnaire45(possible score range 0 to 42)
b
Responses were on 5-point Likert scales ranging from strongly disagree to strongly agree. Higher scores indicate greater importance placed on physical activity for self, physical activity for child, and not modeling sedentary behaviors, or more positive outcome expectations associated with engaging in physical activity
c
Responses were on a 7-point scale ranging from almost never to everyday. Items are averaged for an overall score; higher scores indicate greater frequency of modeling physical activity for child
d
Responses of parent and child screen time are from parent reports in minutes per day
Internationa
lJournal
of
Behavioral
Nutrition
and
Physical
Activity
(2016) 13:91
Page
11
of
co-play into other active play support items should be considered for inclusion in the Outdoor/Yard Space & Supports for Physical Activityscale.
Experts also recognized that even though the item re-lated to availability of active play video games (games that are played standing up and require lots of moving) was eliminated during factor analysis, the availability of this active play support could be captured in the item re-lated to toys available for active play indoors. Similarly, the wheeled toy availability and swings and slides avail-ability items from thePhysical Activity Environment Im-mediately Outside the Home(Yard) scale was eliminated in factor analysis, but these concepts could be incorpo-rated in the toys supporting active outdoor play item that was retained.
The neighborhood environment safety items related to traffic and crowding were deleted during factor analysis, which experts found somewhat surprising given that nu-merous studies have reported that high traffic areas and crowded conditions are negatively correlated with phys-ical activity level [21, 48]. However, recent research has found little evidence supporting the associations of per-ceived crime-related safety with physical activity in other countries [49]. It may be that concepts of traffic and crowding are captured in frequency of use items in that if these conditions exist, engagement in physical activity outdoors may be curtailed and vice versa.
The frequency of indoor play, active play with siblings or playmates, and use of neighborhood recreation cen-ters items also seemed to account for the deletion of items related to limits put on indoor play (Accessibility Inside the Home), availability of siblings and playmates (Availability of Space & Supports Inside the Home), and recreation center availability (Availability of Space & Supports in the Neighborhood) items, respectively. That is, if limits are set, siblings/playmates are unavailable, and recreation centers are unavailable, the frequency of play would decline and vice versa. The migration of two items related to outdoor areas being safe and outdoor areas being clean from Neighborhood Access & Safetyin phase 8 to theNeighborhood Space & Supports for Phys-ical Activityin phase 9 suggests parents perceive“clean” and “safe” as components of neighborhood space and supports. Similarly, the elimination of the item related to outdoor play near the home (Frequency of Outside Home Play) yet retention of the analogous version of this item from the Frequency of Neighborhood Active Play scale suggests that the location of outdoor play (yard vs. neighborhood area) is less important than the concept of play taking place outdoors.
It was not surprising that the item asking parents to estimate outdoor play space availability in terms of parking space equivalents performed poorly with low agreement between researcher and participant, and was
subsequently eliminated in the factor analysis. Although both parents and researchers indicated outdoor areas for
active play were equivalent to about 9–10 parking
spaces, the parking spaces estimation item required spatial abilities, such as spatial perception, mental rota-tion, and spatial visualizarota-tion, which are known to have significant sex differences that favor men [50]. Given parents in this study were predominantly women, they may have had poor skills for this task. Nonetheless, methods that result in accurate play area estimates with-out imposing participant burden of taking actual mea-surements should continue to be explored (e.g., the number of giant steps parents can take along the edges of the play area). It also may be that availability of play space above a certain dimension has a saturation point at which it is “big enough” to accommodate active play correlated with preschool child activity.
Conclusions
This is the first study, to our knowledge, to develop a brief, easy-to-use, self-report, comprehensive question-naire to evaluate the physical activity space, supports, and frequency of use in and near homes with preschool children and report the extensive, rigorous testing of its psychometric properties. Overall, the reliability and val-idity of the HOP-Up questionnaire are good. However, study findings are limited in that phase 8 field test par-ticipants were mostly female, white, had completed at least some college and lived in the same geographical lo-cation. Even though participants in phase 9 were more diverse, they may not be representative of all parents with preschool-aged children due to self-selection biases and limited geographical representation. Further re-search is needed to replicate the study findings in a more nationally representative population. Additionally, future studies should assess the construct validity of this measure by examining relationships of the HOP-Up to objective measures of weight status [25], such as body mass index (BMI), waist circumference, and percent body fat of parents and BMI-for-age z-scores of children, and objective physical activity measures such as pedom-eters or accelerompedom-eters.
validity (content, face, criterion, convergent) and reliability (test-retest and internal consistency). The development and evaluation of this measure provides researchers with a new tool that may be useful in benchmarking and tracking change in the physical activity environments of families with preschool-aged children. This brief, easy-to use, valid, reliable questionnaire also may help parents identify simple changes they can make to their home environments that promote more physical activity in their preschool-aged children, thereby helping prevent childhood obesity. Add-itionally, the HOP-Up may be useful for residential planners and city councils when designing, developing, and modifying neighborhoods to promote increased physical ac-tivity. Future research is needed to replicate these study findings and strengthen the use and applicability of this measure in obesity prevention interventions and programs.
Acknowledgements Not applicable.
Funding
This study is funded by the United States Department of Agriculture, National Institute of Food and Agriculture, Grant Number 2011-68001-30170.
Availability of data and materials
The dataset supporting the conclusions of this article and instrument are available from the corresponding author upon request.
Authors’contributions
CC, JMB, KS, and CBB designed the study and contributed to the development and implementation of the study. VQ conducted the analysis and interpretation of the data with the assistance of CC and CBB. KS, CC, and VQ drafted the manuscript and all authors contributed to editing and reviewing the final manuscript. All authors have read and approved the final manuscript.
Authors’information
CC and JMB are graduate students, VQ and KS are research associates, and CB is professor and extension specialist.
Competing interests
The authors declare that they have no competing interests.
Consent for publication Not applicable.
Ethics approval and consent to participate
The Rutgers University Institutional Review Board approved this study and written consent for participation was obtained from all study participants.
Author details
1Rutgers, The State University of New Jersey, 26 Nichol Avenue, New Brunswick, NJ 08901, USA.2Kean University, 1000 Morris Ave, Union, NJ 07083, USA.
Received: 1 March 2016 Accepted: 2 August 2016
References
1. Centers for Disease Control and Prevention. State Indicator Report on Physical Activity. Atlanta, GA: U.S. Department of Health and Human Services; 2014.
2. Rosenberg D, Ding D, Sallis JF, Kerr J, Norman GJ, Durant N, et al. Neighborhood Environment Walkability Scale for Youth (NEWS-Y): Reliability and relationship with physical activity. Prev Med. 2009;49(2–3):213–8.
3. Bandura A. Social cognitive theory. In: Vasta R. Greenwich, CT, edutirs. Six theories of child development. Volume Annals of child development. Vol. 6, edn. Greenwich: JAI Press; 1989. p.1–60.
4. State Indicator Report on Physical Activity, 2010. http://www.cdc.gov/ physicalactivity/downloads/PA_State_Indicator_Report_2010.pdf. Accessed 15 Feb 2016.
5. Irwin JD, He M, Bouck LMS, Tucker P, Pollett GL. Preschoolers’Physical Activity Behaviours: Parents’Perspectives. In: Canadian Public Health Association; 2005. p. 299.
6. Rideout V, Hamel E. The Media Family: Electronic Media in the Lives of Infants, Toddlers, Preschoolers, and Their Parents. Menlo Park, CA: The Henry J. Kaiser Family Foundation; 2006.
7. Tandon PS, Zhou C, Lozano P, Christakis DA. Preschoolers’total daily screen time at home and by type of child care. J Pediatr. 2011;158(2):297–300. 8. Weir LA, Etelson D, Brand DA. Parents’perceptions of neighborhood safety
and children’s physical activity. Prev Med. 2006;43(3):212–7.
9. Sisson S, Broyles S, Baker B, Katzmarzyk P. Screen time, physical activity, and overweight in U.S. youth: National Survey of Children’s Health 2003. J Adolesc Health. 2010;47(3):309–11.
10. Zimmerman FJ, Bell JF. Associations of television content type and obesity in children. Am J Public Health. 2010;100(2):334–40.
11. Robinson TN. Television viewing and childhood obesity. Pediatr Clin North Am. 2001;48(4):1017–25.
12. Reilly JJ. Physical activity, sedentary behaviour and energy balance in the preschool child: opportunities for early obesity prevention. Proc Nutr Soc. 2008;67(3):317–25.
13. Reilly JJ, Armstrong J, Dorosty AR, Emmett PM, Ness A, Rogers I, et al. Early life risk factors for obesity in childhood: cohort study. BMJ. 2005;330(7504): 1357–63.
14. Strasburger VC, Mulligan DA, Altmann TR, Brown A, Christakis DA, Clarke-Pearson K, et al. Media: Children, Adolescents, Obesity, and the Media. Pediatr. 2011;128(1):201–8.
15. Dubois L, Farmer A, Girard M, Peterson K. Social factors and television use during meals and snacks is associated with higher BMI among pre-school children. Public Health Nutr. 2008;11(12):1267–79.
16. Rosenberg D, Sallis J, Kerr J, Maher J, Norman G, Durant N, et al. Brief scales to assess physical activity and sedentary equipment in the home. Int J Behav Nutr Phys Act. 2010;7(1):10.
17. Bingham D, Costa S, Hinkley T, Shire K, Clemes S, Barber S: Physical activity during the early years: A systematic review of correlates and determinants. Am J Prev Med. 2016;In Press.
18. Hinkley T, Crawford D, Salmon J, Okely A, Hesketh K. Preschool children and physical activity: A review of correlates. Am J Prev Med. 2008;34(5):435–41. 19. Sallis J, Prochaska J, Taylor W. A review of correlates of physical activity of
children and adolescents. Med Sci Sports Exer. 2000;32(5):963–75. 20. Sirard J, Nelson M, Pereira M, Lytle L. Validity and reliability of a home
environment inventory for physical activity and media equipment. Int J Behav Nutr Phys Act. 2008;5(1):24.
21. Sallis JF, Bowles HR, Bauman A, Ainsworth BE, Bull FC, Craig CL, et al. Neighborhood Environments and Physical Activity Among Adults in 11 Countries. Am J Prev Med. 2009;36(6):484–90.
22. Timperio A, Crawford D, Telford A, Salmon J. Perceptions about the local neighborhood and walking and cycling among children. Prev Med. 2004; 38(1):39–47.
23. Burdette HL, Wadden TA, Whitaker RC. Neighborhood safety, collective efficacy, and obesity in women with young children. Obesity. 2006;14(3): 518–25.
24. D’Haese S, De Meester F, De Bourdeaudhuij I, Deforche B, Cardon G. Criterion distances and environmental correlates of active commuting to school in children. Int J Behav Nutr Phys Act. 2011;8(1):88.
25. Bryant MJ, Ward DS, Hales D, Vaughn A, Tabak RG, Stevens J. Reliability and validity of the Healthy Home Survey: A tool to measure factors within homes hypothesized to relate to overweight in children. Int J Behav Nutr Phys Act. 2008;5:23.
26. Earls FJ, Brooks-Gunn J, Raudenbush SW, Sampson RJ. Project on Human Development in Chicago Neighborhoods (PHDCN): Home and Life Interview, Wave 2, 1997–2000. In: Inter-university Consortium for Political and Social Research (ICPSR) distributor]; 2005.
28. Hales D, Vaughn A, Mazzucca S, Bryant M, Tabak R, McWilliams C, et al. Development of HomeSTEAD’s physical activity and screen time physical environment inventory. Int J Behav Nutr Phys Act. 2013;10(1):132. 29. Leventhal T, Selner-O’Hagan MB, Brooks-Gunn J, Bingenheimer JB, Earls FJ.
The Homelife Interview from the Project on Human Development in Chicago Neighborhoods: Assessment of Parenting and Home Environment for 3- to 15-Year-Olds. Parenting. 2004;4(2–3):211–41.
30. Salmon J, Telford A, Crawford D. The Children’s Leisure Activities Study. Summary Report. Melbourne: Centre for Physical Activity and Nutrition Research, Deakin University; 2004.
31. Spurrier NJ, Magarey AA, Golley R, Curnow F, Sawyer MG. Relationships between the home environment and physical activity and dietary patterns of preschool children: A cross-sectional study. Int J Behav Nutr Phys Act. 2008;5:31. 32. Salmon J, Timperio A, Telford A, Carver A, Crawford D. Association of
Family Environment with Children’s Television Viewing and with Low Level of Physical Activity. Obes Res. 2005;13(11):1939–51.
33. Sirard J, Laska M, Patnode C, Farbakhsh K, Lytle L. Adolescent physical activity and screen time: associations with the physical home environment. Int J Behav Nutr Phys Act. 2010;7(1):82.
34. Telford A, Salmon J, Jolley D, Crawford D. Reliability and Validity of Physical Activity Questionnaires for Children: The Children’s Leisure Activities Study Survey (CLASS). Pediatr Exerc Sci. 2004;16(1):64–78. 35. Boles RE, Scharf C, Stark LJ. Developing a treatment program for obesity in
preschool-age children: Preliminary data. Children’s Health Care. 2010;39(1):34–58. 36. Sallis JF, Prochaska JJ, Taylor WC, Hill JO, Geraci JC. Correlates of physical
activity in a national sample of girls and boys in Grades 4 through 12. Health Psychol. 1999;18(4):410–5.
37. Trost SG, Sallis JF, Pate RR, Freedson PS, Taylor WC, Dowda M. Evaluating a model of parental influence on youth physical activity. Am J Prev Med. 2003;25(4):277–82.
38. Vest J, Valadez A. Perceptions of neighborhood characteristics and leisure-time physical inactivity - Austin/Travis County, Texas, 2004. MMWR Morb Mortal Wkly Rep. 2005;54(37):926–8.
39. Bradburn N, Sudman S, Wansink B. Asking Questions. San Francisco, Ca: Jossey-Bass; 2004.
40. Schwarz N, Oyserman D. Asking Questions About Behavior: Cognition, Communication, and Questionnaire Construction. Am J Eval. 2001;22(2):127–60. 41. Redding CA, Maddock JE, Rossi JS. The sequential approach to
measurement of health behavior constructs: Issues in selecting and developing measures. Californian J Health Promot. 2006;4(1):83–101. 42. Willis G: Cognitive interviewing. A tool for improving questionnaire design.
Thousand Oaks: Sage Publishing, Inc.; 2005.
43. Shrout P, Fleiss J. Intraclass correlations: uses in assessing rater reliability. Psychol Bull. 1979;86:420–8.
44. Booth M. Assessment of physical activity: An international perspective. Res Q Exer Sport. 2000;7(2):s114–20.
45. Quick V, Byrd-Bredbenner C, White A, Brown O, Colby S, Shoff S et al.: A streamlined enhanced self-report physical activity measure for young adults. Int J Health Promot Educ. 2016:In Press.
46. Young A, Pearce S. A beginner’s guide to factor analysis: Focusing on exploratory factor analysis. Tutor Quant Methods Psychol. 2013;9(2):79–94. 47. Byers CG, Wilson CC, Stephens MB, Goodie JL, Netting FE, Olsen CH.
Owners and Pets Exercising Together: Canine Response to Veterinarian-Prescribed Physical Activity. Anthrozoös. 2014;27(3):325–33.
48. Adams M, Ding D, Sallis J, Bowles H, Ainsworth B, Bergman P, et al. Patterns of neighborhood environment attributes related to physical activity across 11 countries: a latent class analysis. Int J Behav Nutr Phys Act. 2013;10:34. 49. Ding D, Adams M, Sallis J, Norman G, Hovell M, Chambers C, et al.
Perceived neighborhood environment and physical activity in 11 countries: Do associations differ by country. Int J Behav Nutr Phys Act. 2013;10:57. 50. Voyer D, Voyer S, Bryden M. Magnitude of sex differences in spatial abilities:
A meta-analysis and consideration of critical abilities. Psychol Bull. 1995; 117(2):250–70.
• We accept pre-submission inquiries
• Our selector tool helps you to find the most relevant journal • We provide round the clock customer support
• Convenient online submission • Thorough peer review
• Inclusion in PubMed and all major indexing services • Maximum visibility for your research
Submit your manuscript at www.biomedcentral.com/submit