R E S E A R C H
Open Access
Plate size and food consumption: a
pre-registered experimental study in a general
population sample
Daina Kos
ī
te
1, Laura M. König
1,2, Katie De-loyde
3, Ilse Lee
1, Emily Pechey
1, Natasha Clarke
1, Olivia Maynard
3,
Richard W. Morris
5, Marcus R. Munafò
3,4, Theresa M. Marteau
1, Paul C. Fletcher
6and Gareth J. Hollands
1*Abstract
Background:There is considerable uncertainty regarding the impact of tableware size on food consumption. Most existing studies have used small and unrepresentative samples and have not followed recommended procedures for randomised controlled trials, leading to increased risk of bias. In the first pre-registered study to date, we examined the impact on consumption of using larger versus smaller plates for self-served food. We also assessed impact on the underlying meal micro-structure, such as number of servings and eating rate, which has not previously been studied.
Methods:The setting was a purpose-built naturalistic eating behaviour laboratory. A general population sample of 134 adult participants (aged 18–61 years) was randomly allocated to one of two groups varying in the size of plate used for self-serving lunch: large or small. The primary outcome was amount of food energy (kcal) consumed during a meal. Additionally, we assessed impact on meal micro-structure, and examined potential modifying effects of executive function, socio-economic position, and sensitivity to perceptual cues.
Results:There was no clear evidence of a difference in consumption between the two groups: Cohen’sd= 0.07 (95% CI [−0.27, 0.41]), with participants in the large plate group consuming on average 19.2 (95% CI [−76.5, 115.0]) more calories (3%) compared to the small plate group (large:mean(SD) = 644.1 (265.0) kcal, versus small: 624.9 (292.3) kcal). The difference between the groups was not modified by individual characteristics. There was no evidence of impact on meal micro-structure, with the exception of more food being left on the plate when larger plates were used.
Conclusions:This study suggests that previous meta-analyses of a low-quality body of evidence may have considerably overestimated the effects of plate size on consumption. However, the possibility of a clinically significant effect–in either direction–cannot be excluded. Well-conducted trials of tableware size in real-world field settings are now needed to determine whether changing the size of tableware has potential to contribute to efforts to reduce consumption at population-level.
Trial registration:The study protocol (https://osf.io/e3dfh/) and data analysis plan (https://osf.io/sh5u7/) were pre-registered on the Open Science Framework.
Keywords:Plate size, Food consumption, Choice architecture, Nudging, Physical micro-environment
© The Author(s). 2019Open AccessThis article is distributed under the terms of the Creative Commons Attribution 4.0 International License (http://creativecommons.org/licenses/by/4.0/), which permits unrestricted use, distribution, and reproduction in any medium, provided you give appropriate credit to the original author(s) and the source, provide a link to the Creative Commons license, and indicate if changes were made. The Creative Commons Public Domain Dedication waiver (http://creativecommons.org/publicdomain/zero/1.0/) applies to the data made available in this article, unless otherwise stated. * Correspondence:[email protected]
1Behaviour and Health Research Unit, University of Cambridge, Cambridge,
UK
Introduction
If people consumed less food and energy it would help to prevent weight gain and reduce the global burden of non-communicable diseases such as cardiovascular dis-ease, cancer, and type 2 diabetes [1] which cause a large proportion of deaths worldwide [2]. Changing cues in our immediate physical environments that influence consumption could contribute to addressing this
prob-lem [3,4]. One such intervention that has received
con-siderable research and public attention is providing consumers with smaller tableware, such as plates or bowls, in order to reduce their intake of food. However, the likely efficacy of this action is unclear.
Recent systematic reviews and meta-analyses have reached slightly different conclusions about whether the
size of the tableware – for example, plates or bowls –
has an effect on the amount of food that is consumed. Robinson and colleagues [5] concluded that there was no consistent effect of larger plate size on food intake
(with point estimate effects ranging from −0.25 to +
0.96, and a pooled effect size estimate ofd= 0.18), while a Cochrane review of the impact of portion, package and tableware size [6] identified a small to medium
magni-tude effect of larger tableware on consumption (d=
0.29). The most recent meta-analysis by Holden, Zla-tevska, & Dubelaar [7] indicated a large effect of plate size on amount consumed when food was self-served
(d= 0.70), but little effect when portion size was held
constant and served on differently-sized plates (d= 0.03). The majority of the studies included in these systematic reviews have been assessed as being of poor quality, with the Hollands et al. [6] Cochrane review assessing all studies that manipulated tableware size as being at high or unclear risk of bias. This was due to studies not fol-lowing recommended procedural guidance for conduct-ing and reportconduct-ing randomised controlled trials, for example by failing to adequately implement randomisa-tion procedures, and conceal allocarandomisa-tion to participants and formally register study protocols. Finally, previous
studies of tableware have typically been small – with
sample sizes ranging from 18 to 68 participants in
stud-ies that measured self-served food consumption – and
conducted in samples that do not represent the general population, such as undergraduate students [7].
Furthermore, a substantial proportion of the studies common to these reviews have been conducted by re-searchers at the Cornell University Food and Brand Lab, whose work has recently been subject to scrutiny for
possible scientific misconduct [8, 9]. A number of their
studies have already been retracted or corrected, includ-ing a study concerninclud-ing tableware size [10], suggestinclud-ing the need to apply due caution to other research originat-ing from this group. Given the reproducibility concerns highlighted across the behavioural and medical sciences
in recent years, this also emphasises the need for future research to accord with principles of reproducible sci-ence, including pre-registration of protocols and statis-tical analysis plans, as well as open data [11].
In sum, there remains considerable uncertainty about the effects of plate size on food consumption, and high-quality pre-registered studies are needed to address this. Here we focused on consumption when food was self-served, as previous literature has suggested that this is where effects are most likely to be observed. The pri-mary research question for this study was therefore: What is the impact on consumption of using larger (ver-sus smaller) plates for self-serving food? In line with the weight of current review evidence, we hypothesised that using larger (versus smaller) tableware when self-serving food increases consumption of that food.
In addition, the potential mechanisms underlying any ef-fect of plate size are not well understood. In particular, to our knowledge, no studies of the effect of plate size have ex-amined possible impact on meal micro-structure–the pat-tern of behaviours that occur within an eating episode, such as number of helpings served or eating rate–that could ex-plain any observed effects on amount consumed. In explor-ing potential mechanisms, the current study also examined possible modifiers of any observed intervention effect of plate size, with a secondary research question asking whether i. executive function, ii. socio-economic position (SEP), and/oriii.Sensitivity to perceptual cues, modify the effect of plate size on consumption. It has been hypothesised that because interventions that manipulate environmental cues do not rely on people consciously engaging and form-ing intentions to change their behaviour, their effects will not be moderated by executive function, specifically re-sponse inhibition. Because executive function resources are patterned by SEP, tending to be lower in lower SEP groups [12, 13], this may also mean that SEP would not moderate the effect of such interventions (although SEP could modify these associations in other ways). The purpose of examining moderation by these two variables is therefore to give a pre-liminary indication of the intervention’s potential to change behaviour in a way that does not exacerbate health inequal-ities, as an absence of moderation would suggest the inter-vention is similarly effective in those with varying levels of cognitive resource [4,12]. Regarding sensitivity to perceptual cues, being more sensitive to external (relative to internal) cues could feasibly result in manipulations of environmental cues such as plate size having a greater impact, although to our knowledge no previous research has directly tested this.
Methods
were collected. The data analysis plan (https://osf.io/sh5 u7/) was posted prior to the completion of data collec-tion and before any inspeccollec-tion of the data.
Study design
In a two-group between-subjects design, participants were randomly allocated to self-serve lunch and eat from either a i. small or ii. large circular dinner plate. Ran-domisation was conducted by an external statistician not involved with data collection, using a random number generator. Participants’allocation to experimental condi-tion was concealed from the research team until after the participant had consented to take part in the study. The staff implementing the study procedures concerning the experimental manipulation and collection of the pri-mary outcome were employees of the eating behaviour laboratory and were not part of the study research team, although it was not possible to blind them to the ma-nipulation. Participants were blinded to the study condi-tions, and the external statistician completing the data analysis was blinded to allocation.
Sample and setting
A general population sample varying in socio-economic position (SEP) was recruited via a research agency dur-ing the study period (August to November 2018). The sample purposefully comprised similar proportions of men and women and similar proportions of participants with lower and higher education level (no Bachelor’s de-gree versus Bachelor’s degree or higher). The following
inclusion criteria were applied: age 18–60; sufficient
English and computer literacy skills to complete the study. The exclusion criteria comprised: disliking or restricting of the test foods [e.g. food allergies, vegan]; having a diagnosed eating disorder or taking prescribed medication that could considerably influence eating be-haviour; performing vigorous exercise for more than 10 h a week; active smokers. Participants were reimbursed £50 for completing the study.
Sample size was determined based on the most recent meta-analysis of tableware size and consumption [7],
using G*Power software [14]. An effect size of d= 0.50
was assumed, which is conservative relative to the esti-mate from the meta-analysis (analysis of studies of
self-served consumption produced an effect size ofd= 0.70).
With power = 0.80, and alpha = 0.05 for the effect on the primary outcome of larger versus smaller circular plates, a total sample of 128 participants was required. To ac-count for participant dropout, we planned to over-recruit by 5%, meaning 134 participants were to be randomised.
The study was conducted in the Wellcome-MRC Translational Research Facility (TRF) in Cambridge, UK, a purpose-built eating behaviour facility that includes
rooms designed to replicate eating environments in peo-ple’s homes (see Procedure for further details).
Materials
Plates
White, circular, unmarked plates with a 46% difference in surface area were used for self-serving food: Large plate: China by Denby Dinner Plate (29 cm diameter,
surface area = 660.5 cm2); Small plate: China by Denby
Dessert/Salad Plate (23 cm diameter, surface area = 415.5 cm2). The plates were purposefully selected from a product range with plain, featureless designs, and that offered both a standard dinner plate and a smaller meal plate that was otherwise identical. These plate types were chosen due to public and research interest in the potential impact on consumption of reducing the size of dinner plates.
Food
A vegetarian cheese and tomato pasta bake (150.33 kcal per 100 g) was the default food provided. If a participant was unwilling to consume it for any reason, chicken korma curried rice (129.6 kcal per 100 g), matched in nu-tritional characteristics to the pasta dish, was offered as an alternative.
Weighing balance
An A&D GX6100 6100 g × 0.01 g laboratory balance was used to weigh the study food.
Video cameras
Two cameras were used to record the eating session (Sil-verlabel Focus Action Cam Ultra HD; Go Pro Hero 3). Participants consented to being filmed within the facility although the cameras were concealed throughout.
Measures
Primary outcome: energy consumed
The amount of food consumed was measured in grams, weighing the food taken from the serving dish minus the amount of food left on the participant’s plate. This was translated into energy consumed (kcal), which is the measure used in the analysis.
Additional measures
Demographic measures: Age and gender were recorded in a study questionnaire before lunch. Weight and height were measured at the end of the study session (in order not to prime weight or diet-related concerns) to assess participants’body mass index (BMI = kg/m2).
Effect modifiers (assessed pre-intervention)
Executive function– response inhibition and impulsivity: To assess response inhibition, a stop-signal task [16] was used, in which participants are presented with an arrow within a circle that either points right or left. Partici-pants are required to press a corresponding key for each direction unless a signal is played after the presentation of the arrow. In this case, the response should be stopped before execution. Stop-signal reaction time (SSRT), measured in milliseconds (ms) refers to the time required to stop the initiated go-process, with slower SSRT indicating poorer inhibitory control. Of the wide range of neurocognitive measures that are available, stop-signal tasks have shown relatively consistent retionships with BMI and eating behaviour including la-boratory food intake [17]. Additionally, the total score of the Barratt Impulsiveness Scale (BIS-11) [18] was used to assess impulsiveness. The scale (30 items) was found to be reliable in this sample (α= 0.80).
Socio-economic position (SEP): Three different SEP measures were collected: i) highest educational qualifica-tion, ii) household income and iii) Index of Multiple Deprivation (IMD). The latter is an official measure of the relative deprivation of geographic areas in England, [19] and was assessed for each participant by their post-code; the lower the IMD number, the more deprived the area the participant lives in.
General sensitivity to perceptual cues–spatial orienta-tion ability: The Penn Line Orientaorienta-tion Test (PLOT) [20] computer task was used to assess participants’ abil-ity to orient objects in space. In each trial, participants were shown a pair of lines with different orientations and were asked to rotate a moveable line to be paral-lel to the fixed line. There are a total of 24 trials in the test, with number of correct orientations being the measure used.
Meal micro-structure
While eating, participants were filmed using two con-cealed cameras, one of which was directly pointed
to-wards the front of the participant’s chair. Two
researchers (DK and LK) independently verified the number of helpings and number of bites from the vid-eos, and interrater agreement was calculated (see Re-sults). Based on these data, the duration of the meal (time stamp of last bite minus time stamp of first bite), average bite size (total amount of food consumed di-vided by number of bites; in grams), average bite dur-ation (total durdur-ation of meal divided by number of bites; in minutes) and eating rate (number of bites divided by total duration of the meal) were calculated. Additionally, we recorded the total amount of food self-served and amount of food left on the plate.
Measure not included in the analysis
We assessed hedonic experience with a single item
ques-tion “How did you like the food?” with an answer on a
100 mm VAS [21] anchored at “not at all” and
“extremely”.
Procedure
To conceal the true purpose of the study, at the time of recruitment, participants were informed that the study was examining the impact of time of the day on a range of mental processes, and that they had been allocated to a lunchtime session. All data were collected in individual experimental sessions that took place between approxi-mately 12:00 to 14:45 to ensure similar hunger levels. Participants were instructed to consume one of three suggested breakfasts and fast for at least three hours be-fore the study session. After providing written informed consent, participants initially completed a series of
base-line measures in a testing room, including the
computer-based cognitive tasks. Participants were then guided to a lounge room with a small dining table, a chair, a sofa, bookshelves, a television showing a standar-dised nature programme, and a heated food trolley with food (see Additional file 1). Participants were presented with a large serving dish containing the food, along with a plate (as determined by random allocation) and uten-sils. Participants were told to serve themselves and con-sume as much or as little food as they wished to over a given period of 30 min, eating at their own pace and serving themselves as many times as they like. During the meal, participants were allowed to have 100 ml of water, although participants who requested more water during the meal were given an additional 100 ml. Partici-pants were on their own during the lunch and covert cameras in the room captured participants eating. Fol-lowing the allocated eating time, participants were moved to another testing room where they completed the post-intervention measures (weight, height, and questions to probe the effectiveness of the cover story) and were fully debriefed about the purpose of the study.
Data analysis
Analysis was conducted by an analyst not involved in the collection of the data and who was blinded to alloca-tion. Descriptive statistics were calculated for baseline characteristics of participants in the two plate size con-ditions. SPSS 25 software was used for data analysis.
1250 kcal and applying to five participants). Mean differ-ences and effect size (Cohen’sd) are reported alongside 95% confidence intervals (CI).
A two-way analysis of variance (ANOVA) was applied to estimate the impact of the effect modifiers (executive function, SEP and sensitivity to perceptual cues), and the interaction between plate size and each dichotomised covariate in turn. Executive function variables and sensi-tivity to perceptual cues were dichotomised at the me-dian. For SEP measures, income and Index of Multiple Deprivation (IMD) were split at the median, while high-est qualification was dichotomised as‘Bachelor’s degree-level and higher’ versus lower. Interrater agreement for meal micro-structure measures was determined using intraclass correlation coefficients (ICC) in R (version 3.5.1) with package irr (version 0.84) [22]. Mean differ-ences between groups for these measures were analysed using independent samples t-tests.
Results
Sample characteristics
A total of 134 participants consented to participate and
were randomised. Mean age was 35.9 (SD= 11.9) years.
As specified in the recruitment quotas, participants were near-equally split between men and women (49% men, 51% women, 1% other) and highest qualification (53%
had a Bachelor’s degree or higher; 47% did not have a
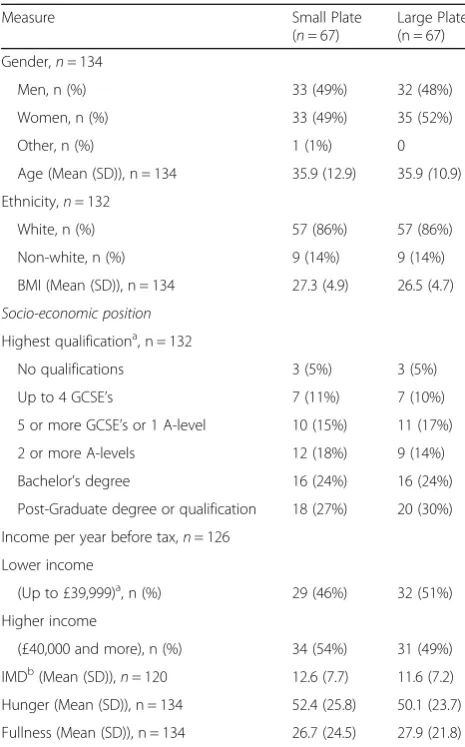
degree). See Table 1 for full participant characteristics, showing that baseline characteristics were well-balanced between groups. The primary outcome analysis used a
sample of n= 133, as primary outcome data for one of
the participants were missing due to an administrative error. No video data were available for six participants due to technical errors, so analyses for all meal micro-structure measures were conducted with a sample of
n= 127, with the exception of average bite size, which
used a sample of n= 126. Missing data points for other
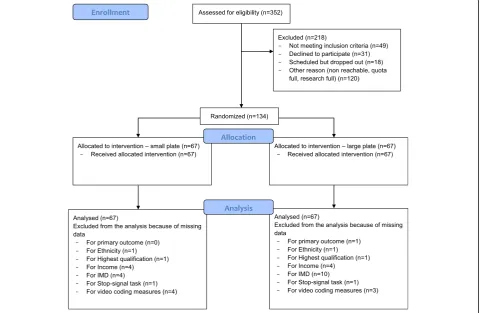
variables including effect modifiers are reported in Table 1. The study CONSORT flow diagram is provided in Fig. 1. Nearly all participants (128/134; 96%) followed the instruction to consume a suggested breakfast and fast for three hours before attendance.
Primary outcome
There was no clear evidence of a difference in calories
(kcal) consumed between the plate size groups:t(131) =
0.397, p= 0.692. Participants using large plates
con-sumed a mean amount of 644.1 kcal (SD= 265.0), versus
624.9 kcal (SD= 292.3) for those in the small plate con-dition. The mean difference was 19.2 cal (95% CI [−76.5, 115.0]), equivalent to a 3% difference between groups. The effect size was very small (d= 0.07; 95% CI [−0.27, 0.41]) in the hypothesised direction, with wide confi-dence intervals that include the possibility of a small to
medium effect in either direction. Sensitivity analysis after removing outlier participants (n= 5) did not alter the results, with a mean difference between groups in the same direction of 40.9 cal (95% CI [−37.7, 119.5]); t(126) = 1.03,p= 0.305;d= 0.18 (95% CI [−0.17, 0.53]).
Meal micro-structure
The only meal-microstructure measure that differed be-tween the two groups was the amount of food left on the plate after the meal, with participants using large plates leaving 8.6 g (95% CI [1.1, 16.0]) more food. No other group differences were found for meal
micro-structure measures (ts(dfs≥124)≤|1.33|, ps≥0.186).
The average time spent eating was approximately eight and a half minutes, with none of the participants still eating at the end of the allotted time.SeeTable2 for de-tails. Interrater agreement for determining the number of bites and the number of servings from the videos was
excellent (ICCbites= 0.997, 95% CI [0.993; 0.999];
Table 1Participant characteristics
Measure Small Plate
(n= 67)
Large Plate (n = 67)
Gender,n= 134
Men, n (%) 33 (49%) 32 (48%)
Women, n (%) 33 (49%) 35 (52%)
Other, n (%) 1 (1%) 0
Age (Mean (SD)), n = 134 35.9 (12.9) 35.9(10.9)
Ethnicity,n= 132
White, n (%) 57 (86%) 57 (86%)
Non-white, n (%) 9 (14%) 9 (14%)
BMI (Mean (SD)), n = 134 27.3 (4.9) 26.5 (4.7)
Socio-economic position Highest qualificationa, n = 132
No qualifications 3 (5%) 3 (5%)
Up to 4 GCSE’s 7 (11%) 7 (10%)
5 or more GCSE’s or 1 A-level 10 (15%) 11 (17%)
2 or more A-levels 12 (18%) 9 (14%)
Bachelor’s degree 16 (24%) 16 (24%)
Post-Graduate degree or qualification 18 (27%) 20 (30%)
Income per year before tax,n= 126
Lower income
(Up to £39,999)a, n (%) 29 (46%) 32 (51%)
Higher income
(£40,000 and more), n (%) 34 (54%) 31 (49%)
IMDb(Mean (SD)),
n= 120 12.6 (7.7) 11.6 (7.2) Hunger (Mean (SD)), n = 134 52.4 (25.8) 50.1 (23.7)
Fullness (Mean (SD)), n = 134 26.7 (24.5) 27.9 (21.8)
a
Lower/higher income categorisation is equivalent to average household income below, and above, ~$50,000 or€45,000
b
ICChelpings= 0.968, 95% CI [0.931; 0.985] [23]. This high interrater agreement suggests that internal validity is good and the data from video coding adequately reflect patterns of meal micro-structure behaviours.
Modifiers of plate size effect
There was no evidence of an interaction between plate size and any of the measured effect modifying
variables on consumption (response inhibition (p=
0.334); impulsivity (p= 0.847); highest education level
(p= 0.564); income (p= 0.200); IMD (p= 0.399);
sen-sitivity to perceptual cues (p= 0.193). Once those
in-teractions were removed from each model, there remained no evidence of a main effect of plate size for any of the models. These analyses are reported in full in Additional file 2.
Fig. 1CONSORT Flow Diagram
Table 2Primary outcome and meal micro-structure
Small plate Large plate
Mean (SD) Mean (SD) Mean Difference 95% CI p Cohen‘sd
Primary outcome
Kilocalories consumed (kcal) 624.9 (292.3) 644.1 (265.0) 19.2 −76.5, 115.0 0.692 0.07
Meal micro-structure
Meal duration (min) 8.6 (4.7) 8.7 (4.3) 0.0 −1.5, 1.6 0.953 0.01
Number of servings (n) 1.8 (0.8) 1.7 (0.7) −0.2 - 0.4, 0.1 0.186 −0.24
Amount self-served (g) 422.6 (192.7) 443.1 (174.0) 20.5 −42.5, 83.5 0.521 0.11
Amount of food left on the plate (g) 4.9 (10.5) 13.5 (28.9) 8.6 1.1, 16.0 0.024 0.40
Number of bites (n) 41.6 (23.6) 38.3 (17.0) −3.3 −10.5, 3.9 0.366 −0.16
Average bite size (g) 11.6 (5.0) 11.7 (4.3) 0.2 −1.5, 1.8 0.852 0.03
Average bite duration (duration/ bites), (min/n) 0.2 (0.1) 0.2 (0.1) 0.0 −0.0, 0.0 0.573 0.10
Discussion
We found, in the most robust study to date of the effect of plate size on consumption, no clear evidence of a difference in the energy consumed between groups that self-served lunch using larger or smaller plates. The effect observed was in the hypothesised direction, but very small, with 19 kcal greater consumption from larger plates. Confidence in-tervals around the effect include the possibility of a small to medium effect in either direction. In addition, while more food was left on the larger plates, this concerned very small absolute differences, and there was no evidence of impact of plate size on the amount of food served or any other ele-ments of the meal micro-structure. There was also no evi-dence of modification by individual characteristics, namely executive function, socio-economic position, and sensitivity to perceptual cues. While we would not predict an inter-action with the first two of these, and the third was specula-tive in the absence of existing evidence, it would be unlikely for interactions to be detected in the absence of main ef-fects [24].
A particular strength of the current study is that it ad-heres to recommended practices for open and reprodu-cible science, including pre-registration of both the study protocol and statistical analysis plan, and an appropriate sample size calculation. Unlike most studies on this topic, it also complies with guidance for conducting randomised controlled trials, including ensuring adequate randomisa-tion procedures, allocarandomisa-tion concealment and blinding, as well as analysis being conducted by an external analyst un-aware of group allocation. Finally, it also purposefully re-cruited a broadly representative, general population sample. These factors in combination mean that this study provides the most robust evidence to date to address the current uncertainty about the potential impact of altering plate size.
While conducting the study in laboratory conditions has advantages in controlling how participants are ex-posed to the intervention and reliably measuring their responses, giving high internal validity, there are inher-ent limitations conferred by this setting. In particular, external validity is compromised as the setting can never completely replicate a complex, real-world environment or eating occasion. To minimise these concerns, we used a naturalistic lounge environment within a purpose-built eating behaviour facility, which allowed an environment that would closely reflect real-world conditions. Partici-pants were free to move around the room as they
wished, were not rushed – as the time allowed was
intentionally more than was needed for the meal to be
consumed–and they could return to the meal as many
times as they liked. A further limitation of the study was that while we were able to measure the total weight of the food consumed and observe eating behaviour throughout via video recordings, we were unable to
assess all meal micro-structure characteristics over the duration of the session, such as the size of each individ-ual serving where a participant served themselves on multiple occasions. This would have required monitor-ing food weight continually for which we did not have an unobtrusive method sufficiently inconspicuous to participants.
The finding of no or a very small effect on consump-tion suggests that previous meta-analyses of a low qual-ity body of evidence may considerably overestimate effects [5–7]. Although the effect size we observed does fall within the 95% confidence intervals around the effect on consumption reported by the Hollands et al. [6] and Robinson et al. [5] meta-analyses, Holden et al. [7] re-port an estimated effect size ofd= 0.70 for those studies that that were most similar to ours, being those that focus on self-served consumption. This represents a large effect that lies outside the confidence intervals for our study. Closer examination of effect size estimates observed in individual studies within these meta-analyses suggests that our result is consistent with most previous research. Of 12 such comparisons included in the most recent Holden meta-analysis, with point esti-mates of effects ranging from d=−0.47 to d= 1.15, six comparisons report 95% confidence intervals which
in-clude the effect size seen in our study [25–27], while
two found modest effects in the opposite direction [28, 29]. Four studies found large effects of increasing
tableware size on consumption [25, 30–32], thus
shaping the summary effect sizes in these meta-analyses. Notably, three of these latter four studies originate from the Cornell University Food and Brand
Lab [30–32], meaning that due caution should be
ap-plied to their interpretation [9].
Given the varying effect size estimates accompanied by wide confidence intervals seen in single studies and meta-analyses to date, uncertainty remains around po-tential effects of plate size on consumption. An add-itional complication is that a wide variety of plate sizes have been compared in previous studies. While it is pos-sible that effects could differ for other absolute or rela-tive size comparisons, to our knowledge there is no clear evidence that a given magnitude of increase or reduction in plate size would lead to a commensurate effect on consumption. For example, Rolls and colleagues [26] in-cluded a comparison of a 17 cm plate to a 26 cm plate (a larger difference of 9 cm in diameter) and found no ef-fect on intake. Based on the current study, a small efef-fect of plate size –in either direction –cannot presently be
excluded. Even an effect of this magnitude– equivalent
to a 3% difference in consumption–could be
reductions in energy intake of at least 24 kcal per day – an amount equivalent to approximately 1.4% of average
daily energy intake for UK adults – are likely to help
prevent further weight gain in the population [33]. An effect equivalent to that observed in the current study therefore has the potential to be important and could justify further examination. This is particularly the case given there are clear opportunities for public health intervention that could capitalise on effects of plate size, such as limiting the size of plates used in some food ser-vice settings [34].
The current evidence suggests that it is not feasible to conduct a single, laboratory-based study of this manipu-lation that is adequately powered, because extremely large sample sizes would be required. While prior effect
size estimates – based on meta-analyses derived largely
from poor-quality laboratory studies – suggest
achiev-able sample sizes, these likely substantially overestimate effects. We are therefore reliant on cumulative meta-analyses of high-quality studies that minimise risk of bias, in order to reduce the uncertainty around these ef-fects. Crucially, however, whether this has the potential to be an effect relevant to public health efforts to reduce consumption is ultimately predicated on whether effects seen in the laboratory will be observed in real-world field settings.
The effects of tableware size on food consumption in field settings are not currently known. A small number of studies in free-living conditions have been conducted,
largely by the Cornell Food and Brand Lab [31,32], but
study participants are not representative of general pop-ulations and outcome measures are typically based on observations rather than objective behavioural data. Given the extremely large, unfeasible sample sizes needed to support additional laboratory studies, this sug-gests that further research in this area would most ap-propriately consist of well-conducted trials of tableware size in real-world field settings in free-selecting food ser-vice settings. This would provide necessary information as to whether changing the size of tableware has the po-tential to contribute to efforts to reduce consumption at population level. The results of the current study also suggest that research on tableware size should not be considered an immediate research priority relative to other interventions that can be applied in similar food service settings. For example, reduction of portion sizes has a more robust evidence base from a range of set-tings, accompanied by evidence of underlying mecha-nisms [35–39], while reducing availability of less healthy food options is supported by preliminary evidence from real-world settings that suggests substantially larger ef-fects [40].
Finally, we note that the use of smaller plates is widely promoted as a strategy for losing weight, including by
reputable sources of healthcare advice (https://www.nhs. uk/live-well/healthy-weight/12-tips-to-help-you-lose-weight/). The current evidence is, in our view, insuffi-ciently conclusive to either endorse or refute such ad-vice. While the results of the current study may reduce expectations that the effect sizes previously estimated by evidence syntheses could be realised, we do not have clear, robust evidence that smaller plates are ineffective or actively harmful. Furthermore, we are not aware of relevant evidence to suggest that using an ineffective strategy reduces the likelihood of a person also using more effective approaches to reduce consumption, al-though this is a plausible hypothesis. This uncertainty will likely be reduced by more robust studies and the updating of high-quality systematic reviews.
Conclusion
The most robust study to date of plate size and con-sumption suggests that previous meta-analyses of a low-quality body of evidence may have considerably overesti-mated effects. However, the possibility of a clinically
sig-nificant effect – in either direction – cannot be
excluded. Well-conducted trials of tableware size in real-world field settings are now needed to determine whether changing the size of tableware has potential to
contribute to efforts to reduce consumption at
population-level.
Additional files
Additional file 1:Study set-up diagram. (DOCX 170 kb)
Additional file 2:Interactions and main effects of the plate size andi)
executive function,ii)socio-economic status andiii)sensitivity to percep-tual cues on the amount of calories consumed. (DOCX 15 kb)
Acknowledgements
The authors thank the staff of the Wellcome–MRC IMS Translational Research Facility, Cambridge, UK, for their help in conducting the study: Professor Sadaf Farooqi, Sarah Kelway, Kieran Ryan, Carol Keel and Lesley Wood. We also thank Dr. Hisham Ziauddeen for providing medical support to the study.
Authors’contributions
GJH, TMM and PF conceived the study. All authors collaborated in designing the procedures. GJH and DK coordinated the study and intervention procedures. DK, IL, EP, and NC collected study data. KD, RM and LK performed the data analyses. GJH and DK drafted the manuscript, with all authors providing critical revisions. All authors read and approved the final manuscript.
Funding
Collaborative Award in Science from Wellcome Trust (Behaviour Change by Design: 206853/Z/17/Z) awarded to Theresa Marteau, Paul Fletcher, Gareth Hollands, Marcus Munafò.
Availability of data and materials
Ethics approval and consent to participate
Approved by the Psychology Research Ethics Committee of the University of Cambridge (Reference Number: PRE.2018.036). All participants provided written informed consent.
Consent for publication
Not applicable.
Competing interests
The authors declare that they have no competing interests.
Author details
1Behaviour and Health Research Unit, University of Cambridge, Cambridge,
UK.2Department of Psychology, University of Konstanz, Constance, Germany.
3UK Centre for Tobacco and Alcohol Studies, School of Psychological
Science, University of Bristol, Bristol, UK.4MRC Integrative Epidemiology Unit
(IEU), UK Centre for Tobacco and Alcohol Studies, School of Experimental Psychology, University of Bristol, Bristol, UK.5Department of Population Health Sciences, Bristol Medical School, University of Bristol, Bristol, UK.
6Department of Psychiatry, University of Cambridge, Cambridge, UK.
Received: 1 April 2019 Accepted: 26 July 2019
References
1. World Health Organization. (2017). World Health Statistics 2017: Monitoring Health for The SDGs. Retrieved fromhttp://apps.who.int/iris/bitstream/1 0665/255336/1/9789241565486-eng.pdf?ua=1.
2. United Nations General Assembly. (2014). Outcome document of the high-level meeting of the General Assembly on the comprehensive review and assessment of the progress achieved in the prevention and control of non-communicable diseases. Retrieved fromhttp://www.who.int/nmh/events/2 014/a-res-68-300.pdf.
3. Hollands GJ, Bignardi G, Johnston M, Kelly MP, Ogilvie D, Petticrew M, et al. The TIPPME intervention typology for changing environments to change behaviour. Nat Hum Behav. 2017;1(8):140.
4. Marteau TM, Hollands GJ, Fletcher PC. Changing human behavior to prevent disease: the importance of targeting automatic processes. Science. 2012;337(6101):1492–5.
5. Robinson E, Nolan S, Tudur-Smith C, Boyland EJ, Harrold JA, Hardman CA, Halford JCG. Will smaller plates lead to smaller waists? A systematic review and meta-analysis of the effect that experimental manipulation of dishware size has on energy consumption. Obes Rev. 2014;15(10):812–21.
6. Hollands GJ, Shemilt I, Marteau TM, Jebb SA, Lewis HB, Wei Y, et al. Portion, package or tableware size for changing selection and consumption of food, alcohol and tobacco. Cochrane Database Syst Rev. 2015;9:CD011045. 7. Holden SS, Zlatevska N, Dubelaar C. Whether smaller plates reduce
consumption depends on Who’s serving and Who’s looking: a meta-analysis. J Assoc Consum Res. 2016;1(1):134–46.
8. van der Zee T, Anaya J, Brown NJL. Statistical heartburn: an attempt to digest four pizza publications from the Cornell food and brand lab. BMC Nutrition. 2017;3(1):54.
9. Munafò MR, Hollands GJ, Marteau TM. Open science prevents mindless science. BMJ. 2018;363:1–2.
10. Wansink B, Payne C, Werle C. Consequences of Belonging to the“Clean Plate Club”. Arch Pediatr. 2012;163(7):674–5.
11. Munafò MR, Nosek BA, Bishop DVM, Button KS, Chambers CD, Percie Du Sert N, et al. A manifesto for reproducible science. Nat Hum Behav. 2017;1(1):1–9. 12. Hunter JA, Hollands GJ, Couturier DL, Marteau TM. Effect of snack-food
proximity on intake in general population samples with higher and lower cognitive resource. Appetite. 2018;121:337–47.
13. Mani A, Mullainathan S, Shafir E, Zhao J. Poverty impedes cognitive function. Science. 2012;338(6107):682–5.
14. Faul F, Erdfelder E, Buchner A, Lang AG. Statistical power analyses using G*power 3.1: tests for correlation and regression analyses. Behav Res Methods. 2009;41(4):1149–60.
15. Hill SW, McCutcheon NB. Contributions of obesity, gender, hunger, food preference, and body size to bite size, bite speed, and rate of eating. Appetite. 1984;5(2):73–83.
16. Verbruggen F, Logan GD, Stevens MA. STOP-IT: windows executable software for the stop-signal paradigm. Behav Res Methods. 2008;40(2):479–83.
17. Vainik U, Dagher A, Dubé L, Fellows LK. Neurobehavioural correlates of body mass index and eating behaviours in adults: a systematic review. Neurosci Biobehav Rev. 2013;37(3):279–99.
18. Stanford MS, Mathias CW, Dougherty DM, Lake SL, Anderson NE, Patton JH. Fifty years of the Barratt impulsiveness scale: an update and review. Personal Individ Differ. 2009;47(5):385–95.
19. McLennan, D., Barnes, H., Noble, M., Davies, J., & Garratt, E. (2011). The English indices of deprivation 2010. Neighbourhoods statistical release. Retrieved from https://www.gov.uk/government/statistics/english-indices-of-deprivation-2010.
20. Moore TM, Scott JC, Reise SP, Port AM, Jackson CT, Ruparel K, et al. Development of an abbreviated form of the Penn line orientation test using large samples and computerized adaptive test simulation. Psychol Assess. 2015;27(3):955–64. 21. Finlayson G, King N, Blundell J. The role of implicit wanting in relation to
explicit liking and wanting for food: implications for appetite control. Appetite. 2008;50(1):120–7.
22. Gamer, M., Lemon, J., Fellows, I., & Singh, P. (2012). Irr package for R, version 0.84. Retrieved fromhttps://cran.r-project.org/package=irr.
23. Cicchetti DV. Guidlines, criteria, and rules of thumb for Evalauting normed and standardized assessment instruments in psychology. Psychol Assess. 1994;6(4):284–90.
24. Yusuf S, Wittes J, Probstfield J, Tyroler HA. Analysis and interpretation of treatment effects in subgroups of patients in randomized clinical trials. JAMA. 1991;266(1):93–8.
25. Koh J, Pliner P. The effects of degree of acquaintance, plate size, and sharing on food intake. Appetite. 2009;52(3):595–602.
26. Rolls BJ, Roe LS, Halverson KH, Meengs JS. Using a smaller plate did not reduce energy intake at meals. Appetite. 2007;49(3):652–60.
27. Shah M, Schroeder R, Winn W, Adams-Huet B. A pilot study to investigate the effect of plate size on meal energy intake in normal weight and overweight/obese women. J Hum Nutr Diet. 2011;24(6):612–5. 28. Robinson E, Sheen F, Harrold J, Boyland E, Halford JC, Masic U. Dishware
size and snack food intake in a between-subjects laboratory experiment. Public Health Nutr. 2015;19(4):633–7.
29. Yip W, Wiessing KR, Budgett S, Poppitt SD. Using a smaller dining plate does not suppress food intake from a buffet lunch meal in overweight, unrestrained women. Appetite. 2013;69:102–7.
30. Van Kleef E, Shimizu M, Wansink B. Serving bowl selection biases the amount of food served. J Nutr Educ Behav. 2012;44(1):66–70.
31. Wansink B, van Ittersum K. Portion size me: plate-size induced consumption norms and win-win solutions for reducing food intake and waste. J Exp Psychol Appl. 2013;19(4):320–32.
32. Wansink B, Van Ittersum K, Payne CR. Larger bowl size increases the amount of cereal children request, consume, and waste. J Pediatr. 2014;164(2):323–6. 33. Department of Health. (2011).Statement of the Calorie Reduction Expert
Group. Retrieved fromhttps://assets.publishing.service.gov.uk/government/ uploads/system/uploads/attachment_data/file/215561/dh_127554.pdf. 34. Marteau TM, Hollands GJ, Shemilt I, Jebb SA. Downsizing: policy options to
reduce portion sizes to help tackle obesity. BMJ. 2015;351:1–5. 35. Almiron-Roig E, Forde C, Hollands G, Vargas M, Brunstrom J. Portion-size
reduction: a review of evidence supporting current strategies, challenges, and opportunities. Nutr Rev. in press.
36. Hollands GJ, Cartwright E, Pilling M, Pechey R, Vasiljevic M, Jebb SA, Marteau TM. Impact of reducing portion sizes in worksite cafeterias: a stepped wedge randomised controlled pilot trial. Int J Behav Nutr Phys Act. 2018;15(78):1–14. 37. Robinson E, Kersbergen I. Portion size and later food intake: evidence on
the“normalizing”effect of reducing food portion sizes. Am J Clin Nutr. 2018;107(4):640–6.
38. Steenhuis I, Poelman M. Portion size: latest developments and interventions. Curr Obes Rep. 2017;6:10–7.
39. Zlatevska N, Dubelaar C, Holden SS. Sizing up the effect of portion size on consumption: a meta-analytic review. J Mark. 2014;78(3):140–54.
40. Pechey R, Cartwright E, Pilling M, Hollands GJ, Vasiljevic M, Jebb SA, Marteau TM. Impact of increasing the proportion of healthier foods available on energy purchased in worksite cafeterias: a stepped wedge randomized controlled pilot trial. Appetite. 2019;133:286–96.
Publisher’s Note