R E S E A R C H
Open Access
Efficacy of a compulsory homework
programme for increasing physical activity
and improving nutrition in children: a
cluster randomised controlled trial
Scott Duncan
1*, Tom Stewart
1, Julia McPhee
1, Robert Borotkanics
1, Kate Prendergast
1, Caryn Zinn
1,
Kim Meredith-Jones
2, Rachael Taylor
2, Claire McLachlan
3and Grant Schofield
1Abstract
Background:Most physical activity interventions in children focus on the school setting; however, children typically engage in more sedentary activities and spend more time eating when at home. The primary aim of this cluster randomised controlled trial was to investigate the effects of a compulsory, health-related homework programme on physical activity, dietary patterns, and body size in primary school-aged children.
Methods:A total of 675 children aged 7–10 years from 16 New Zealand primary schools participated in the Healthy Homework study. Schools were randomised into intervention and control groups (1:1 allocation). Intervention schools implemented an 8-week applied homework and in-class teaching module designed to increase physical activity and improve dietary patterns. Physical activity was the primary outcome measure, and was assessed using two sealed pedometers that monitored school- and home-based activity separately. Secondary outcome measures included screen-based sedentary time and selected dietary patterns assessed via parental proxy questionnaire. In addition, height, weight, and waist circumference were measured to obtain body mass index (BMI) and waist-to-height ratio (WHtR). All measurements were taken at baseline (T0), immediately post-intervention (T1), and 6-months post-intervention (T2). Changes in outcome measures over time were estimated using generalised linear mixed models (GLMMs) that adjusted for fixed (group, age, sex, group x time) and random (subjects nested within schools) effects. Intervention effects were also quantified using GLMMs adjusted for baseline values.
Results:Significant intervention effects were observed for weekday physical activity at home (T1[P< 0.001] and T2 [P= 0.019]), weekend physical activity (T1[P < 0.001] and T2[P < 0.001]), BMI (T2only [P= 0.020]) and fruit
consumption (T1only [P= 0.036]). Additional analyses revealed that the greatest improvements in physical activity occurred in children from the most socioeconomically deprived schools. No consistent effects on sedentary time, WHtR, or other dietary patterns were observed.
Conclusions:A compulsory health-related homework programme resulted in substantial and consistent increases
in children’s physical activity–particularly outside of school and on weekends–with limited effects on body size and fruit consumption. Overall, our findings support the integration of compulsory home-focused strategies for improving health behaviours into primary education curricula.
Trial registration:Australian New Zealand Clinical Trials Registry,ACTRN12618000590268. Registered 17 April 2018.
Keywords:Child health, Intervention, Education, Curriculum, Pedometers, Dietary assessment, Body size, Child obesity
© The Author(s). 2019Open AccessThis article is distributed under the terms of the Creative Commons Attribution 4.0 International License (http://creativecommons.org/licenses/by/4.0/), which permits unrestricted use, distribution, and reproduction in any medium, provided you give appropriate credit to the original author(s) and the source, provide a link to the Creative Commons license, and indicate if changes were made. The Creative Commons Public Domain Dedication waiver (http://creativecommons.org/publicdomain/zero/1.0/) applies to the data made available in this article, unless otherwise stated. * Correspondence:[email protected]
1School of Sport and Recreation, Auckland University of Technology, Private Bag 92006, Auckland, New Zealand
Background
Physical activity and healthy nutrition practices are essential for many aspects of child health and development [1], in-cluding the prevention of chronic health conditions in ado-lescence and adulthood [2,3]. However, evidence indicates that many children do not meet international physical ac-tivity and dietary guidelines [4–7], contributing to a rise in obesity and related comorbidities in later life [8]. The devel-opment, implementation, and evaluation of effective and sustainable initiatives that equip children to lead healthy and active lives has become a key public health priority in many countries [1]. Despite parents having a significant in-fluence on children’s activity and eating patterns, exclu-sively home-based interventions are logistically impractical. The school setting may provide a unique opportunity for intervention delivery: intervention material can be wide-reaching, especially if made compulsory as part of the cur-riculum or integrated into school policy [9–11].
Several systematic reviews indicate that delivering inter-ventions within school can improve several physical activ-ity and diet behaviours in children [12–14]; however, these effects are often modest at best. Quality of evidence from past randomised controlled trials (RCTs) was criti-cised in a 2013 Cochrane Review and judged at moderate risk of bias—a reliance on self-reported outcomes, absence of longer term follow-up, lack of blinding, and failing to account for clustering during analyses being common problems [12]. Additional reviews have concluded that physical activity interventions have had only small to neg-ligible measured effects on total and moderate-to-vigorous physical activity, whether assessed immediately post inter-vention or at six-month follow-up [15, 16]. Nonetheless, evidence indicates that school-based physical activity and dietary interventions can be successful in improving indi-cators related to obesity in children [17].
To date, the majority of school-based physical activity/ nutrition interventions have focused solely on the school environment [12,18], despite reviews indicating that mul-ticomponent interventions involving the family or com-munity in addition to the school are likely to be most effective [17,19,20]. Family support and parental restric-tions can influence out-of-school physical activity [21], and the majority of food that children consume originates from the home [22, 23]. Therefore, it is unlikely that long-term behaviour change is possible when the influ-ences of the home environment are not addressed. The concept of curriculum-based physical activity or nutri-tion ‘homework’ is relatively under-utilised. Active for Life Year 5 (AFLY5) aimed to improve in-school and out-of-school physical activity and diet behaviours through professional learning and development for teachers coupled with in-class lessons and homework plans [24]. While positive effects on screen time and high energy drinks and snacks were observed, there
were no significant effects on physical activity, fruit and vegetable consumption, or body size [25,26].
This paper presents the main findings from the Healthy Homework programme, an eight-week (approximately one school term) intervention designed to improve the physical activity and dietary behaviours of primary-aged children through a compulsory health-related homework schedule, supplemented with curriculum resources for teachers. This approach differs from many previous school-based interventions because the homework com-ponent was designed to maximise family engagement, the-oretically improving the likelihood of success. Healthy Homework was developed in 2008 with oversight from New Zealand education and health professionals, and underwent extensive piloting in two primary schools [27]. Despite a small sample size, significant benefits were ob-served in physical activity and some dietary behaviours. Perhaps most importantly, focus groups revealed that the programme was highly valued by the children, their par-ents, and participating teachers [27]. We found that the level of family engagement exceeded expectations, and that the usability and utility of Healthy Homework for teachers was high [27].
Despite these encouraging results, several limitations were noted: the sample size was small limiting generalis-ability, the programme required updating to align with the New Zealand Curriculum, body size was not assessed, and the cluster unit was classroom (raising the possibility of between-group contamination). Therefore, the aim of this study was to determine the effects of an updated Healthy Homework programme on physical ac-tivity, nutrition, and body size in a large sample of New Zealand children randomised at the school level.
Methods
Participants
number generator (concealed from participants; 1:1 allo-cation ratio). This stratifiallo-cation was implemented as only one Decile 1 school was recruited. Schools assigned to the control group were offered the intervention (includ-ing all resources) follow(includ-ing the final assessment period. One Year 3, Year 4, and Year 5 class from each school were then selected to participate; simple random sam-pling was used in instances where there were two or more classes per year. Year 6 classes were excluded to permit final follow-up measurements. Enrolment oc-curred between 01/07/11 and 24/07/12, with measure-ments staggered across every calendar month (excluding January and December) and school term (1–4); the last follow-up measure occurred at 07/04/13. At the inter-vention schools, all children in the selected classes re-ceived the Healthy Homework programme as part of the schools’ curricula; however, parental consent was re-quired before children were included in the intervention evaluation. All children in each participating class were invited to take part in the evaluation (i.e., no formal in-clusion or exin-clusion criteria aside from consent/assent), which took place in school grounds. Parent information and consent forms were sent home with the children for completion and return. Ethical approval was obtained from the Auckland University of Technology (10/159) and University of Otago (11/084) Ethics Committees.
Based on reference data from the HH feasibility phase [27], we calculated that a target sample size of 800 chil-dren would enable us to detect the following differences in our outcome measures (α= 0.05, 1-β= 0.80): 1000 ped-ometer steps/day, 30 min.day−1of TV/computer time, 0.5 daily servings of fruit and vegetables, 0.5 daily servings of takeaway food, and a BMI z-score of 0.2. These calcula-tions allow for school clustering effects (cluster size = 16; ICC = 0.04), correlation between repeated measures (0.4 for all behavioural variables and 0.8 for BMI z-score), and 25% dropout at each follow-up point.
Intervention design
The design and theoretical basis of the Healthy Homework programme is described in detail elsewhere [27] and only a brief summary is outlined here. Healthy Homework was an eight-week curriculum-based homework schedule, comple-mented by an in-class teaching resource, designed to pro-mote physical activity and healthy eating in children (curriculum resources may be provided upon request). The programme was developed under the guidance of an advis-ory committee comprising experienced health and educa-tion professionals (including classroom teachers) with regular input from children and parents. Healthy Home-work was based on several established behaviour change theories (including the theory of reasoned action, the the-ory of planned behaviour, and social-cognitive thethe-ory [28]), and was designed to support the achievement objectives
associated with the Health and Physical Education strand of the New Zealand Curriculum [29]. The research team provided professional learning for the teachers of the three intervention classes at each intervention school, and to one lead teacher in each of the control schools (who were per-mitted to implement the programme at the conclusion of the final follow-up point). The professional learning proto-col was standardised across all schools, and necessitated one half-day release per teacher. Approximately 90 min was spent providing information about the benefits of physical activity and a healthy diet for children’s overall health and development, and the results of previous strat-egies to integrate these topics into the primary school cur-riculum. An additional 90 min was spent introducing the teachers to the in-class and homework modules, discussing examples of how to complete tasks, and fielding questions about the programme delivery and evaluation.
At the start of the intervention, all children in participat-ing classes received a homework booklet organised into weekly topics that each contained one physical activity and one nutrition component (e.g., walking and fruit/vegetables, screen time and breakfast, fitness and cooking). Three prac-tical homework options were provided for each topic, and the children were directed by their teacher to complete at least one physical activity and one nutrition task per topic each week (e.g., organising family walks, walking to and from school, limiting screen time, testing the fitness of the family, eating 5+ fruit and vegetables each day, comparing food labels at the supermarket, helping with dinner, prepar-ing a healthy lunch box). Blue or purple rubber wristbands were provided each week for children who completed their homework obligations, with a black colour reserved for those who completed all six tasks on a given week. The intention of the wristbands were to encourage the children to complete more than the minimum number of required tasks. The Healthy Homework classroom curriculum re-source was designed to provide the teachers with sufficient educational content and in-class exercises for three 1.5-h sessions delivered on different days throughout each week (including one session reviewing the previous week’s home-work). Furthermore, an online portal was developed and monitored to allow teachers to access resources and record student compliance, and to enable children to share home-work-related updates with other participants (including those in other schools). Student and teacher modules can be downloaded as Additional files2and3.
Measures
Baseline measurements were taken prior to intervention de-livery (T0), and repeated immediately post-intervention (T1)
and six-months post-intervention (T2), between August
appropriate level of anthropometric training by experienced researchers prior to data collection.
Physical activity
Weekday physical activity at school, weekday physical activity at home, and weekend physical activity–treated as the primary outcome measures–were assessed using sealed NL-1000 pedometers (New Lifestyles Inc., Lee’s Summit, MO) over five consecutive days (three week-days, two weekend days). These pedometers have a mul-tiday memory function that automatically stores step counts by day of week for up to 7 days. Our previous re-search has established the validity of these pedometers for measuring steps in children, with mean percent bias less than 5% for typical walking speeds [30]. Two pe-dometers were assigned to each child: one clearly la-belled ‘School’ and the other ‘Home’. The ‘School’ pedometer was worn during school hours, while the
‘Home’pedometer was left inside a collection tray in the classroom. At the conclusion of the school day (approx. 3 pm), each child placed their ‘School’pedometer in the tray and attached their‘Home’pedometer. At the begin-ning of the next weekday (approximately 9 am), the teacher reminded the children to switch over their pe-dometers again. Thus, before school and after school ac-tivities that were outside of the classroom were captured on the‘Home’pedometer. This approach was taken as it removed the need for teachers to coordinate a lengthy collection and handout process, and allowed the differ-entiation of in-school and out-of-school physical activity, while using a cost-effective but objective measurement device.
Dietary patterns
Key dietary patterns were estimated as secondary out-come measures using items extracted from the Chil-dren’s Dietary Questionnaire (CDQ), a parental proxy report that has been validated in children aged 4–16 years [31]. The CDQ focuses on patterns of food intake over the previous 24 h and/or 7 days rather than actual amounts and types of foods consumed. The question-naire contained 33 items, 30 of which utilised categorical response options, and three of which utilised open-ended response options. A total of 20 questions referred to dietary patterns over the previous seven-days, 11 questions referred to dietary patterns over the previous 24-h, and two referred to specific meal questions (break-fast and lunch). The four dietary items selected for ana-lyses in this study were: (1) daily fruit consumption, (2) daily vegetable consumption, (3) weekly fast food con-sumption, and (4) weekly soft drink consumption. These items were selected given their alignment with the New Zealand Food and Nutrition Guidelines, and the high prevalence of soft drink consumption in New Zealand
youth [32]. A copy of the questionnaire may be provided upon request.
Television and computer usage
Two questions pertaining to the frequency and duration of television, computer and gaming console use were also amended to the questionnaire as additional second-ary outcome measures. These questions asked parents to recall the amount of time each day (Monday to Sunday) their child spent (1) watching TV, DVDs, or videos, or (2) on the computer or games console (not including school-related work) in the previous week. The total time provided for Monday to Friday was averaged to provide a weekday TV/computer estimate, whereas Sat-urday and Sunday totals were averaged to provide a weekend estimate.
Body size
Standing height was measured to the nearest millimetre with a portable stadiometer (SECA 213, Hamberg, Germany) and weight was measured to the nearest 0.1 kg on a digital scale (SECA 813, Hamberg, Germany). Waist circumference was measured midway between the iliac crest (highest point of the pelvis at the side) and the low-est rib margin. Participants were asked to remove their shoes and any bulky external clothing (i.e. jackets, coats) prior to assessment. For all anthropometric measures, esti-mates were taken three times, with the average value used in subsequent analysis. Body mass index (BMI; secondary outcome measure) was calculated as weight (kg) divided by squared height (m2), and waist-to-height ratio (WHtR; secondary outcome measure) was calculated as waist cir-cumference (cm) divided by height (cm).
Statistical analysis
In the first instance, baseline characteristics of the sam-ple were calculated and presented as mean ± standard deviation (SD), or median and interquartile range (IQR) in cases where the data were not normally distributed. Intention-to-treat analyses were used to test the efficacy of the intervention, regardless of adherence to home-work tasks. To simplify analysis and interpretation of the dietary data, categorical CDQ subscales were converted into binary variables using thresholds that approximately balanced the number of responses in each category.
the exception being weekday TV, which were evaluated using a Gaussian distribution and identity link function. Models predicted outcomes at completion of the inter-vention (T1). Additional models predicted outcomes at 6
months post intervention (T2). Marginal effects were
evaluated on select variables. Descriptive analyses were conducted in IBM SPSS Statistics v23 (IBM Cooper-ation, USA) and GLMM’s were carried out using Stata V14 (Stata Corporation, USA).
Results
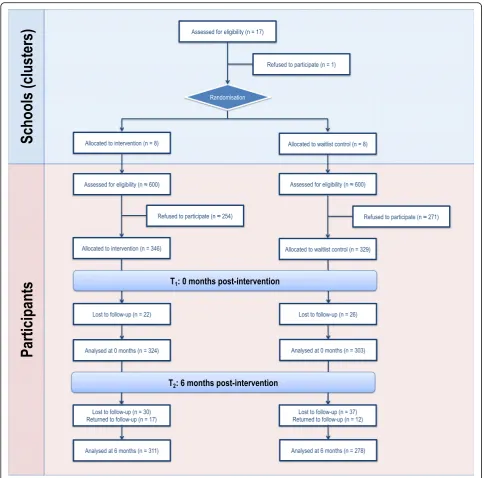
The Healthy Homework intervention was conducted be-tween August 2011 and August 2012. Figure 1 depicts participant allocation and retention across each phase of the study in the form of a CONSORT flow diagram. A total of 675 children (intervention = 171 boys and 175 girls; control = 155 boys and 174 girls) aged 7–10 years provided written parental consent and assent to partici-pate in the evaluation (consent rate = 56.3%). Cluster size (i.e., the number of children from each school) ranged from 14 to 53 (median [IQR] = 47.5 [36.5, 50]). Absent days, changing school, and withdrawals resulted in 46 children that did not participate in the first follow up (T1), and 67 children that did not participate in the
sec-ond follow-up 6-months post intervention (T2).
How-ever, 29 of the 46 children absent from T1returned for
T2. The completed CONSORT checklist can be accessed
as an Additional file1.
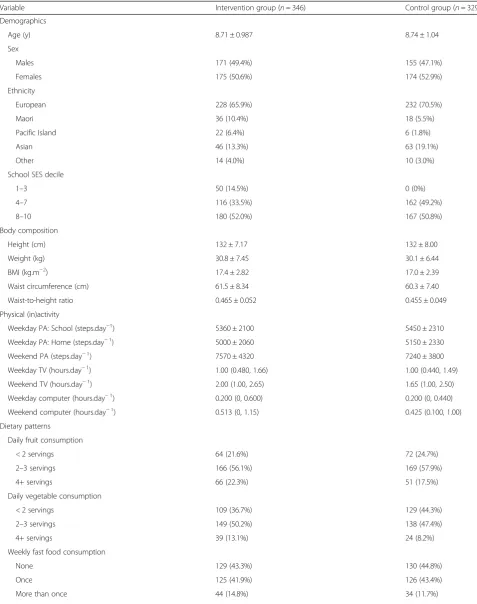
Table 1 shows the descriptive characteristics of the study sample. There were no meaningful differences in age, gender distribution, or physical activity between the intervention and control groups at baseline. However, the intervention group contained notably more partici-pants from schools in lower SES areas, had a higher pro-portion of children from Maori and Pacific backgrounds, as well as slightly higher BMI, WHtR, and daily servings of vegetables. Overall, the sample averaged 5090 ± 2200 steps/day (mean ± SD) at home on weekdays, 5410 ± 2200 steps/day at school, and 7440 ± 4100 steps/day on weekends, with boys more active than girls. No system-atic pattern emerged with regard to the missingness of the data. For outcomes reported by proxy questionnaire, the sponse rate at T3 averaged between 54 and 60%. We re-moved weekend activity from our secondary analyses because the response rates were below 50%. All other out-comes evaluated–BMI, weekday activity–had a response rate in excess of 70%.
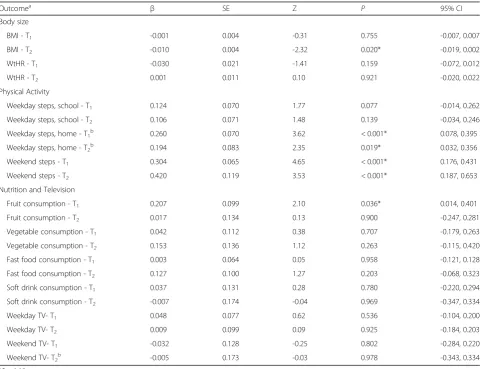
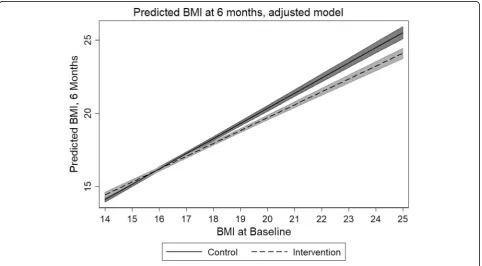
Table 2 presents the results for the GLMMs. In gen-eral, the intervention group did not experience a statisti-cally significant reduction in BMI immediately after the completion of the intervention (p: 0.755), but did dem-onstrate a statistically significant reduction in BMI at 6 months post intervention (p: 0.020). The predicted mar-ginal mean of BMI in the control group at 6 months was
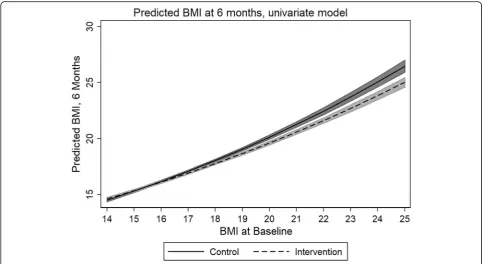
17.451; the intervention group, 17.274. However, mar-ginal analyses revealed that those subjects that are likely to benefit most are students that have a baseline BMI of 17 or higher (Fig. 2), with a statistically significant difference between the intervention and control groups emerging at this point (β: −0.267, z:−2.19, p: 0.028, CI: −0.017−0.001).
Overall activity increased at T1 and T2 time points.
This increase was statistically significant for weekday home and weekend activity (Table2). School decile had exhibited a statistically significant impact on weekday home activity at T1, with the greatest improvements in
weekday home activity occurring in the most socioeco-nomically deprived schools (Table 3). This increase per-sisted into T2, albeit attenuating to just outside of
statistical significance (Table 3). Weekend television watching increased relative to baseline in those subjects from the most socioeconomically deprived schools at T2,
and this difference was statistically significant (Table3). The adjusted model evaluating covariate effect on BMI at T2revealed that weekday home activity was the most
significant covariate (Table 4 and Fig. 3). For each in-crease in 1000 steps, an almost 0.6 point dein-crease in BMI was realized. This model was adjusted for school decile. These decreases were most pronounced in the so-cioeconomically most deprived schools, where subject BMI decreased 0.476 points per 1000 steps, when con-trolling for other covariates. Proxy-reported vegetable consumption at T2was the second most important
pre-dictor of BMI reduction at T2, where each meal of
vege-table consumed resulted in a 0.036 point decrease in BMI. It should be noted that weekend steps could not be evaluated with respect to school decile or BMI at T2,
because only 39 and 47% matching observations were available (respectively).
Discussion
cognitive outcomes of even modest increases in physical activity [33, 34]. Furthermore, the relatively larger effects observed in children from the most socioeconomically-de-prived schools suggest that this intervention approach may be an effective way of engaging at-risk populations.
Significant intervention effects on BMI and fruit con-sumption were also observed, although the effects were smaller and inconsistent across time points. Intervention effects on BMI, in particular, were limited. No difference was observed at the end of the intervention, and although a statistically significant difference was observed between groups at T2, such a difference would not be deemed
clinically relevant. It is possible that the follow-up time was insufficient to allow any improvements in physical ac-tivity to influence body size. Nonetheless, our findings provide some support for the development and imple-mentation of resources that enhance family involvement in health-related curriculum areas.
Despite the positive effects for physical activity, we did not observe any meaningful changes in screen time or dietary patterns. The lack of effect on screen time may be explained by the relatively minor emphasis placed on this topic (only one session); however, half the module featured advice and activities relating to nutrition and
Table 1Descriptive characteristics of intervention and control groups at baseline
Variable Intervention group (n= 346) Control group (n= 329)
Demographics
Age (y) 8.71 ± 0.987 8.74 ± 1.04
Sex
Males 171 (49.4%) 155 (47.1%)
Females 175 (50.6%) 174 (52.9%)
Ethnicity
European 228 (65.9%) 232 (70.5%)
Maori 36 (10.4%) 18 (5.5%)
Pacific Island 22 (6.4%) 6 (1.8%)
Asian 46 (13.3%) 63 (19.1%)
Other 14 (4.0%) 10 (3.0%)
School SES decile
1–3 50 (14.5%) 0 (0%)
4–7 116 (33.5%) 162 (49.2%)
8–10 180 (52.0%) 167 (50.8%)
Body composition
Height (cm) 132 ± 7.17 132 ± 8.00
Weight (kg) 30.8 ± 7.45 30.1 ± 6.44
BMI (kg.m−2) 17.4 ± 2.82 17.0 ± 2.39
Waist circumference (cm) 61.5 ± 8.34 60.3 ± 7.40
Waist-to-height ratio 0.465 ± 0.052 0.455 ± 0.049
Physical (in)activity
Weekday PA: School (steps.day−1) 5360 ± 2100 5450 ± 2310
Weekday PA: Home (steps.day−1) 5000 ± 2060 5150 ± 2330
Weekend PA (steps.day−1) 7570 ± 4320 7240 ± 3800
Weekday TV (hours.day−1) 1.00 (0.480, 1.66) 1.00 (0.440, 1.49)
Weekend TV (hours.day−1) 2.00 (1.00, 2.65) 1.65 (1.00, 2.50)
Weekday computer (hours.day−1) 0.200 (0, 0.600) 0.200 (0, 0.440)
Weekend computer (hours.day−1) 0.513 (0, 1.15) 0.425 (0.100, 1.00)
Dietary patterns
Daily fruit consumption
< 2 servings 64 (21.6%) 72 (24.7%)
2–3 servings 166 (56.1%) 169 (57.9%)
4+ servings 66 (22.3%) 51 (17.5%)
Daily vegetable consumption
< 2 servings 109 (36.7%) 129 (44.3%)
2–3 servings 149 (50.2%) 138 (47.4%)
4+ servings 39 (13.1%) 24 (8.2%)
Weekly fast food consumption
None 129 (43.3%) 130 (44.8%)
Once 125 (41.9%) 126 (43.4%)
diet. We did note via anecdotal feedback that the children appeared to prefer the physical activity topics over the nu-trition topics, and perhaps this played a role in the lack of consistent dietary effects. It is possible that physical activ-ity is a more malleable and less complex behaviour than diet in children [35], or that our questionnaire-based as-sessment of dietary intake was not sensitive enough to quantify meaningful changes in this sample. In any case, this study suggests that nutrition initiatives in primary
schools may not achieve the same level of benefits as simi-lar physical activity programmes.
One of the distinctive aspects of the intervention was its compulsory nature, with a number of key health mes-sages grounded in the national school curriculum [29]. Although there is promising evidence that purely family-based intervention approaches can improve children’s physical activity and diet [36,37], teaching nutrition and physical activity within the primary-school curriculum Table 1Descriptive characteristics of intervention and control groups at baseline(Continued)
Variable Intervention group (n= 346) Control group (n= 329)
Weekly soft drink consumption
None 109 (36.6%) 119 (40.6%)
Once 56 (18.8%) 46 (15.7%)
More than once 133 (44.6%) 128 (43.7%)
Categorical data are presented as n (%), and continuous data are presented as mean ± SD or median (IQR) where appropriate. School socioeconomic decile was sourced from NZ Ministry of Education records
Table 2Generalized linear mixed model results of between group differences, T1and T2, primary and secondary outcome variables
Outcomea
β SE Z P 95% CI
Body size
BMI - T1 -0.001 0.004 -0.31 0.755 -0.007, 0.007
BMI - T2 -0.010 0.004 -2.32 0.020* -0.019, 0.002
WtHR - T1 -0.030 0.021 -1.41 0.159 -0.072, 0.012
WtHR - T2 0.001 0.011 0.10 0.921 -0.020, 0.022
Physical Activity
Weekday steps, school - T1 0.124 0.070 1.77 0.077 -0.014, 0.262
Weekday steps, school - T2 0.106 0.071 1.48 0.139 -0.034, 0.246
Weekday steps, home - T1b 0.260 0.070 3.62 < 0.001* 0.078, 0.395
Weekday steps, home - T2b 0.194 0.083 2.35 0.019* 0.032, 0.356
Weekend steps - T1 0.304 0.065 4.65 < 0.001* 0.176, 0.431
Weekend steps - T2 0.420 0.119 3.53 < 0.001* 0.187, 0.653
Nutrition and Television
Fruit consumption - T1 0.207 0.099 2.10 0.036* 0.014, 0.401
Fruit consumption - T2 0.017 0.134 0.13 0.900 -0.247, 0.281
Vegetable consumption - T1 0.042 0.112 0.38 0.707 -0.179, 0.263
Vegetable consumption - T2 0.153 0.136 1.12 0.263 -0.115, 0.420
Fast food consumption - T1 0.003 0.064 0.05 0.958 -0.121, 0.128
Fast food consumption - T2 0.127 0.100 1.27 0.203 -0.068, 0.323
Soft drink consumption - T1 0.037 0.131 0.28 0.780 -0.220, 0.294
Soft drink consumption - T2 -0.007 0.174 -0.04 0.969 -0.347, 0.334
Weekday TV- T1 0.048 0.077 0.62 0.536 -0.104, 0.200
Weekday TV- T2 0.009 0.099 0.09 0.925 -0.184, 0.203
Weekend TV- T1 -0.032 0.128 -0.25 0.802 -0.284, 0.220
Weekend TV- T2b -0.005 0.173 -0.03 0.978 -0.343, 0.334
*P< 0.05
a
Random effects statistics excluded for brevity, but available upon request. All models were adjusted for age and sex
b
provides a cost-effective method of reaching large num-bers of children without the requirement of children or families to‘opt-in’. Given the significant effects on phys-ical activity, body size, and fruit consumption in this study, it appears that curriculum-based, health-related programmes in primary schools can have an impact on the behaviours of children, at least over the short-medium term.
The significant improvements observed in the present study are in contrast to the lack of effects reported by the AFLY5 study [25, 26], which featured an intervention de-sign very similar to the present study (both studies targeted
similar lifestyle behaviours via compulsory in-class lesson plans and homework tasks). The AFLY5 authors offered several explanations as to why AFLY5 may not have had a significant impact, such as the delay in time between inter-vention development and implementation, and the poten-tial need for more intensive behavioural change and/or upstream societal or environmental approaches. None of these possibilities, however, explain the difference in out-comes between AFLY5 and Healthy Homework. One clear distinction was that Healthy Homework included a mini-mum of 14 and a maximini-mum of 42 homework tasks over the 8-week period, whereas AFLY5 provided 10 parent-child
Fig. 2Predicted difference in BMI between study groups (univariate model)
Table 3Outcome measures effected by school socioeconomic decile
β SE Z P 95% CI
Weekday steps, home - T1 0.211 0.633 3.33 0.001 0.087, 0.335
Reference: school decile 8–10 - - - -
-Deciles 4–7 0.161 0.064 2.52 0.012 0.036, 0.286
Decile 3 0.326 0.136 2.39 0.017 0.059, 0.593
Weekday steps, home - T2 0.168 0.075 2.24 0.025 0.012, 0.314
Reference: school decile 8–10 - - - -
-Deciles 4–7 0.089 0.075 1.18 0.239 -0.059, 0.237
Decile 3 0.298 0.159 1.88 0.060 -0.013, 0.609
Weekend TV - T2 -0.098 0.124 -0.79 0.431 -0.341, 0.145
Reference: school decile 8–10 - - - -
-Deciles 4–7 0.144 0.149 0.097 0.334 -0.148, 0.436
interaction activities. Furthermore, AFLY5 researchers re-ported difficulties motivating some teachers, who felt the need to prioritise literacy and numeracy above health-pro-moting lessons [26]. Another similar intervention–the Eat Well and Keep Moving Program– was conducted over a two-year period, and integrated materials designed to in-crease physical activity, improve dietary patterns, and re-duce television viewing within the grade 4 and 5 school curriculum (including homework components) [11]. The evaluation of the intervention revealed significant improve-ments in dietary patterns and a marginal decrease in televi-sion viewing via 24-h recall questionnaires. The present findings add to this body of evidence by demonstrating the potential for positive physical activity outcomes when using objective measurement techniques; however, the effects of embedding health-related lessons and homework within
school curricula appear to be variable, and may depend on the specific population and/or context.
There were several limitations present in this study that should be acknowledged. While we were able to collect data about the overall amount of physical activity, we were not able to clarify with any detail the within-day patterns and intensity of activity. Pedometers were primarily chosen for financial reasons; however, the use of omnidirectional accelerometers would have enabled another level of analysis. Related to this point, we were not able to determine the effects on sedentary behaviour, which cannot be effectively isolated via pedometry. As mentioned earlier, a more comprehensive dietary assess-ment may have revealed some effect on nutrition, al-though the substantial response burden may have resulted in participant bias. The four items from the Table 4Adjusted model, BMI-T2
β SE Z P 95% CI
Intervention -0.110 0.085 -1.29 0.198 -0.277, 0.057
Weekday steps, home - T2 -0.059a 0.017 -3.57 < 0.001 -0.277, -0.026
Decile
Reference: school decile 8–10 - - - -
-Deciles 4–7 0.100 0.087 1.16 0.246 -0.070, 0.271
Decile 3 -0.477 0.204 -2.33 0.020 -0.877, -0.271
Vegetables consumed - T2 0.036 0.033 -1.09 0.275 -0.099, 0.028
a
Reflects slope per 1000 steps taken
CDQ, selected due to their alignment with NZ policy, may not exhibit the same levels of validity and reliability as the full scales. In addition, generalisability of conclusions based on the data in this study is limited by the selection of par-ticipants from only two regions of New Zealand; the study design clearly requires replication in larger and more di-verse populations. Socioeconomic decile ratings were not evenly matched by intervention and control group; there was one Decile 1 intervention school, whereas the lowest decile rating in the control group was Decile 3. Another limitation was that the research assistants collecting data were not blinded to the school allocation, which may have introduced accidental or deliberate bias during anthropo-metric assessment. Finally, intervention fidelity, which would have enabled per protocol analysis, was not assessed.
Conclusions
In summary, we have shown that a curriculum-based health programme can result in consistent improvements to physical activity levels in primary school-aged children, with significant but limited effects on body size and fruit consumption. The next step is to see if such programmes are sustainable within the school environment over a long term, and without input from researchers. The effects of such programmes on academic and neurocognitive out-comes development is also of interest and should be ex-plored in future.
Additional file
Additional file 1:CONSORT 2010 checklist of information to include when reporting a randomised trial. (DOC 218 kb)
Additional file 2:Teachers Manual. (PDF 11980 kb)
Additional file 3:Students Manual. (PDF 10554 kb)
Abbreviations
AFLY5:Active for life year 5; BMI: Body mass index; CDQ: Children’s dietary questionnaire; GLMM: Generalised linear mixed model; RCT: Randomised controlled trial; T0, T1, T2: Baseline, first follow-up, and second follow-up time points; WHtR: Waist-to-height ratio
Acknowledgements
The authors would like to thank all participating schools, children, and parents for contributing their time and effort to this study.
Authors’contributions
SD and GS conceptualised the study, and SD was the principal investigator for the Health Research Council Project Grant. SD, CZ, RT designed the evaluation protocol, and SD, JM, KP, CZ, and CM contributed to the development of intervention resources. JM, KP, and KM recruited all participants and collected the data. KP and KM collated and processed the data, and RB and SD analysed the data. SD and TS drafted the manuscript. All authors provided critical feedback throughout the writing process. All authors read and approved the final manuscript.
Funding
Funding for the Healthy Homework study was provided by a Health Research Council of New Zealand Project Grant (10–207).
Availability of data and materials
The datasets generated and/or analysed during the current study are not publicly available due to a confidentiality agreement with participating schools. Enquiries should be addressed to the principal author.
Ethics approval and consent to participate
Written informed parental consent and personal assent was obtained from each participant for the collection and use of the data in future publication. Ethical approval for the study was obtained from the Auckland University of Technology (10/159) and University of Otago (11/084) Ethics Committees.
Consent for publication Not applicable.
Competing interests
The authors declare that they have no competing interests.
Author details
1School of Sport and Recreation, Auckland University of Technology, Private Bag 92006, Auckland, New Zealand.2Edgar Diabetes and Obesity Research Centre, University of Otago, PO Box 56, Dunedin, New Zealand.3School of Education, Federation University Australia, PO Box 663, Ballarat VIC 3353, Victoria, Australia.
Received: 8 May 2018 Accepted: 16 August 2019
References
1. World Health Organization. WHO recommendations on child health. Geneva: World Health Organization; 2017.
2. Lipsky LM, Haynie DL, Liu D, Chaurasia A, Gee B, Li K, et al. Trajectories of eating behaviors in a nationally representative cohort of U.S. adolescents during the transition to young adulthood. Int J Behav Nutr Phys Act. 2015;12:138. 3. Telama R. Tracking of physical activity from childhood to adulthood: a
review. Obes Facts. 2009;2:187–95.
4. Cooper AR, Goodman A, Page AS, Sherar LB, Esliger DW, van Sluijs EM, et al. Objectively measured physical activity and sedentary time in youth: the International children’s accelerometry database (ICAD). Int J Behav Nutr Phys Act. 2015;12:113.
5. Vereecken C, Pedersen TP, Ojala K, Krølner R, Dzielska A, Ahluwalia N, et al. Fruit and vegetable consumption trends among adolescents from 2002 to 2010 in 33 countries. Eur J Public Health. 2015;25:16–9.
6. Lynch C, Kristjansdottir AG, Te Velde SJ, Lien N, Roos E, Thorsdottir I, et al. Fruit and vegetable consumption in a sample of 11-year-old children in ten European countries–the PRO GREENS cross-sectional survey. Public Health Nutr. 2014;17:2436–44.
7. Tremblay MS, Barnes JD, Gonzalez SA, Katzmarzyk PT, Onywera VO, Reilly JJ, et al. Global matrix 2.0: report card grades on the physical activity of children and youth comparing 38 countries. J Phys Act Health. 2016;13: S343–S66.
8. Reilly JJ, Kelly J. Long-term impact of overweight and obesity in childhood and adolescence on morbidity and premature mortality in adulthood: systematic review. Int J Obes. 2011;35:891–8.
9. Erwin H, Beighle A, Carson RL, Castelli DM. Comprehensive school-based physical activity promotion: a review. Quest. 2013;65:412–28.
10. Williams AJ, Henley WE, Williams CA, Hurst AJ, Logan S, Wyatt KM. Systematic review and meta-analysis of the association between childhood overweight and obesity and primary school diet and physical activity policies. Int J Behav Nutr Phys Act. 2013;10:101.
11. Gortmaker SL, Cheung LW, Peterson KE, Chomitz G, Cradle JH, Dart H, et al. Impact of a school-based interdisciplinary intervention on diet and physical activity among urban primary school children: eat well and keep moving. Arch Pediatr Adolesc Med. 1999;153:975–83.
12. Dobbins M, Husson H, DeCorby K, LaRocca RL. School-based physical activity programs for promoting physical activity and fitness in children and adolescents aged 6 to 18. Cochrane Database Syst Rev. 2013;(2):CD007651. https://doi.org/10.1002/14651858.CD007651.pub2.
14. Evans CE, Christian MS, Cleghorn CL, Greenwood DC, Cade JE. Systematic review and meta-analysis of school-based interventions to improve daily fruit and vegetable intake in children aged 5 to 12 y. Am J Clin Nutr. 2012; 96:889–901.
15. Metcalf B, Henley W, Wilkin T. Effectiveness of intervention on physical activity of children: systematic review and meta-analysis of controlled trials with objectively measured outcomes (EarlyBird 54); 2012.
16. Sims J, Scarborough P, Foster C. The effectiveness of interventions on sustained childhood physical activity: a systematic review and meta-analysis of controlled studies. PLoS One. 2015;10:e0132935.
17. Wang Y, Cai L, Wu Y, Wilson RF, Weston C, Fawole O, et al. What childhood obesity prevention programmes work? A systematic review and meta-analysis. Obes Rev. 2015;16:547–65.
18. Kriemler S, Meyer U, Martin E, van Sluijs EM, Andersen LB, Martin BW. Effect of school-based interventions on physical activity and fitness in children and adolescents: a review of reviews and systematic update. Br J Sports Med. 2011;45:923–30.
19. Van Sluijs EM, McMinn AM, Griffin SJ. Effectiveness of interventions to promote physical activity in children and adolescents: systematic review of controlled trials. BMJ. 2007;335:703.
20. Brown HE, Atkin AJ, Panter J, Wong G, Chinapaw MJ, van Sluijs EM. Family-based interventions to increase physical activity in children: a systematic review, meta-analysis and realist synthesis. Obes Rev. 2016; 17:345–60.
21. McMinn AM, Griffin SJ, Jones AP, van Sluijs EM. Family and home influences on children’s after-school and weekend physical activity. Eur J Public Health. 2013;23(5):805–1.
22. Rockell JE, Parnell WR, Wilson NC, Skidmore PM, Regan A. Nutrients and foods consumed by New Zealand children on schooldays and non-schooldays. Public Health Nutr. 2011;14:203–8.
23. Regan A, Parnell W, Gray A, Wilson N. New Zealand children's dietary intakes during school hours. Nutr Dietetics. 2008;65:205–10.
24. Lawlor DA, Jago R, Noble SM, Chittleborough CR, Campbell R, Mytton J, et al. The active for life year 5 (AFLY5) school based cluster randomised controlled trial: study protocol for a randomized controlled trial. Trials. 2011; 12:181.
25. Kipping RR, Howe LD, Jago R, Campbell R, Wells S, Chittleborough CR, et al. Effect of intervention aimed at increasing physical activity, reducing sedentary behaviour, and increasing fruit and vegetable consumption in children: active for life year 5 (AFLY5) school based cluster randomised controlled trial. Bmj. 2014;348:g3256.
26. Anderson EL, Howe LD, Kipping RR, Campbell R, Jago R, Noble SM, et al. Long-term effects of the active for life year 5 (AFLY5) school-based cluster-randomised controlled trial. BMJ Open. 2016;6:e010957.
27. Duncan S, McPhee JC, Schluter PJ, Zinn C, Smith R, Schofield G. Efficacy of a compulsory homework programme for increasing physical activity and healthy eating in children: the healthy homework pilot study. Int J Behav Nutr Phys Act. 2011;8:127.
28. Abraham C, Michie S. A taxonomy of behavior change techniques used in interventions. Health Psychol. 2008;27:379–87.
29. Ministry of Education. The New Zealand curriculum. Wellington: Ministry of Education; 2007.
30. Duncan S, Schofield G, Duncan EK, Hinckson EA. Effects of age, walking speed, and body composition on pedometer accuracy in children. Res Q Exerc Sport. 2007;78:420–8.
31. Magarey A, Golley R, Spurrier N, Goodwin E, Ong F. Reliability and validity of the Children's dietary questionnaire; a new tool to measure children's dietary patterns. Int J Ped Obes. 2009;4:257–65.
32. Sundborn G, Utter J, Teevale T, Metcalf P, Jackson R. Carbonated beverages consumption among New Zealand youth and associations with BMI and waist circumference. Pac Health Dialog. 2014;20(1):81–6.
33. Janssen I, Leblanc AG. Systematic review of the health benefits of physical activity and fitness in school-aged children and youth. Int J Behav Nutr Phys Act. 2010;7:40.
34. Poitras VJ, Gray CE, Borghese MM, Carson V, Chaput JP, Janssen I, et al. Systematic review of the relationships between objectively measured physical activity and health indicators in school-aged children and youth. Appl Physiol Nutr Metab. 2016;41:S197–239.
35. World Health Organization. Interventions on diet and physical activity: what works. Geneva: World Health Organization; 2009.
36. Viitasalo A, Eloranta AM, Lintu N, Vaisto J, Venalainen T, Kiiskinen S, et al. The effects of a 2-year individualized and family-based lifestyle intervention on physical activity, sedentary behavior and diet in children. Prev Med. 2016;87:81–8.
37. Taylor RW, Cox A, Knight L, Brown DA, Meredith-Jones K, Haszard JJ, et al. A tailored family-based obesity intervention: a randomized trial. Pediatrics. 2015;136:281–9.
Publisher’s Note