R E S E A R C H
Open Access
Estimating the geographic distribution of human
Tanapox and potential reservoirs using ecological
niche modeling
Benjamin P Monroe
*, Yoshinori J Nakazawa, Mary G Reynolds and Darin S Carroll
Abstract
Background:Tanapox virus is a zoonotic infection that causes mild febrile illness and one to several nodular skin lesions. The disease is endemic in parts of Africa. The principal reservoir for the virus that causes Tanapox is unknown, but has been hypothesized to be a non-human primate. This study employs ecological niche modeling (ENM) to determine areas of tropical Africa suitable for the occurrence of human Tanapox and a list of hypothetical reservoirs. The resultant niche model will be a useful tool to guide medical surveillance activities in the region. Methods:This study uses the Desktop GARP software to predict regions where human Tanapox might be expected to occur based on historical human case locations and environmental data. Additional modeling of primate species, using occurrence data from museum records was performed to determine suitable disease reservoirs.
Results:The final ENM predicts a potential distribution of Tanapox over much of equatorial Africa, exceeding the borders of Kenya and Democratic Republic of Congo (DRC) where it has been historically reported. Five genera of non-human primates were found to be potential reservoir taxa.
Conclusions:Validity testing suggests the model created here is robust (p < 0.04). Several genera of primates were identified as having ENMs overlapping with that of Tanapox and are suggested as potential reservoirs,
mainly members of the GenusCercopithecus. The ENM modeling technique has several limitations and results
should be interpreted with caution. This study may increase knowledge and engage further research in this neglected disease.
Keywords:Poxvirus, Environmental niche modeling, Disease reservoir
Background
Tanapox virus, a member of the genusYatapoxvirus, is a zoonotic virus that causes mild febrile illness and nodu-lar skin lesions in humans and non-human primates [1,2]. The virus is sufficiently distinct from the related orthopoxviruses –including variola, and monkeypox— that traditional smallpox vaccination offers no cross-reactive immunity to Tanapox [3]. The disease was first observed among humans living in the flood plain of Kenya’s Tana River in 1957 [4]. Additional instances of human disease have been reported in animal handlers at primate facilities in the United States and among
international travelers who visited tropical Africa [5-7]. As well, Tanapox was reported extensively from the Democaratic Republic of Congo (DRC) during the period of heightened surveillance post-smallpox eradication.
Clinical disease in humans begins with a febrile pro-drome (fever 38-39°C) that can include headache, back-ache, prostration, and lymphadenopathy. This period lasts for 1–2 days and is followed by lesion development. Lesions evolve to become firm, deep-seated, elevated nodules reaching 20 mm in diameter, which frequently break or become ulcerated, often leading to secondary infections. A patient may have only a single nodule, presumably at the site of virus entry into the skin, or Tanapox lesions can occur in crops of 2–10 [8]. Lesions typically resolve after 6 to 8 weeks with scarring often present [9]. The disease is rarely reported and may be * Correspondence:[email protected]
Division of High-Consequence Pathogens and Pathology, Centers for Disease Control and Prevention, 1600 Clifton Road NE, Mailstop A-30, Atlanta, GA 30333, USA
confused with scabies, insect bites, or tropical ulcers [2]. An additional factor for low reporting may could be that patients with limited resources may also avoid seeking medical care as the disease has a relatively be-nign course.
Over a 40-year period from 1957 to 2003 human Tanapox disease has been sporadically identified across the breadth of Africa; spanning more than 6,000 kilome-ters from Sierra Leone to Tanzania [4-8]. The area cov-ered includes a range of climatic aspects and several distinct ecological regions [10]. Tanapox is a zoonosis, with non-human primates highlighted as prospective reser-voirs [11] (Additional file 1). Studies conducted in Kenya in 1971, after a large outbreak of Tanapox, revealed an as-sociation between the prevalence and activity patterns of biting arthropods and Tanapox occurrence leading to the suggestion that arthropods may play a role in outbreaks of human disease [12]. It is conceivable that biting insects could play a role in transmitting the virus mechanically, by moving the virus passively via mouthparts from one person to another.
The sporadic nature of human Tanapox renders trad-itional prospective epidemiology studies for determin-ation of risk impracticable. Human Tanapox is not a reportable disease in endemic regions, so traditional sur-veillance systems will not reliably enumerate cases. Med-ical staff in these areas may be insufficiently trained to recognize the symptoms of Tanapox, and modern diag-nostic testing is generally not available. Novel methods for determining disease risk are needed. Here we focus on identifying presumptive zoonotic risks by searching for ecologic commonalities between where Tanapox oc-curs and the likely reservoir species that live there.
Due to the high diversity of mammalian taxa which interact with humans in these regions it can be very dif-ficult to determine particular taxa involved in disease transmission. For the purpose of this study we have as-sumed that primates are the likely reservoir based on laboratory findings that indicated only primates show evidence of productive infection after being experimen-tally inoculated [4]. Other taxa examined, which did not demonstrate Tanapox virus-induced illness, include calves, lambs, pigs, goats, rabbits, guinea-pigs, and mice [4]. Many species of primates exist in the locations where human disease occurs. Human-primate interactions are also common in these locations, where primates may be sold, kept as pets, or serve as agricultural pests [13]. The ecological niche modeling (ENM) technique known as the Genetic Algorithm for Rule-Set Production (GARP) relates ecological information from the landscape of disease to create a set of rules that define factors asso-ciated with disease presence [14]. The final result, an (ENM) can be rendered on a map depicting the poten-tial geographic distribution for the pathogen. This study
uses the Desktop version of GARP to model the pre-dicted presence of human Tanapox from case locations available in the literature and records from Centers for Disease Control and Prevention (CDC) and World Health Organization (WHO) surveillance activities. In addition, we evaluate a list of potential primate reservoirs to determine which have ranges that coincide with hu-man Tanapox.
Results
Ecological niche modeling
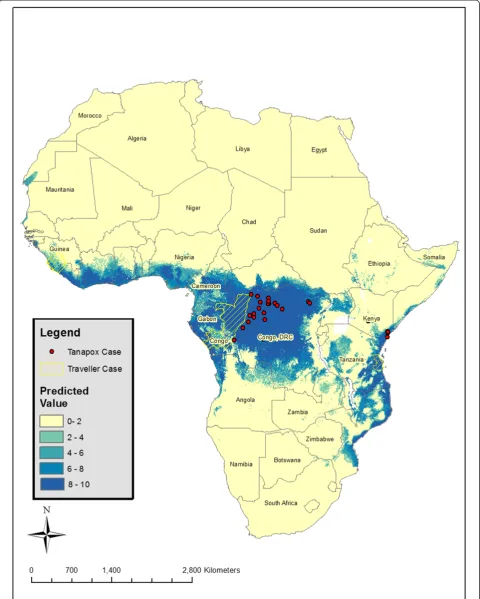
Niche models were generated according to the methods outlined by Stockwell [14] and are described in detail below. Due to incomplete geographic reference informa-tion, only 30 unique occurrence locations (8 from Kenya and 22 from DRC) from 214 enumerated human cases could be assigned coordinates accurate to 0.01 decimal degrees (Figure 1). The final 10-subset model predicted the presence of human Tanapox at 28 (93.3%) case loca-tions The final model predicts a potential distribution of Tanapox over much of equatorial Africa with the areas with the highest predicted values including a majority of forested Central Africa (DRC, Republic of Congo, Gabon Guinea and Cameroon), coastal East Africa (Kenya, Tanzania, and Mozambique), and West Africa (Nigeria, Togo, Ghana, Ivory Coast, Liberia, and Sierra Leone) (Figure 2). Isolated areas of Guinea-Bissau, Northern Uganda, and Malawi (surrounding Lake Malawi) were also potentially suitable for human Tanapox. Additional modeling iterations, each performed after eliminating a single environmental layer (jackknife analysis), revealed that the layers with most influence on model projections were maximum temperature, minimum temperature, and precipitation (I = 0.728, 0.738, and 0.741 respectively) (Table 1).
Model robustness
The ENMs created for Tanapox with Desktop GARP reached the predetermined convergence threshold of 0.01 prior to the maximum of 1,000 iterations. This study employed a previously described partial ROC ana-lysis to compare the performance of the model at biologically plausible thresholds of sensitivity and spe-cificity [15]. An AUC ratio of 1.35 (p > 0.04, null value =1) was calculated from the partial ROC analysis; indicating that the model predicts occurrence points better than would occur at random.
northeast-southwest quadrants, 15 of 17 points (88.2%) were predicted as suitable for Tanapox.
Reservoir analysis
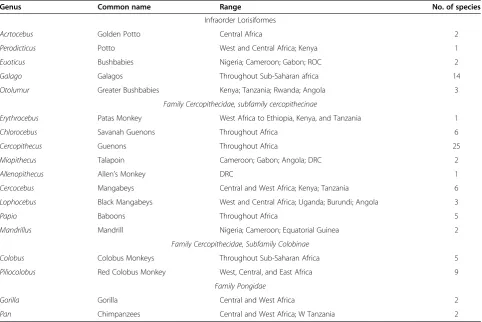
A review ofWilson and Reeder’s Mammal Species of the World, 3rd editionfound eighteen genera of primates to have distributions that include countries from which his-torical cases of Tanapox have been reported (Republic of Congo, DRC, Tanzania, Kenya, and Sierra Leone) [16] (Table 2). The geographic ranges of these primates were compared on the basis of range overlap to the distribu-tion of human Tanapox in Africa. Of these genera, 13 were excluded from further consideration based on ex-tremely isolated or broad primate ranges compared to the Tanapox ENM based on human disease occurrences. The five remaining primate genera were Galago, Cerco-pithecus, Cercocebus, Colobus, and Pan. ENMs for spe-cies within each of the highlighted genera were created with point data derived from the latitude and longitude
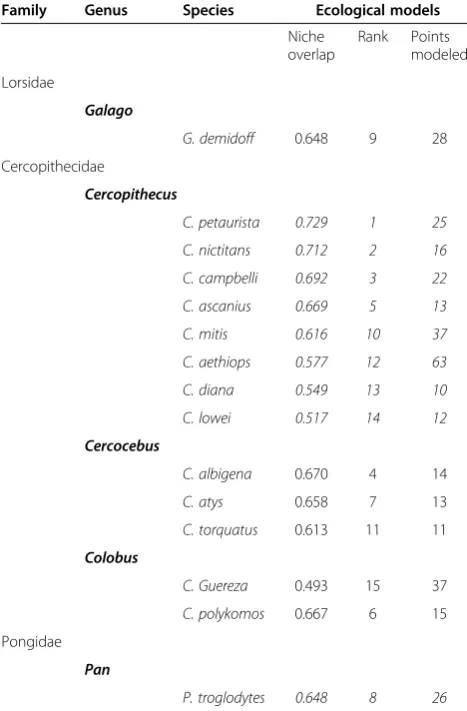
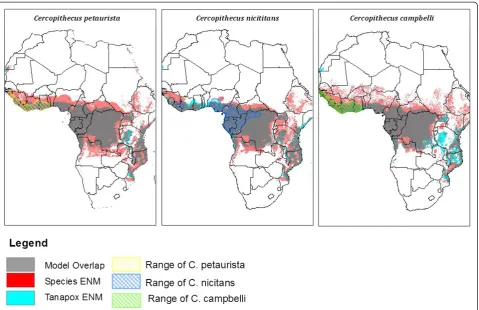
of collection from museum specimens (http://data.gbif. org/welcome.htm). Sufficient data were available to cre-ate ENMs of 15 species within the selected genera. The species with the highest agreement are shown in Table 3. Several Cercopithecus species (C. petaurista, C. nicitans, C. campbelli, C.ascanius) and Cercobus albigena had a potential range with a high degree of niche overlap. The potential distributions for these species often overlap geographically in West and Central Africa with some addition range area in Uganda, Kenya Zambia, and Angola (Figure 3).
Discussion
predicted areas in DRC and coastal Kenya would be ex-pected based on input data, the remaining areas indicate potential undescribed presence. In general the model pre-dicts that Tanapox could be found in areas of the continent with high temperatures and rainfall.
Three cases of Tanapox that were reported in travelers returning from Africa were not included in construction of the model because the precise geographic location of the presumed exposure is not known [5-7]. The general locations visited by the travelers included, southeast Republic of Congo, Bagamoyo district of Tanzania, and Sierra Leone. All three of these areas were broadly pre-dicted areas of Tanapox presence (Figure 2).
Among the advantages of using an ENM approach to identify geographic locales with the potential to support pathogen transmission, is the additional information that can be obtained from parsing out which ecologic fea-tures most influence the model’s predictive capacity. The identification of temperature (maximum and minimum) and precipitation as the environmental variables with the most influence may prove useful in determining the fauna responsible for disease transmission. The initial re-ports of Tanapox indicate flooding coinciding with an abundance of mosquito activity prior to the 1957 out-break [17]. This has led to a theory that insects might be involved in transmission. It has additionally been sug-gested that Tanapox nodules are more commonly found on the extremities because those areas are often not cov-ered by clothing and susceptible to biting insects [8].
Table 1 Summary of environmental characteristics used in creation of Tanapox ENM
Layer Hellinger’s I
Maximum temperature 0.728798459
Precipitation 0.738374454
Minimum temperature 0.741624095
Slope 0.743987125
Land Cover 0.756236193
Elevation 0.756455174
Flow Direction 0.760079558
Temperature Range 0.767203506
Mean Temperature 0.770258725
Compound Topographic Index 0.774950877
Hellinger’s I represents niche overlap with values between 1 (niches identical) and 0 (no relationship). Lower values represent more influence on
determination of final model.
Table 2 Summary of primates with ranges including countries where Tanapox has been described
Genus Common name Range No. of species
Infraorder Lorisiformes
Acrtocebus Golden Potto Central Africa 2
Perodicticus Potto West and Central Africa; Kenya 1
Euoticus Bushbabies Nigeria; Cameroon; Gabon; ROC 2
Galago Galagos Throughout Sub-Saharan africa 14
Otolumur Greater Bushbabies Kenya; Tanzania; Rwanda; Angola 3
Family Cercopithecidae, subfamily cercopithecinae
Erythrocebus Patas Monkey West Africa to Ethiopia, Kenya, and Tanzania 1
Chlorocebus Savanah Guenons Throughout Africa 6
Cercopithecus Guenons Throughout Africa 25
Miopithecus Talapoin Cameroon; Gabon; Angola; DRC 2
Allenopithecus Allen’s Monkey DRC 1
Cercocebus Mangabeys Central and West Africa; Kenya; Tanzania 6
Lophocebus Black Mangabeys West and Central Africa; Uganda; Burundi; Angola 3
Papio Baboons Throughout Africa 5
Mandrillus Mandrill Nigeria; Cameroon; Equatorial Guinea 2
Family Cercopithecidae, Subfamily Colobinae
Colobus Colobus Monkeys Throughout Sub-Saharan Africa 5
Piliocolobus Red Colobus Monkey West, Central, and East Africa 9
Family Pongidae
Gorilla Gorilla Central and West Africa 2
Pan Chimpanzees Central and West Africa; W Tanzania 2
Temperature and precipitation are often linked to insect development, and their influence here may support the theory of arthropod transmission [18].
Several of the primate ENMs used in this study have a high degree of overlap with the ENM created from human Tanapox. In general, areas of West, Central, and Coastal East Africa appear to have environmental aspects suitable for both the highlighted Cercopithecus
andCercocebus genera and human Tanapox. No single
species, however, was able to be highlighted as a res-ervoir. Additionally, the primates with the highest de-gree of spatial overlap have ranges restricted to West and Central Africa, and therefore are unable to cause human disease in Kenya. This may indicate that the ENMs for both Tanapox and the hypothesized pri-mates are simply ‘finding the forests’or that a pool of primate species may host the virus. A scenario where overlapping primate ranges with similar environmental characteristics like rainfall and temperature may allow
the pathogen to spread from one side of the continent to the other.
Primates have been implicated in Tanapox disease based on both infections at animal facilities and obser-vations of primates in areas where human disease oc-curred. Cercopithecus and Cercocebus monkeys were noted as present in areas with frequent Tanapox infec-tions in Kenya and have been found to have neutralizing antibodies to the Tanapox virus in laboratories [4,19]. The genus Cercopithicus contains the most widespread primates in Africa, and are often found in areas that have undergone environmental change associated with human activity including clearing forest for roads, log-ging, and crop cultivation [20]. Cercopithicus nictitans are known to disperse throughout narrow riverine areas, and have a distribution that closely mirrors river basins. Cercocebusmangabeys are noted to be mainly terrestrial and often inhabit areas close to rivers; areas often men-tioned in Tanapox outbreaks in Kenya. These primates inhabit the habitat surrounding human settlements and are often found raiding farms, hunted for meat, or kept as pets [20].
Omnivorous primates known to subsist on fruits and insects in undisturbed forest, will raid crops in forest fragments created by encroaching agriculture. Periods of heightened crop raiding closely mirror peak agriculture production following seasonal rains (primates may prefer cultivated maize to wild fruits) [21]. Humans in these areas have additional exposure to primates while enter-ing forest fragments for daily activities (collectenter-ing fire-wood or water) [21]. The red-tailed monkey,Cercopithecus ascanius, show a proclivity for crop raiding and residents in communities bordering Kibale National Park in Uganda were more likely to harbor bacteria similar to those found inC. ascanius, than other forest primate species [22]. Pri-mates that live in close proximity to humans and have be-havior that would facilitate human-primate interactions may similarly facilitate Tanapox transmission and warrant future investigation.
This type of modeling has several limitations, and cau-tion is necessary during interpretacau-tion. This analysis is based on the location of human cases, which can often be improperly reported and serve only as a proxy to the complex ecological interactions necessary to model the actual pathogen [23]. The coarse spatial resolution (1 km) of the environmental data used in modeling is also a limiting factor in the spatial resolution in the final map. The ENMs for primates relied on data available from online databases and models could only be con-structed for species with sufficient data. While results are given at the species level, they should be interpreted in a broader context. GARP models predict areas of po-tentially suitable habitat or potential niche, not necessar-ily the current range or realized niche of a species [24].
Table 3 Comparison of selected primate and human Tanapox ENMs
Family Genus Species Ecological models
Niche overlap
Rank Points modeled
Lorsidae
Galago
G. demidoff 0.648 9 28
Cercopithecidae
Cercopithecus
C. petaurista 0.729 1 25
C. nictitans 0.712 2 16
C. campbelli 0.692 3 22
C. ascanius 0.669 5 13
C. mitis 0.616 10 37
C. aethiops 0.577 12 63
C. diana 0.549 13 10
C. lowei 0.517 14 12
Cercocebus
C. albigena 0.670 4 14
C. atys 0.658 7 13
C. torquatus 0.613 11 11
Colobus
C. Guereza 0.493 15 37
C. polykomos 0.667 6 15
Pongidae Pan
P. troglodytes 0.648 8 26
This may be especially so with primates, where complex social and behavioral characteristics may govern habitat selection. This method of investigation is not meant to serve as a replacement for biologic or epidemiologic studies, but instead serves as a way to renew research in-terests in a long-neglected disease.
Conclusions
The creation of an ENM for Tanapox predicts a range that includes areas of historical presence, recent anec-dotal reports from travellers, and an expanded area of favourable ecological habitat. Also presented here is a short list of primates that have ecological ranges con-cordant with human Tanapox and may serve as suitable disease reservoirs. In the fifty years since the disease was first isolated, only a handful of articles have been pub-lished on the subject. This study aimed to use ecological modeling techniques to provide additional evidence to an often-neglected disease burden in humans. The re-sults of this research are a step to improving the abil-ity of healthcare workers in resource-limited areas of Africa to diagnose and enhance surveillance for cases of Tanapox. It is hoped this research can be used as a
guide to maximize future research by limiting the time and effort spent sampling in areas with low environ-mental suitability and highlighting a short list of pir-mates that might serve as sylvatic hosts or reservoirs of this diseae.
Methods
Tanapox occurrence data
214 (90.2%) of the records at 30 distinct locations (8 from Kenya and 22 from DRC) could be assigned specific coor-dinates (Additional file 3).
Case localities may not account for the actual place of infection if persons traveled in order to visit a health fa-cility or if the location was not georeferened properly. To account for the uncertainty associated with acquiring disease, 10 randomly generated points within a circular buffer surrounding each case were selected for modeling as described by Nakazawa et al. [25]. Cases from DRC and Kenya were assigned 20 km and 50 km polygons re-spectively to account for movement of persons before the case was reported (Cases in Kenya were given a lar-ger polygon to account for a lonlar-ger time span before a case was identified). No person-to-person transmission has been reported for Tanapox so each of these cases can be considered as an independent wildlife-to-human infection, allowing polygons to be weighted for multiple cases at a single location. The modeling procedure was performed with 10 unique datasets that contained 214 randomly generated points representing each reported case selected from within 30 distinct polygons represent-ing the distinct location where cases were reported. The final model was created by aggregating the 10 binary (1 = presence, 0 = absence) output models on a pixel by pixel basis. Data describing a suite of 10 environmental characteristics were available for 29 locations (one location was masked by water).
Environmental data
Environmental data used to create the ENMs included 10 distinct geographic layers from three main sources (1) Climatic data representing the period 1950–2000, in-cluding layers representing annual mean temperature, maximum temperature, minimum temperature, diurnal temperature range, and precipitation obtained from the WorldClim data set [26]. (2) Topographical and hydro-logical data representing elevation, slope, aspect ratio, compound topographic index (water pooling), were de-rived from the United States Geological Survey’s Hydro-1 K dataset (http://eros.usgs.gov/#/Find_Data/Products_ and_Data_Available/gtopo30/hydro/africa). (3) Categorized landcover data for Africa available from the International Steering Committee for Global Mapping (ISCGM, http:// 211.19.49.27/gmd/download/glcnmo.html). All analyses were carried out using a spatial resolution of 0.01° (approximately 100 m2 pixels) with ArcGIS version 9.3 (ESRI, Redlands, CA).
Ecological Niche Modeling of Tanapox
ENMs were built using Desktop GARP (http://www. nhm.ku.edu/desktopgarp/). GARP uses an evolutionary computing method applied to a random set or rules (bioclimatic rules, range rules, logistic regression) that
are ‘evolved’ in an iterative process to maximize the predictive ability of the model and has been described thoroughly [14,27]. For this investigation, each of the 10 occurrence datasets was run 20 times, resulting in 200 total GARP models. Within each dataset, 19 of the 20 models were filtered out using the“best subsets selec-tion parameters”available in the software (‘soft’omission threshold of 10% and 50% commission threshold) [24]. The selected model from each of the 10 datasets was combined to show agreement between runs and to pro-duce an overall prediction map. The number of times out of 10 that a specific pixel was predicted was symbol-ized with color gradations (darker representing higher model agreement) (Figure 2) of the map representing continental Africa.
Model robustness
A method to determine the ability of an ENM to predict a poxvirus into an area where no occurrence data are represented has been described as the ‘quadrant test’ [28]. Occurrence points were divided into four quad-rants based on their position above or below longitude and latitude of the central point (22.758 E, 1.893 N). ENMs were trained with points from two oblique quad-rants (e.g. northwest and southeast) with points in the remaining quadrants used to independently test model predictability. The reciprocal process was repeated for the remaining quadrants. A final method used to test model quality was the modified receiver operating char-acteristic curve (ROC) outlined by Peterson et al. [15].
Principal environmental factors
In order to explore the effect of each environmental characteristic to the overall model jackknife procedure was performed similar to what has been published else-wherere [29]. Niche identity tests were performed on the Tanapox ENM to compare each of the jackknifed models to the map including all environmental layers. It was assumed that models missing key environmen-tal characteristics would have the highest divergence from the human Tanapox model. The suite of models was ranked in ascending order with the ENM tools soft-ware package (retrieved from http://enmtools.blogspot. com/search?q=cite).
Reservoir analysis
mammals (http://www.iucnredlist.org/technical-documents/ spatial-data). Using the map comparison kit software (http://www.riks.nl/mck/), overlap between the primate ranges and the human Tanapox ENM was determined by Fuzzy Kappa. The five genera with the highest agreement were selected for further analysis. Within these genera, occurrence points were available for 15 species from the Global Biodiversity Information Facility (http://data. gbif.org/occurrences/). Species with over 25 occurrence points were modelled 50% training-50% testing. Species with less that had less than 25 points were 100% training. GARP models were developed for each species independ-ently using the same environmental layers for the human Tanapox ENM. Species distributions were compared to human Tanapox on the basis of niche overlap from Hellenger distance estimation in the ENM Tools soft-ware package.
Additional files
Additional file 1:Summary of primates with published links to Tanapox.Included are anecdotal reports from the literature of primates possibly associated with Tanapox.
Additional file 2: Table S2.Coordinates for Tanapox case locations.
Additional file 3:Coordinates for primate species records used in ENM modeling.Data from www.gbif.org was used to create ENMs for the 15 primate species.
Competing interests
The authors declare that they have no competing interests.
Authors’contributions
The study design was conducted by BM, MR, and DC. Analysis was performed by BM and YN. Manuscript was written by BM, YN and MR. All authors read and approved the final manuscript. The findings and conclusions in this publication are those of the authors and do not necessarily represent the views of the Centers for Disease Control and Prevention.
Acknowledgements
The authors would like to thank the following individuals for technical expertise and data provisions without which this project would not have been possible: J Nakano, CDC; I Damon, CDC; R Lash, CDC; A Roess, George Washington University; R Levine, Emory University; M Strickland, Emory University.
Received: 13 June 2014 Accepted: 27 August 2014 Published: 25 September 2014
References
1. Fenner F:Wallace P. rowe lecture. poxviruses of laboratory animals.
Lab Anim Sci1990,40:469–480.
2. Knipe DM, Howley PM:Fields Virology.InPoxviruses.5th edition. Edited by Damon IK. Philadelphia, PA: Lippincott Williams & Wilkins; 2007.
3. Balows A, Hausler WJ, Ohashi M, Turano A:Laboratory diagnosis of infectious diseases: principles and practice. Bacterial, mycotic, and parasitic diseases.
New York: Springer-Verlag; 1988.
4. Downie AW, Taylor-Robinson CH, Caunt AE, Nelson GS, Manson-Bahr PE, Matthews TC:Tanapox: a new disease caused by a pox virus.Br Med J
1971,1:363–368.
5. Croitoru AG, Birge MB, Rudikoff D, Tan MH, Phelps RG:Tanapox virus infection.Skinmed2002,1:156–157.
6. Dhar AD, Werchniak AE, Li Y, Brennick JB, Goldsmith CS, Kline R, Damon I, Klaus SN:Tanapox infection in a college student.New England J Med2004,
350:361–366.
7. Stich A, Meyer H, Kohler B, Fleischer K:Tanapox: first report in a European traveller and identification by PCR.Trans R Soc Trop Med Hyg2002,
96:178–179.
8. Jezek Z, Arita I, Szczeniowski M, Paluku KM, Ruti K, Nakano JH:Human tanapox in Zaire: clinical and epidemiological observations on cases confirmed by laboratory studies.Bull World Health Organ1985,
63:1027–1035.
9. Lewis-Jones S:Zoonotic poxvirus infections in humans.Curr Opin Infect Dis
2004,17:81–89.
10. Olson DM, Dinerstein E, Wikramanayake ED, Burgess ND, Powell GVN, Underwood EC, D’amico JA, Itoua I, Strand HE, Morrison JC, Loucks CJ, Allnutt TF, Ricketts TH, Yumiko K, Lamoreux JF, Wettengel WW, Prashant H, Kassem KR:Terrestrial ecoregions of the world: a new map of life on earth.Bioscience2001,51:933–938.
11. Luby JP:Another zoonosis from monkeys: tanapox.Ann Intern Med1971,
75:800–801.
12. Manson-Bahr PE, Downie AW:Persistence of tanapox in Tana River valley.
Br Med J1973,2:151–153.
13. Hill C:Conflict of interest between people and baboons: crop raiding in Uganda.Int J Primatol2000,21:299–315.
14. Stockwell D:Genetic Algorithms II.InMachine Learning Methods for
Ecological Applications.Edited by Fielding AH. Norwell, MA: Kluwer
Academic Press; 1999:123–144.
15. Peterson AT, Papes M, Soberón J:Rethinking receiver operating characteristic analysis applications in ecological niche modeling.
Ecol Model2008,213:63–72.
16. Wilson DE, Reeder DM:Mammal species of the world : a taxonomic
and geographic reference.3rd edition. Baltimore: Johns Hopkins
University Press; 2005.
17. Downie AW, Espana C:Comparison of Tanapox virus and Yaba-like viruses causing epidemic disease in monkeys.J Hygiene1972,70:23–32. 18. Macdonald G:The analysis of malaria epidemics.Trop Dis Bull1953,
50:871–889.
19. Downie AW:The epidemiology of tanapox and yaba virus infections.
J Med Microbiol1972,5:Pxiv.
20. Kingdon J:The Kingdon field guide to African mammals.Princeton: Princeton University Press; 2003.
21. Pienkowski MW, Watkinson AR, Kerby G, Naughton-Treves L, Treves A, Chapman C, Wrangham R:Temporal patterns of crop-raiding by primates: linking food availability in croplands and adjacent forest.J Appl Ecol1998,
35:596–606.
22. Goldberg TL, Gillespie TR, Rwego IB, Estoff EL, Chapman CA:Forest fragmentation as cause of bacterial transmission among nonhuman primates, humans, and livestock, Uganda.Emerg Infect Dis2008,
14:1375–1382.
23. Peterson AT:Ecological niche modelling and understanding the geography of disease transmission.Vet Ital2007,43:393–400. 24. Anderson RP, Lew D, Peterson AT:Evaluating predictive models of
species’distributions: criteria for selecting optimal models.Ecol Model
2003,162:211–232.
25. Nakazawa Y, Williams R, Peterson AT, Mead P, Staples E, Gage KL:Climate change effects on plague and tularemia in the United States.Vector Borne
Zoonotic Dis2007,7:529–540.
26. Hijmans RJ, Cameron SE, Parra JL, Jones PG, Jarvis A:Very high resolution interpolated climate surfaces for global land areas.Int J Climatol2005,
25:1965–1978.
27. Peterson AT, Sanchez-Cordero V, Ben Beard C, Ramsey JM:Ecologic niche modeling and potential reservoirs for Chagas disease, Mexico.Emerg Infect Dis2002,8:662–667.
28. Levine RS, Peterson AT, Yorita KL, Carroll D, Damon IK, Reynolds MG:
Ecological niche and geographic distribution of human monkeypox in Africa.PLoS One2007,2:e176.
29. Peterson AT, Cohoon KP:Sensitivity of distributional prediction algorithms to geographic data completeness.Ecol Model1999,117:159–164.
doi:10.1186/1476-072X-13-34
Cite this article as:Monroeet al.:Estimating the geographic distribution
![Figure 1 Reported locations of Tanapox cases, 1971–1986. Cases of human Tanapox were identified from World Health Organizationsmallpox eradication records in the Democratic Republic of Congo and from published reports from Kenya [12].](https://thumb-us.123doks.com/thumbv2/123dok_us/773585.2073348/3.595.60.538.88.453/reported-locations-identified-organizationsmallpox-eradication-democratic-republic-published.webp)