REVIEW
The role of optical coherence
tomography in Alzheimer’s disease
Leonardo Provetti Cunha
1,2*, Ana Laura Maciel Almeida
3, Luciana Virgínia Ferreira Costa‑Cunha
2,
Carolina Ferreira Costa
2and Mário L. R. Monteiro
4Abstract
Background: Alzheimer’s disease (AD) is the most common cause of dementia and its incidence is increasing
worldwide along with population aging. Previous clinical and histologic studies suggest that the neurodegenerative process, which affects the brain, may also affect the retina of AD patients.
Main body: Optical coherence tomography (OCT) is a non‑invasive technology that acquires cross‑sectional images
of retinal structures allowing neural fundus integrity assessment. Several previous studies demonstrated that both peripapillary retinal nerve fiber layer and macular thickness measurements assessed by OCT were able to detect neu‑ ronal loss in AD. Moreover, recent advances in OCT technology, have allowed substantial enhancement in ultrastruc‑ tural evaluation of the macula, enabling the assessment not only of full‑thickness retinal measurements but also of inner retinal layers, which seems to be a promising approach, mainly regarding the assessment of retinal ganglion cell layer impairment in AD patients. Furthermore, retinal neuronal loss seems to correlate with cognitive impairment in AD, reinforcing the promising role of OCT in the clinical evaluation of these patients.
Conclusion: The purpose of this article is to review the main findings on OCT in AD patients, to discuss the role of
this important diagnostic tool in these patients and how OCT technology may be useful in understanding morpho‑ logical retinal changes in AD.
Keywords: Alzheimer’s disease, Mild cognitive impairment, Dementia, Optical coherence tomography, Macula,
Retina, Optic nerve, Retinal nerve fiber layer, Ganglion cell layer
© 2016 The Author(s). This article is distributed under the terms of the Creative Commons Attribution 4.0 International License (http://creativecommons.org/licenses/by/4.0/), which permits unrestricted use, distribution, and reproduction in any medium, provided you give appropriate credit to the original author(s) and the source, provide a link to the Creative Commons license, and indicate if changes were made. The Creative Commons Public Domain Dedication waiver (http://creativecommons.org/ publicdomain/zero/1.0/) applies to the data made available in this article, unless otherwise stated.
Background
Alzheimer’s disease (AD) is the most common cause of dementia and its incidence is increasing worldwide asso-ciated with population aging [1]. AD is characterized by progressive cognitive impairment, such as memory defi-cit, decline in learning and executive functioning, apha-sia, apraxia, agnosia and visual abnormalities [2, 3].
Visual complaints are common findings in AD patients and these may have an important impact on autonomy and quality of life of these patients. The most common visual symptoms are impairment of spatial contrast sensi-tivity, motion perception, color discrimination and visual
loss, which in the past, were attributed to lesions affect-ing the primary visual cortex and other specific areas of the brain [3–6]. Neuroimaging techniques are essential in the diagnosis of AD and magnetic resonance imaging (MRI) has become the most used tool for cerebral imag-ing in AD patients, providimag-ing detailed information about brain structure. The most common findings in MRI of patients with AD are atrophy in the medial temporal lobe, including hippocampus, amygdala, entorhinal cor-tex and parahippocampal gyrus, ventricular enlargement and reduction of total brain volume [7]. Although stud-ies have not yet completely elucidated the structural and functional changes that occur in brains of AD patients, some clinical and histologic studies suggest that the same neurodegenerative process that occurs in the brain, may also affect the retina, since the latter represents a periph-eral part of central nervous system. Retinal pathological
Open Access
*Correspondence: leonardo_provetti@yahoo.com.br
1 Department of Ophthalmology, School of Medicine, Juiz de Fora Eye Hospital, Federal University of Juiz de Fora, Av. Barão do Rio Branco, 4051, Bom Pastor, Juiz de Fora, MG 36021‑630, Brazil
changes such as loss of retinal ganglion cell (RGC) and their axons were demonstrated, both in animal models and in post mortem studies of human AD eyes [8–11]. Toxic aminoacids, such as fibrillar tau and Aβ aggregates were accumulated within the retina and its microvascula-ture, and signs of neuroinflammation were present in the retina [12–16]. Therefore, according to several clinical and histologic studies there is strong evidence of anterior visual pathway impairment in AD patients, with pre-dominant involvement of RGC and their fibers [10, 11,
17–19].
Optical coherence tomography (OCT) is a non-inva-sive technology, which acquires cross-sectional images of retinal structures allowing neural fundus integrity assess-ment. Over the last years, OCT became the most widely used technology to detect and quantify structural axonal damage in many optic nerve and neurological diseases. Axonal loss is usually quantified by measuring OCT peri-papillary retinal nerve fiber layer (RNFL) that allows an indirect estimation of RGC layer impairment. Further-more, neuronal loss can be directly accessed by estimat-ing macular thickness measurements, since 30–35 % of the retina thickness in macular area is composed by the RGCs and their fibers, as previously demonstrated in eyes with glaucoma, papilledema, compressive or demyelinat-ing optic neuropathies [20–22]. If we take into account that the retina is considered a peripheral extension of the brain and both share similar embryological origin, it is easy to understand why OCT has become a widespread diagnostic tool in many neurological diseases.
Therefore, the purpose of this article is to address the main findings on OCT in AD patients, to discuss the role of this important diagnostic tool in these patients and how OCT technology could be useful to understand morphological retinal changes in AD.
Peripapillary retinal nerve fiber layer thickness in Alzheimer’s disease patients
The degeneration of the optic nerve and consequent loss of ganglion cells and their axons was first demonstrated histologically in patients with AD around 30 years ago [10]. Other studies confirmed these findings, revealing a predominant loss of the largest RGCs (M-cells) [11]. These post-mortem studies are clear evidence of anterior visual pathway impairment in AD patients. Hedges et al. [23] evaluated fundus photographs from 26 AD patients and found a high incidence of RNFL abnormalities.
With the advent of OCT, over the last two decades, it became possible to provide a directly clinical quantita-tive assessment of retinal axonal loss. Several previous studies have evaluated the peripapillary RNFL thickness measurements assessed by OCT and all of them were
able to demonstrate that most of RNFL parameters were reduced in patients with AD [19, 24–34]. The reduc-tion of RNFL thickness was significantly greater than that which is observed in the age-matched controls and thus cannot be exclusively ascribed to aging. In accord-ance with these studies, the reduction of RFNL thick-ness occurred in each of the four retinal quadrants, suggest that axonal loss in patients with AD seems to be the result of a diffuse degeneration process of RGCs. Global reduction of peripapillary RNFL average thick-ness measurements in AD patients was demonstrated by several independent groups [24, 28, 30, 31, 34]. Most of them observed a significant reduction of RNFL thickness in all quadrants [19, 24, 31, 35, 36], with a predominance in the superior [26–30] and inferior quadrants [24, 27, 30]. Different groups showed the axonal loss with RNFL reduction in AD patients, despite different commercially available OCT devices used [37, 38].
Thomson et al. [39] conducted a systematic review and meta-analysis of the literature to determine the diagnos-tic utility of OCT of the RNFL thickness measurements in various dementias, but focused predominantly in patients with AD and mild cognitive impairment (MCI). They included studies published until September 2014. They identified a total of 17 studies including 702 AD eyes and 790 control eyes. There was a significant reduc-tion in the overall, inferior and temporal RNFL thickness measurements in AD patients compared with controls, regardless of whether time domain (TD) or spectral domain (SD) OCT was used. The nasal and temporal quadrants are only found to be significantly thinner in few studies. These authors concluded that studies ana-lyzed in the systematic review suggest that the significant thinning of the RNFL does occur in AD, and that OCT can be successfully used to detect these changes.
In our review, we identified a total of 23 studies includ-ing 1330 AD eyes, 326 MCI eyes and 1082 control eyes. In nine studies TD-OCT was used and in the other four-teen, the patients were evaluated by SD-OCT. Seven studies included MCI [25, 28, 34, 35, 40–42] patients and others nine evaluated macular parameters [24–26, 31, 35, 40, 43–45]. Table 1 summarizes the demographic data and RNFL thickness measurements in Alzheimer’s dis-ease, MCI and controls by OCT.
Macular thickness measurements in Alzheimer’s disease patients
first because RGC’s and their fibers are located in macu-lar area, which in accordance with previous histopatho-logical studies, are preferably affected in AD [8, 9, 17], and secondly, because of the significant improvements occurred in the latest OCT’s equipments, evolving from time-domain (TD) to spectral fourier domain technology [52]. These improvements on OCT technology provide three-dimensional high-quality images with greater res-olution, with an axial resolution up to five times higher and imaging speeds approximately 60 times greater than earlier TD OCT [53, 54]. This high-density raster retinal tissue scanning allow to detect and segment the retinal structures in each raster OCT image and use these data to construct a detailed macular map, with separate analy-sis of different retinal layers [52].
Full thickness macular measurements
Iseri et al. [26] were the first group to assess both mac-ular thickness and volume by TD-OCT of 28 eyes of 14 patients with AD. The retinal thickness in all macu-lar quadrants of AD patients was lower than in control subjects and reached statistical significance in the nasal, temporal and inferior quadrants, as well to the mean total macular volume. Moschos et al. [33] also evaluated the macular parameters using TD-OCT in AD patients. They demonstrated a preferential involvement of the cen-tral macular area.
In SD-OCT era, Polo et al. [45] evaluated macular area by SD-OCT of 75 AD patients and 75 age-matched healthy subjects. Retinal thinning was observed in AD eyes in all areas except from the fovea. In other study, Gao et al. [25] evaluated 25 patients with AD and found a significant reduction of macular volume in these patients. Salobrar-Garcia et al. [50] also demonstrated a pref-erential reduction of macular parameters in mild-AD patients. In this study, the peripapilary RNFL thickness was thinner, but did not reach a significant difference compared with age-matched controls, suggesting a pref-erential involvement of the macula in early stages of the disease.
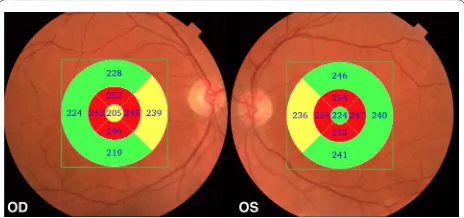
In a recently published study [24], we have evaluated 45 eyes of 24 patients with AD using SD-OCT. Our results showed that the macula full-thickness measurements were significantly reduced in all segments, except in the inferior outer segment. The inner segments, around the fovea, were the most affected (Figs. 1, 2). This was an interesting finding and possibly indicates a pattern of neuronal loss in patients with AD. In agreement with our findings, Blank et al., in a histologically analysis, observed a total decrease of one quarter of neurons in GCL at the level of the fovea and parafoveal area of the retina in AD patients [9].
Inner retinal layers in Alzheimer’s disease patients
In the last decade, the spectral OCT technology evolved significantly allowing for creating high-resolution cross-sectional images. The acquisition speed in SD-OCT reduced the time to acquire three-dimensional images with higher resolution, enhancing the ultrastructural macula analysis, enabling the assessment not only of full macular thickness measurements but also of inner reti-nal layers. These layers are of particular interest in many ocular and neurological diseases and recent studies based on OCT measurements have demonstrated that the pres-ence of RGC loss may be an early indicator of neural loss in many conditions, such as glaucoma, papilledema, compressive optic neuropathy, multiple sclerosis and optic neuromyelitis [55–58]. This approach may be promising in AD evaluation, especially because the RGC impairment shares similarities with neuronal loss in the brains of these patients. In fact, the reduction of full mac-ular thickness, as shown in previous studies, is possibly related to the preferential involvement of the ganglion cell layer (GCL) [25, 26, 33, 45].
In 2013, Marziani et al. [31] using SD-OCT, demon-strated a reduction of RNFL + GCL thickness in the nine ETDRS subfields map in AD patients compared with age-matched controls. With the same SD-OCT, another group [43] demonstrated that the average, superior and inferior GCL thickness of the AD patients were signifi-cantly thinner than those of the controls. Cheung et al. [59] showed a significantly reduced macular ganglion cell-inner plexiform layer thicknesses in all macular sectors in AD patients compared with cognitively nor-mal controls. In our study [24], the inner macular layers thickness measurements were automatically registered in a square pattern (6 × 6 mm). In each B-scan, the bounda-ries between the anatomical inner retinal layers in macu-lar area were automatically delimited by built-in software (Fig. 3). The parameters registered in this study were: the average of macular retinal nerve fiber layer (mRNFL) thickness, the average of GCL plus the inner plexiform layer (IPL) thickness, referred as GCL+ and the aver-age of RNFL plus GCL+ thickness, referred as GCL++ (Fig. 3). A pseudo-color thickness map of these layers is shown in Figs. 2 and 3. Our results demonstrate that the GCL+ and GCL++ thickness were significantly lower in eyes of AD patients. The mRNFL thickness measure-ments in AD eyes were lower than in control eyes, but did not reach statistical significance. Our results dem-onstrated that inner retinal layers impairment reflect the neuronal degeneration of the retina in AD patients, pre-dominantly affecting the central macular area.
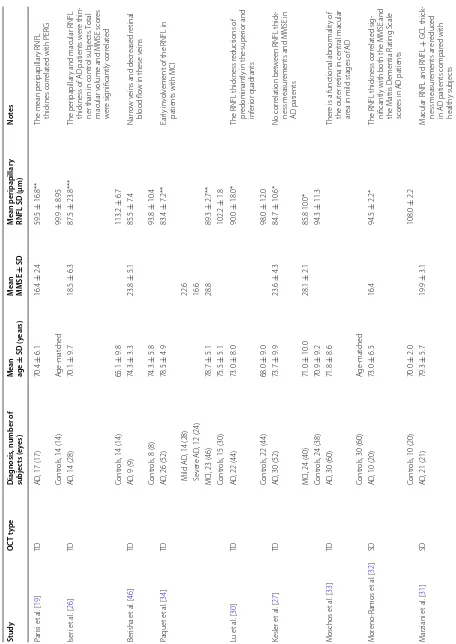
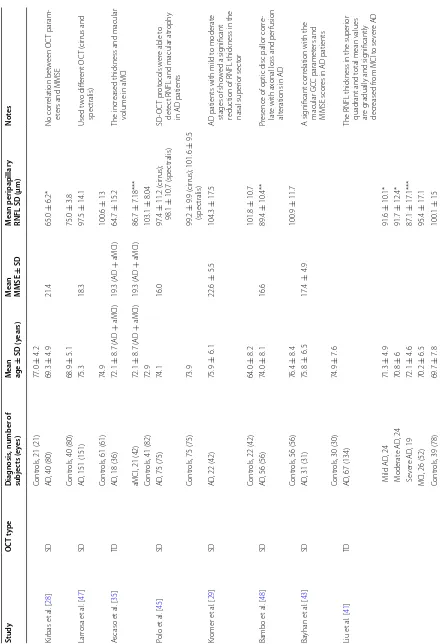
Table 1 Demo gr aphic da ta and r etinal ner ve fib er la yer thick ness measur emen ts in A lzheimer ’s disease
, mild c
ognitiv e impairmen t and c on tr ols b y OC T Study OC T t ype D iag nosis
, number of
subjec ts (e yes) M ean age ± SD (y ears) M ean MMSE ± SD M ean peripapillar y
RNFL SD (µm)
Not es Par isi et al . [ 19 ] TD AD
, 17 (17)
70.4 ± 6.1 16.4 ± 2.4 59.5 ± 16.8**
The mean per
ipapillar
y RNFL
thick
nes cor
relat
ed with PER
G
Contr
ols
, 14 (14)
A ge ‑mat ched 99.9 ± 8.95 Iser i et al . [ 26 ] TD AD
, 14 (28)
70.1 ± 9.7 18.5 ± 6.3 87.5 ± 23.8*** The per ipapillar
y and macular RNFL
thick
ness of AD patients w
er
e thin
‑
ner than in contr
ol subjec
ts
. T
otal
macular v
olume and MMSE scor
es w er e sig nificantly cor relat ed Contr ols
, 14 (14)
65.1 ± 9.8 113.2 ± 6.7 Ber isha et al . [ 46 ] TD AD
, 9 (9)
74.3 ± 3.3 23.8 ± 5.1 85.5 ± 7.4 Nar ro w v
eins and decr
eased r
etinal
blood flo
w in these v
eins
Contr
ols
, 8 (8)
74.3 ± 5.8 93.8 ± 10.4 Paquet et al . [ 34 ] TD AD
, 26 (52)
78.5 ± 4.9 83.4 ± 7.2** Ear ly in volv
ement of the RNFL in
patients with MCI
M
ild AD
, 14 (28)
22.6
S
ev
er
e AD
, 12 (24)
16.6
MCI, 23 (46)
78.7 ± 5.1 28.8 89.3 ± 2.7** Contr ols
, 15 (30)
75.5 ± 5.1 102.2 ± 1.8 Lu et al . [ 30 ] TD AD
, 22 (44)
73.0 ± 8.0 90.0 ± 18.0*
The RNFL thick
ness r
educ
tions of
pr
edominantly in the super
ior and inf er ior quadrants Contr ols
, 22 (44)
68.0 ± 9.0 98.0 ± 12.0 Kesler et al . [ 27 ] TD AD
, 30 (52)
73.7 ± 9.9 23.6 ± 4.3 84.7 ± 10.6* No cor relation bet w
een RNFL thick
‑
ness measur
ements and MMSE in
AD patients
MCI, 24 (40)
71.0 ± 10.0 28.1 ± 2.1 85.8 10.0* Contr ols
, 24 (38)
70.9 ± 9.2 94.3 ± 11.3 M oschos et al . [ 33 ] TD AD
, 30 (60)
71.8
±
8.6
Ther
e is a func
tional abnor
malit
y of
the out
er r
etina in central macular
ar
ea in mild stages of AD
Contr
ols
, 30 (60)
A ge ‑mat ched M or eno ‑R amos et al . [ 32 ] SD AD
, 10 (20)
73.0 ± 6.5 16.4 94.5 ± 2.2*
The RNFL thick
ness cor
relat
ed sig
‑
nificantly with both the MMSE and the M
attis D
ementia R
ating S
cale
scor
es in AD patients
Contr
ols
, 10 (20)
70.0 ± 2.0 108.0 ± 2.2 M ar ziani et al . [ 31 ] SD AD
, 21 (21)
79.3 ± 5.7 19.9 ± 3.1 M
acular RNFL and RNFL
+ GCL thick ‑ ness measur ements ar e r educed
in AD patients compar
ed with
health
y subjec
Table 1 c on tinued Study OC T t ype D iag nosis
, number of
subjec ts (e yes) M ean age ± SD (y ears) M ean MMSE ± SD M ean peripapillar y
RNFL SD (µm)
Not
es
Contr
ols
, 21 (21)
77.0 ± 4.2 Kir bas et al . [ 28 ] SD AD
, 40 (80)
69.3 ± 4.9 21.4 65.0 ± 6.2* No cor relation bet w een OC T param ‑ et
ers and MMSE
Contr
ols
, 40 (80)
68.9 ± 5.1 75.0 ± 3.8 Lar rosa et al . [ 47 ] SD AD
, 151 (151)
75.3 18.3 97.5 ± 14.1 Used t w o diff er ent OC T ( cir rus and spec tralis) Contr ols
, 61 (61)
74.9 100.6 ± 13 A scaso et al . [ 35 ] TD AD
, 18 (36)
72.1 ± 8.7 ( AD + aMCI) 19.3 ( AD + aMCI) 64.7 ± 15.2 The incr eased thick
ness and macular
volume in aMCI
aMCI, 21 (42)
72.1 ± 8.7 ( AD + aMCI) 19.3 ( AD + aMCI) 86.7 ± 7.18*** Contr ols
, 41 (82)
72.9 103.1 ± 8.04 Polo et al . [ 45 ] SD AD
, 75 (75)
74.1 16.0 97.4 ± 11.2 ( cir rus); 98.1 ± 10.7 (spec tralis) SD ‑OC T pr ot ocols w er
e able t
o
det
ec
t RNFL and macular atr
oph
y
in AD patients
Contr
ols
, 75 (75)
73.9 99.2 ± 9.9 (cir rus); 101.6 ± 9.5 (spec tralis) Kr omer et al . [ 29 ] SD AD
, 22 (42)
75.9 ± 6.1 22.6 ± 5.5 104.3 ± 17.5
AD patients with mild t
o moderat
e
stages of sho
w
ed a sig
nificant
reduc
tion of RNFL thick
ness in the
nasal super
ior sec
tor
Contr
ols
, 22 (42)
64.0 ± 8.2 101.8 ± 10.7 Bambo et al . [ 48 ] SD AD
, 56 (56)
74.0 ± 8.1 16.6 89.4 ± 10.4** Pr
esence of optic disc pallor cor
re
‑
lat
e with ax
onal loss and per
fusion
alt
erations in AD
Contr
ols
, 56 (56)
76.4 ± 8.4 100.9 ± 11.7 Ba yhan et al . [ 43 ] SD AD
, 31 (31)
75.8 ± 6.5 17.4 ± 4.9 A sig nificant cor
relation with the
macular GC
C paramet
ers and
MMSE scor
es in AD patients
Contr
ols
, 30 (30)
74.9 ± 7.6 Liu et al . [ 41 ] TD AD
, 67 (134)
The RNFL thick
ness in the super
ior
quadrant and t
otal mean values
ar
e g
radually and sig
nificantly
decr
eased fr
om MCI t
o se ver e AD M ild AD , 24 71.3 ± 4.9 91.6 ± 10.1* M oderat e AD , 24 70.8 ± 6 91.7 ± 12.4* S ev er e AD , 19 72.1 ± 4.6 87.1 ± 17.1***
MCI, 26 (52)
70.2 ± 6.5 95.4 ± 17.1 Contr ols
, 39 (78)
Table 1 c on tinued Study OC T t ype D iag nosis
, number of
subjec ts (e yes) M ean age ± SD (y ears) M ean MMSE ± SD M ean peripapillar y
RNFL SD (µm)
Not es G ao et al . [ 25 ] SD AD
, 25 (50)
74.7 ± 1.3 19.2 ± 0.6 86 ± 1.9**
Reduced macular v
olume in AD
and MCI patients
, no cor
rela
‑
tion bet
w
een MMSE and OC
T
paramet
ers
aMCI, 25 (50)
73.4 ± 1.5 25.8 ± 0.35 92.4 ± 1.9* Contr ols
, 21 (42)
72.1 ± 1 98.6 ± 1.7 Okt em et al . [ 49 ] SD AD
, 35 (70)
75.4 ± 6.9 18.0 80.6 ± 9.6*** RNFL thick ness measur ements can
be useful f
or ear
ly diag
nosis and
evaluation of disease pr
og
ression
MCI, 35 (70)
74.1 ± 6.3 28.0 82.5 ± 7.3 Contr ols
, 35 (70)
70.2 ± 8.0 29.0 91.5 ± 7.1 Salobrar ‑G ar cia et al . [ 50 ] SD AD
, 23 (23)
79.3 ± 4.6 23.3 ± 3.1 Incr
ease in per
ipapillar y thick ness in mild ‑AD patients Contr ols
, 28 (28)
72.3 ± 5.1 Cunha et al . [ 24 ] SD AD
, 24 (45)
74.8 ± 6.2 17.0 ± 5.2 93.7 ± 13.4 Neur onal loss
, especially f
or macular paramet ers , cor relat ed w ell with cog nitiv e impair
ment in AD
Contr
ols
, 24 (48)
72.3 ± 7.3 103 ± 9.2 G ar cia ‑M ar tin et al . [ 51 ] SD AD
, 150 (150)
75.33 18.35 ± 3.33 95.7 ± 15.22 Per for med seg
mentation of all
retinal la yers . I nner r etinal la yers reduc tion ma y pr edic t g reat er disease se ver ity Contr ols
, 75 (75)
74.79 99.23 ± 16.48 Choi et al . [ 40 ] SD AD
, 42 (42)
76.8 ± 8.7 14.5 ± 5.5 Per for med seg
mentation of all
retinal la
yers
MCI, 26 (26)
74.7 ± 7.8 23.1 ± 4.6 86.6 ± 10.2 Contr ols
, 66 (66)
73.8 ± 7.5 AD A lzheimer ’s disease , MC I mild c og nitiv e impair men t, aM CI
amnestic mild c
og nitiv e impair men t, RNFL retinal ner
ve fiber la
yer , OCT optical c oher enc e t omog raph y, SD standar d devia tion, TD time -domain, SD ( OCT t yp e column ) spec tr al domain, MMSE mini men tal sta te e xamina tion, PER G pa tt er n-r ev ersal elec tr or etinog ram, GCL ganglion c ell la yer , G CC ganglion c ell c omple x * P < 0.05; ** P < 0.01; *** P
< 0.001 when c
information about the integrity of the other retinal layers is crucial. Recent advances in the SD-OCT technology, particularly with improvements in segmentation software analysis, may allow the measurement of all retinal layers. In a recently published study, Garcia-Martin et al. [51], using an automatic segmentation prototype, showed that not only inner retinal layers were reduced in AD patients, but the outer nuclear layers were also impaired. Studies are needed in order to verify the clinical significance of this finding in AD patients and if it’s an indicative of a dif-fuse degenerative process affecting all retinal layers or as result of retrograde transinaptic degeneration.
Correlation between RNFL and macular thickness measurements with the cognitive impairment in Alzheimer’s disease patients
Some of the crucial approaches for diagnosis of AD are based on neuropsychological tests such as the mini-men-tal state examination (MMSE) scores, which are widely used to evaluate the cognitive impairments in dementia patients [2]. So, since the measurement of the degree of severity of cognitive impairment can be given by MMSE score, it seems reasonable that the correlation between this psychological test and OCT parameters could be useful information for clinical evaluation and monitoring of these patients.
In fact, some previous studies have evaluated the cor-relation between OCT and MMSE score, but the results are somewhat conflicting. While some authors failed to demonstrate a significant correlation between the OCT parameters and MMSE scores [25, 27, 45], others have shown opposite results. Iseri et al. [26] were the first to demonstrate a significant correlation between OCT
parameters and MMSE scores in AD patients. However, the correlation was significant only for the total macu-lar volume, and not for the peripapilmacu-lary RNFL thickness measurements. On the other hand, Ascaso et al. [35] showed a significant association between RNFL thickness in superior and inferior quadrants, and MMSE score. Oktem et al. [42] also demonstrated a significant corre-lation between MMSE scores and the RNFL parameters. Recently, our group confirmed a significant correlation between MMSE scores and several SD-OCT parameters [24]. For peripapillary RNFL parameters, a significant correlation was found for the average, superior and infe-rior thickness. For the macular thickness, all parameters (except the superior and inferior outer segments) showed significant correlation with MMSE scores. The most sig-nificant correlations were those of the four (superior, inferior, nasal and temporal) inner macular segments and GCL++, reflecting the most affected parameters in our patients. In accordance to our results, Bayhan et al. [43] also demonstrated a significant correlation between MMSE scores and macular GCL thickness. The correla-tion between cognitive impairment and OCT parameters seems to be stronger for both full macular thickness and inner retinal layers. This is in agreement with the post
mortem histological study in eyes of AD patients which
demonstrated a predominantly RGC loss at the level of the fovea and parafoveal retina [9]. Therefore, macu-lar thickness assessment using OCT, especially with the advances in high-resolution SD-OCT equipments, seems to be a promising diagnostic tool in AD patients. How-ever, further studies, including earlier stages of the dis-ease and monitoring OCT parameters changes along the course of the disease, are required.
Optical coherence tomography parameters in mild cognitive impairment
The MCI is a clinical condition in which the individual presents with memory loss, larger than expected for their age, but not enough to impair their daily activities [60]. The MCI can be considered as an intermediate stage between normal aging and dementia [61]. The amnes-tic MCI (aMCI), a subtype with a predominant memory impairment, can be considered by many authors as an early stage of AD, mainly because the rate of progres-sion to Alzheimer in aMCI is 10–15 % per year, while in normal individuals, the conversion rate is only 1–2 % per year [61, 62]. Since MCI may represent an earlier stage of dementia, before the onset of the AD, it is important that these patients undergo careful medical evaluation over the years. Monitoring the clinical status and using ancil-lary objective tests that could document possible progres-sion to AD are also required. In this scenario, the RNFL thickness and macular measurements by OCT may turn Fig. 1 Examples of Topcon 3D OCT‑2000 generated full‑thickness
out to represent a non-invasive in vivo biological marker in both MCI and AD patients. Paquet et al. [34] demon-strated that the mean peripapilary RNFL were reduced in both MCI and AD patients, but no significant differ-ences were found between MCI and AD parameters. Similar results were also demonstrated by Oktem et al. [42]. On the other hand, another group found that the
except from the nasal quadrant when compared to trols. Moreover, these authors found an apparently con-flicting data, an increase in macular thickness parameters of MCI patients. They attributed this finding to possible inflammation and/or gliosis that would occur in the early stages of AD.
In a recently published study using SD-OCT, Gao et al. [25] found that the average thickness of the RNFL was reduced in MCI patients compared to AD patients (at inferior quadrant and segments of 5 and 6 o’clock). Compared to controls, MCI patients showed a significant
in the overall mean RNFL thickness and in all four quad-rants (superior, nasal, temporal and inferior) in patients with MCI.
Therefore, as previously demonstrated, peripapillary RNFL and macular thickness parameters in MCI patients were significantly reduced when compared to normal controls. These measurements assessed by OCT dem-onstrate that axonal loss in MCI is situated in an inter-mediate stage between AD patients and healthy controls, suggesting the involvement of the retina in early phases even before the onset of dementia.
Conclusions
In summary, in this article we discussed several clinical applications of OCT in patients with AD. The peripapil-lary RNFL thickness measurements were reduced in all quadrants, suggesting that a diffuse axonal degeneration occurs in AD patients. This finding is reinforced by the macular thickness reduction, especially by the loss of inner retinal layers, which reflects a preferential retinal GCL impairment in patients with AD. Therefore, OCT parameters can be used to distinguish AD patients from normal aging. Both peripapillary and macular thickness measurements obtained by OCT can be used to detect early neuronal loss as demonstrated in MCI patients, sug-gesting that OCT could be a promising diagnostic tool in demential diseases. Future studies showing that OCT can be useful in identify the converting patients from MCI to AD are required. Moreover, neuronal loss seems to corre-late well with cognitive impairment in AD, especially for macular parameters. This indicates the promising role of OCT in the clinical evaluation of these patients. There-fore, OCT is a non-invasive test, which we believe will serve as a biomarker in AD patients that could be rou-tinely used to evaluate and follow these patients, allowing a more comprehensive approach in this disease.
Authors’ contributions
LPC: conceived of the study, participated in its design and coordination and wrote the manuscript. ANMA: literature revision and helped to draft the manuscript. LVFCC: helped to draft the manuscript. CFC: helped to draft the manuscript. MLRM: helped in the study design and to draft the manuscript. All authors read and approved the final manuscript.
Author details
1 Department of Ophthalmology, School of Medicine, Juiz de Fora Eye Hospi‑ tal, Federal University of Juiz de Fora, Av. Barão do Rio Branco, 4051, Bom Pas‑ tor, Juiz de Fora, MG 36021‑630, Brazil. 2 Juiz de Fora Eye Hospital, Juiz de Fora, MG, Brazil. 3 Department of Neurology, School of Medicine, Federal University of Juiz de Fora, Juiz de Fora, Brazil. 4 Division of Ophthalmology, University of São Paulo Medical School, São Paulo, Brazil.
Competing interests
The authors declare that they have no competing interests.
Received: 4 August 2016 Accepted: 4 October 2016
References
1. Blennow K, de Leon MJ, Zetterberg H. Alzheimer’s disease. Lancet. 2006;368:387–403.
2. McKhann G, Drachman D, Folstein M, Katzman R, Price D, Stadlan EM. Clinical diagnosis of Alzheimer’s disease: report of the NINCDS‑ADRDA Work Group under the auspices of Department of Health and Human Services Task Force on Alzheimer’s disease. Neurology. 1984;34:939–44. 3. Cronin‑Golomb A, Corkin S, Rizzo JF, Cohen J, Growdon JH, Banks KS.
Visual dysfunction in Alzheimer’s disease: relation to normal aging. Ann Neurol. 1991;29:41–52.
4. Cronin‑Golomb A. Vision in Alzheimer’s disease. Gerontologist. 1995;35:370–6.
5. Armstrong RA. Visual field defects in Alzheimer’s disease patients may reflect differential pathology in the primary visual cortex. Optom Vis Sci. 1996;73:677–82.
6. Morrison JH, Hof PR, Bouras C. An anatomic substrate for visual discon‑ nection in Alzheimer’s disease. Ann NY Acad Sci. 1991;640:36–43. 7. Ferreira LK, Busatto GF. Neuroimaging in Alzheimer’s disease: cur‑
rent role in clinical practice and potential future applications. Clinics. 2011;66(Suppl. 1):19–24.
8. Blanks JC, Schmidt SY, Torigoe Y, Porrello KV, Hinton DR, Blanks RH. Retinal pathology in Alzheimer’s disease. II. Regional neuron loss and glial changes in GCL. Neurobiol Aging. 1996;17:385–95.
9. Blanks JC, Torigoe Y, Hinton DR, Blanks RH. Retinal pathology in Alzhei‑ mer’s disease. I. Ganglion cell loss in foveal/parafoveal retina. Neurobiol Aging. 1996;17:377–84.
10. Hinton DR, Sadun AA, Blanks JC, Miller CA. Optic‑nerve degeneration in Alzheimer’s disease. N Engl J Med. 1986;315:485–7.
11. Sadun AA, Bassi CJ. Optic nerve damage in Alzheimer’s disease. Ophthal‑ mology. 1990;97:9–17.
12. Cohen RM, Rezai‑Zadeh K, Weitz TM, Rentsendorj A, Gate D, Spivak I, et al. A transgenic Alzheimer rat with plaques, tau pathology, behavio‑ ral impairment, oligomeric abeta, and frank neuronal loss. J Neurosci. 2013;33:6245–56.
13. Koronyo‑Hamaoui M, Koronyo Y, Ljubimov AV, Miller CA, Ko MK, Black KL, et al. Identification of amyloid plaques in retinas from Alzheimer’s patients and noninvasive in vivo optical imaging of retinal plaques in a mouse model. Neuroimage. 2011;54(Suppl. 1):S204–17.
14. Liu B, Rasool S, Yang Z, Glabe CG, Schreiber SS, Ge J, et al. Amyloid‑ peptide vaccinations reduce β‑amyloid plaques but exacerbate vascular deposition and inflammation in the retina of Alzheimer’s transgenic mice. Am J Pathol. 2009;175:2099–110.
15. Ning A, Cui J, To E, Ashe KH, Matsubara J. Amyloid‑beta deposits lead to retinal degeneration in a mouse model of Alzheimer disease. Invest Ophthalmol Vis Sci. 2008;49:5136–43.
16. Perez SE, Lumayag S, Kovacs B, Mufson EJ, Xu S. Beta‑amyloid deposi‑ tion and functional impairment in the retina of the APPswe/PS1DeltaE9 transgenic mouse model of Alzheimer’s disease. Invest Ophthalmol Vis Sci. 2009;50:793–800.
17. Curcio CA, Drucker DN. Retinal ganglion cells in Alzheimer’s disease and aging. Ann Neurol. 1993;33:248–57.
18. Davies DC, McCoubrie P, McDonald B, Jobst KA. Myelinated axon number in the optic nerve is unaffected by Alzheimer’s disease. Br J Ophthalmol. 1995;79:596–600.
19. Parisi V, Restuccia R, Fattapposta F, Mina C, Bucci MG, Pierelli F. Morpho‑ logical and functional retinal impairment in Alzheimer’s disease patients. Clin Neurophysiol. 2001;112:1860–7.
20. Monteiro ML, Cunha LP, Costa‑Cunha LV, Maia OO Jr, Oyamada MK. Rela‑ tionship between optical coherence tomography, pattern electroretino‑ gram and automated perimetry in eyes with temporal hemianopia from chiasmal compression. Invest Ophthalmol Vis Sci. 2009;50:3535–41. 21. Monteiro ML, Fernandes DB, Apostolos‑Pereira SL, Callegaro D. Quantifi‑
cation of retinal neural loss in patients with neuromyelitis optica and mul‑ tiple sclerosis with or without optic neuritis using Fourier‑domain optical coherence tomography. Invest Ophthalmol Vis Sci. 2012;53:3959–66. 22. Monteiro ML, Afonso CL. Macular thickness measurements with
23. Hedges TR III, Perez Galves R, Speigelman D, Barbas NR, Peli E, Yardley CJ. Retinal nerve fiber layer abnormalities in Alzheimer’s disease. Acta Ophthalmol Scand. 1996;74:271–5.
24. Cunha LP, Lopes LC, Costa‑Cunha LV, Costa CF, Pires LA, Almeida AL, et al. Macular thickness measurements with frequency domain‑OCT for quantification of retinal neural loss and its correlation with cognitive impairment in Alzheimer’s disease. PLoS One. 2016;11:e0153830. 25. Gao L, Liu Y, Li X, Bai Q, Liu P. Abnormal retinal nerve fiber layer thickness
and macula lutea in patients with mild cognitive impairment and Alzhei‑ mer’s disease. Arch Gerontol Geriatr. 2015;60:162–7.
26. Iseri PK, Altinas O, Tokay T, Yuksel N. Relationship between cognitive impairment and retinal morphological and visual functional abnormali‑ ties in Alzheimer disease. J Neuroophthalmol. 2006;26:18–24.
27. Kesler A, Vakhapova V, Korczyn AD, Naftaliev E, Neudorfer M. Retinal thick‑ ness in patients with mild cognitive impairment and Alzheimer’s disease. Clin Neurol Neurosurg. 2011;113:523–6.
28. Kirbas S, Turkyilmaz K, Anlar O, Tufekci A, Durmus M. Retinal nerve fiber layer thickness in patients with Alzheimer disease. J Neuroophthalmol. 2013;33:58–61.
29. Kromer R, Serbecic N, Hausner L, Froelich L, Aboul‑Enein F, Beutelspacher SC. Detection of retinal nerve fiber layer defects in Alzheimer’s disease using SD‑OCT. Front Psychiatry. 2014;5:22.
30. Lu Y, Li Z, Zhang X, Ming B, Jia J, Wang R, et al. Retinal nerve fiber layer structure abnormalities in early Alzheimer’s disease: evidence in optical coherence tomography. Neurosci Lett. 2010;480:69–72.
31. Marziani E, Pomati S, Ramolfo P, Cigada M, Giani A, Mariani C, et al. Evaluation of retinal nerve fiber layer and ganglion cell layer thickness in Alzheimer’s disease using spectral‑domain optical coherence tomogra‑ phy. Invest Ophthalmol Vis Sci. 2013;54:5953–8.
32. Moreno‑Ramos T, Benito‑Leon J, Villarejo A, Bermejo‑Pareja F. Retinal nerve fiber layer thinning in dementia associated with Parkinson’s dis‑ ease, dementia with Lewy bodies, and Alzheimer’s disease. J Alzheimers Dis. 2013;34:659–64.
33. Moschos MM, Markopoulos I, Chatziralli I, Rouvas A, Papageorgiou SG, Ladas I, et al. Structural and functional impairment of the retina and optic nerve in Alzheimer’s disease. Curr Alzheimer Res. 2012;9:782–8. 34. Paquet C, Boissonnot M, Roger F, Dighiero P, Gil R, Hugon J. Abnormal
retinal thickness in patients with mild cognitive impairment and Alzhei‑ mer’s disease. Neurosci Lett. 2007;420:97–9.
35. Ascaso FJ, Cruz N, Modrego PJ, Lopez‑Anton R, Santabarbara J, Pascual LF, et al. Retinal alterations in mild cognitive impairment and Alz‑ heimer’s disease: an optical coherence tomography study. J Neurol. 2014;261:1522–30.
36. Parisi V. Correlation between morphological and functional retinal impair‑ ment in patients affected by ocular hypertension, glaucoma, demyelinating optic neuritis and Alzheimer’s disease. Semin Ophthalmol. 2003;18:50–7. 37. Coppola G, Di Renzo A, Ziccardi L, Martelli F, Fadda A, Manni G, et al. Opti‑
cal coherence tomography in Alzheimer’s disease: a meta‑analysis. PLoS One. 2015;10:e0134750.
38. He XF, Liu YT, Peng C, Zhang F, Zhuang S, Zhang JS. Optical coherence tomography assessed retinal nerve fiber layer thickness in patients with Alzheimer’s disease: a meta‑analysis. Int J Ophthalmol. 2012;5:401–5. 39. Thomson KL, Yeo JM, Waddell B, Cameron JR, Pal S. A systematic review
and meta‑analysis of retinal nerve fiber layer change in dementia, using optical coherence tomography. Alzheimers Dement. 2015;1:136–43. 40. Choi SH, Park SJ, Kim NR. Macular ganglion cell‑inner plexiform layer
thickness is associated with clinical progression in mild cognitive impair‑ ment and Alzheimers disease. PLoS One. 2016;11:e0162202.
41. Liu D, Zhang L, Li Z, Zhang X, Wu Y, Yang H, et al. Thinner changes of the retinal nerve fiber layer in patients with mild cognitive impairment and Alzheimer’s disease. BMC Neurol. 2015;15:14.
42. Oktem EO, Derle E, Kibaroglu S, Oktem C, Akkoyun I, Can U. The relation‑ ship between the degree of cognitive impairment and retinal nerve fiber layer thickness. Neurol Sci. 2015;36:1141–6.
43. Bayhan HA, Aslan Bayhan S, Celikbilek A, Tanik N, Gurdal C. Evaluation of the chorioretinal thickness changes in Alzheimer’s disease using spectral‑domain optical coherence tomography. Clin Exp Ophthalmol. 2015;43:145–51.
44. Garcia‑Martin ES, Rojas B, Ramirez AI, de Hoz R, Salazar JJ, Yubero R, et al. Macular thickness as a potential biomarker of mild Alzheimer’s disease. Ophthalmology. 2014;121(1149–1151):e1143.
45. Polo V, Garcia‑Martin E, Bambo MP, Pinilla J, Larrosa JM, Satue M, et al. Reli‑ ability and validity of cirrus and spectralis optical coherence tomography for detecting retinal atrophy in Alzheimer’s disease. Eye. 2014;28:680–90. 46. Berisha F, Feke GT, Trempe CL, McMeel JW, Schepens CL. Retinal
abnormalities in early Alzheimer’s disease. Invest Ophthalmol Vis Sci. 2007;48:2285–9.
47. Larrosa JM, Garcia‑Martin E, Bambo MP, Pinilla J, Polo V, Otin S, et al. Potential new diagnostic tool for Alzheimer’s disease using a linear discriminant function for Fourier domain optical coherence tomography. Invest Ophthalmol Vis Sci. 2014;55:3043–51.
48. Bambo MP, Garcia‑Martin E, Gutierrez‑Ruiz F, Pinilla J, Perez‑Olivan S, Lar‑ rosa JM, et al. Analysis of optic disk color changes in Alzheimer’s disease: a potential new biomarker. Clin Neurol Neurosurg. 2015;132:68–73. 49. Oktem EO, Derle E, Kibaroglu S, Oktem C, Akkoyun I, Can U. The relation‑
ship between the degree of cognitive impairment and retinal nerve fiber layer thickness. Neurol Sci. 2015;36(7):1141–6.
50. Salobrar‑Garcia E, Hoyas I, Leal M, de Hoz R, Rojas B, Ramirez AI, et al. Analysis of retinal peripapillary segmentation in early Alzheimer’s disease patients. Biomed Res Int. 2015;2015:636548.
51. Garcia‑Martin E, Bambo MP, Marques ML, Satue M, Otin S, Larrosa JM, et al. Ganglion cell layer measurements correlate with disease severity in patients with Alzheimer’s disease. Acta Ophthalmol. 2016;94(6):e454–9. 52. Costa‑Cunha LV, Cunha LP, Malta RF, Monteiro ML. Comparison of
Fourier‑domain and time‑domain optical coherence tomography in the detection of band atrophy of the optic nerve. Am J Ophthalmol. 2009;147(56–63):e52.
53. Wojtkowski M, Bajraszewski T, Gorczynska I, Targowski P, Kowalczyk A, Wasilewski W, et al. Ophthalmic imaging by spectral optical coherence tomography. Am J Ophthalmol. 2004;138:412–9.
54. Wojtkowski M, Srinivasan V, Ko T, Fujimoto J, Kowalczyk A, Duker J. Ultrahigh‑resolution, high‑speed, Fourier domain optical coherence tomography and methods for dispersion compensation. Opt Express. 2004;12:2404–22.
55. Afonso CL, Raza AS, Kreuz AC, Hokazono K, Cunha LP, Oyamada MK, et al. Relationship between pattern electroretinogram, frequency‑domain OCT, and automated perimetry in chronic papilledema from pseudotu‑ mor cerebri syndrome. Invest Ophthalmol Vis Sci. 2015;56:3656–65. 56. Fernandes DB, Raza AS, Nogueira RG, Wang D, Callegaro D, Hood DC,
et al. Evaluation of inner retinal layers in patients with multiple sclerosis or neuromyelitis optica using optical coherence tomography. Ophthalmol‑ ogy. 2013;120:387–94.
57. Hood DC, Slobodnick A, Raza AS, de Moraes CG, Teng CC, Ritch R. Early glaucoma involves both deep local, and shallow widespread, retinal nerve fiber damage of the macular region. Invest Ophthalmol Vis Sci. 2014;55:632–49.
58. Monteiro ML, Hokazono K, Fernandes DB, Costa‑Cunha LV, Sousa RM, Raza AS, et al. Evaluation of inner retinal layers in eyes with temporal hemianopic visual loss from chiasmal compression using optical coher‑ ence tomography. Invest Ophthalmol Vis Sci. 2014;55:3328–36. 59. Cheung CY, Ong YT, Hilal S, Ikram MK, Low S, Ong YL, et al. Retinal gan‑
glion cell analysis using high‑definition optical coherence tomography in patients with mild cognitive impairment and Alzheimer’s disease. J Alzheimers Dis. 2015;45:45–56.
60. Petersen RC, Smith GE, Waring SC, Ivnik RJ, Tangalos EG, Kokmen E. Mild cognitive impairment: clinical characterization and outcome. Arch Neu‑ rol. 1999;56:303–8.
61. Grundman M, Petersen RC, Ferris SH, Thomas RG, Aisen PS, Bennett DA, et al. Mild cognitive impairment can be distinguished from Alzheimer disease and normal aging for clinical trials. Arch Neurol. 2004;61:59–66. 62. Petersen RC, Stevens JC, Ganguli M, Tangalos EG, Cummings JL, DeKosky