TRANS Asian Research Journals
http://www.tarj.in 8
P u b l i s h e d b y : T R A N S A s i a n R e s e a r c h J o u r n a l s
AJMR:
A s i a n J o u r n a l o f
M u l t i d i m e n s i o n a l
R e s e a r c h
( A D o u b l e B l i n d R e f e r e e d & R e v i e we d I n t e r n a t i o n a l J o u r n a l )
CURRENCY FUTURES IMPACT ON THE VOLATILITY OF
EXCHANGE RATE
Dr. Niti Goyal*; Dr. Anil Mittal**
*Assistant Professor,
Department of Business Administration, National Institute of Technology,
Kurukshetra, India. **Professor,
University School of Management, Kurukshetra, India.
ABSTRACT
This article attempts to study the impact of currency futures trading on the volatility of the spot exchange rates where the underlying in the futures contract is the USD- INR exchange rate. Currency futures were introduced in year 2008 on the Indian stock exchange to hedge the risks arising out of the fluctuations in exchange rate and to contain the volatility of the exchange rates. The study has employed USD-INR exchange rate data for 10 year period starting from March 2000 to Dec 2010. Using GARCH (1,1) framework, the study reports an increase in volatility coefficient of the spot exchange rate of USD-INR. Thus, it can be inferred on the basis of the empirical evidence that currency futures trading has increased the volatility of the exchange rate of USD- INR.
KEYWORDS: Currency Futures, GARCH, Volatility.
____________________________________________________________________________
INTRODUCTION
TRANS Asian Research Journals
http://www.tarj.in 9
Currency future is a form of financial derivative contract where the underlying is the currency. Derivatives were introduced in India in year 2000 with the introduction of index futures on BSE. Since then derivatives trading has outperformed the trading in the cash market segment. Currency futures are the recent entrants to the family of derivatives .
Currency futures were introduced on the Indian stock exchanges in year 2008 and currency options in year 2010. First, currency futures on USD-INR were introduced for trading and subsequently the Indian rupee was allowed to trade against other currencies such as Euro, Pound Sterling and the Japanese yen. Currency options are currently available on US Dollars only.
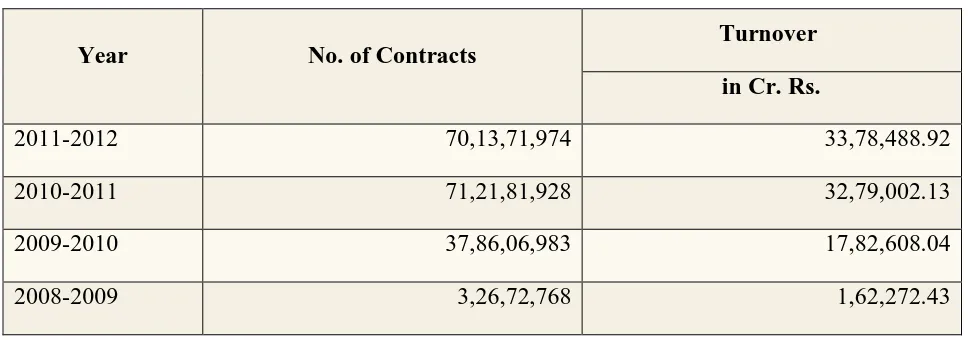
TABLE 1: BUSINESS GROWTH IN CURRENCY FUTURES
Year No. of Contracts Turnover
in Cr. Rs.
2011-2012 70,13,71,974 33,78,488.92
2010-2011 71,21,81,928 32,79,002.13
2009-2010 37,86,06,983 17,82,608.04
2008-2009 3,26,72,768 1,62,272.43
Source: nseindia.com
Over the span of 4 years, trading in currency futures contract has increased by around 22 times. Derivatives were introduced on the Indian stock exchanges to contain the volatility of the Indian stock market to integrate the Indian markets with the international markets and also to provide investors with the more innovative risk management tools. The impact of derivatives on volatility is a much debated issue. There have been no conclusive evidence regarding the impact of derivatives trading on volatility. Many studies have been made on the same issue but provided mixed results. Because of low transaction costs and leverage effect, derivatives are assumed to attract speculative trading ,thus, destabilizing the volatility of the spot market. On the other side, derivatives are assumed to decrease the spot market volatility by increasing the informational efficiency of the spot market and because of low transactions costs, speculators migrate from spot market to futures market thus stabilizing the cash market.
TRANS Asian Research Journals
http://www.tarj.in 10
on spot market exchange rate. The aim of this paper is to analyse the impact of introduction of USD-INR futures contract on the volatility of their spot exchange rates.
REVIEW OF LITERATURE
Despite the popular opinion that increased volatility in numerous financial markets was enhanced by trading in derivatives, the empirical evidence regarding this issue is far from conclusive. Some studies made on the same have been briefed below:
Chatrath, Ramchander and Song (1996) explicitly examined the relationship between level of currency futures trading and the volatility in the spot rates of the British pound, Canadian dollar, Japanese yen, Swiss franc and Deutsche mark. The researchers provide strong evidence on the causality between futures trading volume exchange rate volatility, as it is found out that the trading activity in futures has a positive impact on conditional volatility in the exchange rate changes, with a weaker feedback from the exchange rate fluctuations to the futures volatility. Moreover, futures trading activity is found to decline on the day following increased volatility in spot exchange rates.
Bessembinder and Seguin (1992) examined whether greater S&P 500 futures-trading activity is associated with greater equity volatility. Their evidence indicated that equity volatility is positively related to spot-trading activity and to contemporaneous futures-trading shocks. Moreover, they argue that equity volatility is actually mitigated when the background futures activity is high. These findings contrast significantly with other empirical studies that suggest positive relation between futures trading and spot market variability.
Gulen and Mayhew (2000), in a study of 25 countries, found different results in different countries. They reported that futures trading is associated with increased volatility in the US and Japan. In some countries, there has been no robust, significant effect, and in many others, volatility has been lower after futures have been introduced. Thus results varied from place to place.
Darrat, Rahman and Zhong (2002) found that index futures trading have not increased the volatility in the spot market. And also derivatives trading has led to the development of the spot market.
Ricardo Pereira (2004) attempted to forecast Portuguese Stock Market volatility using different measures of volatility and compared them through the use of both symmetric and asymmetric error statistics. He found smooth superiority of ARCH class models, principally when using RMSE and MME.
Sung, Taek and Park (2004) studied the effect of the introduction of index futures trading in the Korean markets on spot price volatility and market efficiency of the underlying KOSPI 200 stocks relative to the carefully matched non-KOSPI 200 stocks; they found evidence that market volatility has not been affected by futures trading, while market efficiency has improved.
TRANS Asian Research Journals
http://www.tarj.in 11
market for futures. Furthermore it is inconclusive whether hedgers stabilize or destabilize the market. Exchange rate movements affect expected future cash flow by changing the home currency value of foreign cash inflows and outflows and the terms of trade and competition. Hence, the usage of currency derivatives for hedging the unexpected movement of currency becomes more important and essential and its importance is heightened.
Hakim Kanasro, Chandan Rohra, Mumtaz Junejo (2009) examined the presence of volatility at the Karachi Stock Exchange (KSE) by analyzing two Indexes namely KSE-100 Index and All shares index through the use of GARCH family models introduced by Engle (1982), Bollerslev (1986) and Nelson (1991). The empirical results have confirmed the presence of high volatility at Karachi Stock Exchange throughout the study period.
Hojatallah Goudarzi & C. S. Ramanarayanan (2010) examined the volatility of the Indian stock markets and its related stylized facts using ARCH models. The BSE 500 stock index has been used to study the volatility in the Indian stock market over a 10 years period. Two commonly used symmetric volatility models, ARCH and GARCH have been used .The adequacy of selected model has been tested using ARCH-LM test and LB statistics. The study has concluded that GARCH (1, 1) model best explains the volatility of the Indian stock market and its stylized facts including volatility clustering, fat tails and mean reverting satisfactorily.
Johan de Beer (2009) studied the impact of introduction of single stock futures on spot market volatility. The listed shares of thirty-eight South African companies have been evaluated in terms of a possible volatility effect due to the initial trading of their respective single stock futures contracts. GARCH (1, 1) model has been used to establish a volatility structure (pattern of behavior) per company. Results, in general, showed a reduction in the level and changes in the structure of spot market volatility post single stock futures.
DATA & RESEARCH METHODOLOGY
For the present analysis, we have concentrated on the USD-INR currency futures only from 2001 to 2011. This paper will be using the secondary data which has been collected from official website of Reserve Bank of India. The data has been analysed using eviews 5 software.
The study uses GARCH(1,1) technique to capture the impact of currency futures on volatility which is the most popular model out of GARCH class models.
GARCH (1, 1)
The GARCH specification, firstly proposed by Bollerslev (1986), formulates the serial dependence of volatility and incorporates the past observations into the future volatility (Bollerslev et al. (1994)
The GARCH(1,1) model is presented as follows:
TRANS Asian Research Journals
http://www.tarj.in 12
News about volatility from the previous period can be measured as the lag of the squared residual from the mean equation (ARCH term). Also, the estimate of β (GARCH term) shows the persistence of volatility to a shock or, alternatively, the impact of old news on volatility.
In order to find the impact of currency futures on volatility, the whole study period has been divided into two parts:
Pre currency derivatives period: 1st April 2000 – 29th August 2008
Post currency derivatives period: 30th Aug 2008- 31st Dec 2010
To study the impact on volatility following the onset of derivatives trading, a dummy variable has been introduced in the conditional variance equation with the dummy variable (Dummy) taking on the value zero in pre derivatives period, and one in the post derivatives period.
Thus,the GARCH (1,1) equation becomes:
If γ, the coefficient of the dummy variable, is statistically significant, then it can be said that existence of derivative trading has had an impact on spot market volatility. Further, the sign of γ indicates the direction of change in the spot market volatility. If the coefficient is negative, it can be said that the volatility has reduced post introduction of derivatives and vice versa if the coefficient is positive.
ANALYSIS OF DATA
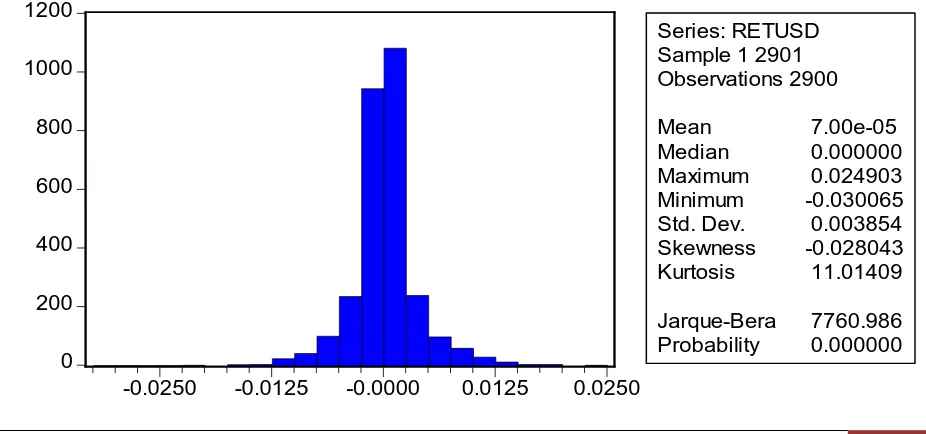
FIG 1. DESCRIPTIVE STATISTICS OF USD INR EXCHANGE RATE
0 200 400 600 800 1000 1200
-0.0250 -0.0125 -0.0000 0.0125 0.0250
Series: RETUSD Sample 1 2901 Observations 2900
Mean 7.00e-05
Median 0.000000
Maximum 0.024903
Minimum -0.030065
Std. Dev. 0.003854
Skewness -0.028043
Kurtosis 11.01409
Jarque-Bera 7760.986
TRANS Asian Research Journals
http://www.tarj.in 13
The descriptive statistics of USD-INR exhibits a deviation from normality which has been confirmed using JB test statistic. The stationary of the exchange rate series has also been checked using ADF test with null hypothesis of non stationarity which rejects the null of stationarity at 5% level of significance.
Thus, the non stationary series has been converted into stationary series by taking logarithmic differences using the following equation:
Where
rt = continuously compounded logarithmic return
pt =exchange rate at day t and
pt-1 = exchange rate at day t-1
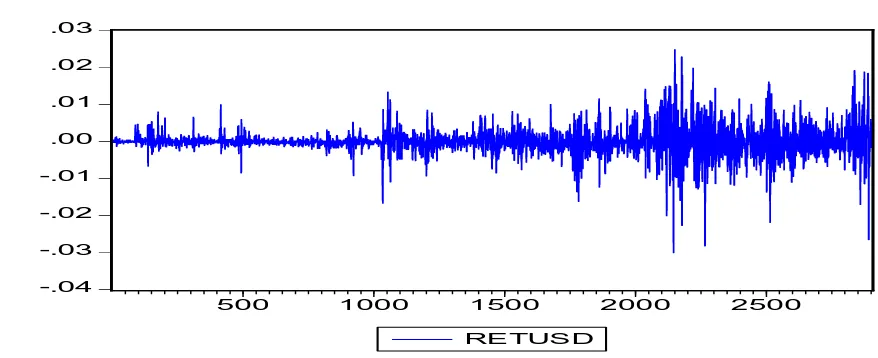
FIG 2: STATIONARY USD-INR EXCHANGE RATE SERIES
A look at Fig 2 reveals some typical characteristics about the exchange rate series. The exchange rate series exhibit a changing variance, volatility clustering and mean reversion. These characteristics cannot be captured using linear models. Hence, non linear models have been used. Also variance seems to have increased in the later part of the graph.
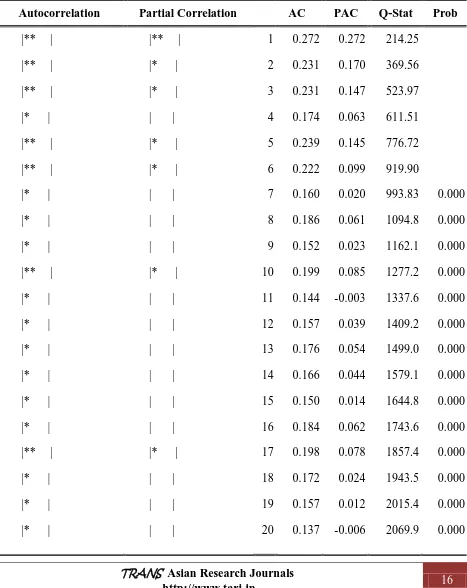
Using box Jenkins methodology, mean equation has been formulated as AR(3) MA(3) model. The residuals of the linear model have been tested for any correlation using LJUNG Q statistics which reveal autocorrelation among the error terms . The correlogram of squared returns for 20 lags has been given in Table 1 in Appendix .
Further the residuals have been tested for ARCH effects using ARCH LM test using null hypothesis of o heteroskedasticity. The result for ARCH LM test have been presented below in table 2.
-.04 -.03 -.02 -.01 .00 .01 .02 .03
500 1000 1500 2000 2500
TRANS Asian Research Journals
http://www.tarj.in 14
TABLE 2: ARCH TEST
F-statistic 47.48479 Prob. F(12,2871) 0.000000
Obs*R-squared 477.6056 Prob. Chi-Square(12) 0.000000
After confirming for the ARCH effects, GARCH (1,1) equation has been formulated using dummy variable. The result for GARCH (1,1) equation has been presented in table 3 below.
TABLE3: RESULT OF GARCH (1,1)
C 3.89E-08 8.83E-09 4.402696 0.0000
RESID(-1)^2 0.305209 0.024979 12.21867 0.0000
GARCH(-1) 0.746400 0.015093 49.45179 0.0000
SERIES01 1.23E-06 4.43E-07 2.788402 0.0053
The coefficient of dummy variable is positive and is significant at 5% level as reported by low p values in the last column of the table 3. This indicates that currency futures introduction has increased the volatility of the spot exchange rate. This can also be seen in fig 1, where the variance of the exchange rate seems to have increased in the later years.
CONCLUSION
TRANS Asian Research Journals
http://www.tarj.in 15
BIBLIOGRAPHY & REFERENCES
Bae S. C., Kwon T. H., Park J. W. (2004). Futures trading, spot market volatility, and market
efficiency: the case of the Korean index futures markets. The Journal of Futures Markets, Vol. 24, No. 12, pp. 1195–1228.
Bhargava V., Malhotra D.K. (2007). The relationship between futures trading activity and
exchange rate volatility, revisited. Journal of Multinational Financial Management, 17, pp. 95-111
Chatrath, A., S. Ramchander and F. Song (1996), “The Role of Futures Trading Activity in Exchange Rate Volatility”. The Journal of Futures Markets, Vol. 16, No. 5, 561-584
Darrat A., Rahman S., Zhong M. (2002). On the role of futures trading in spot market fluctuations: Perpetrator of volatility or victim of regret? The Journal of Financial Research, Vol. XXV, No. 3, pp. 431-444.
Bessembinder H., Seguin P. J. (1993). Price volatility, trading volume, and market depth:
evidence from futures markets. The Journal of Financial and Quantitative Analysis, Vol. 28, No. 1, pp. 21-39.
Gulen H., Mayhew S. (2000). Stock Index Futures Trading and Volatility in International Equity Markets. The Journal of Futures Markets, Vol. 20, No. 7, pp. 661–685.
Hakim Ali Kanasro, Chandan Lal Rohra, Mumtaz Ali Junejo (2009), “Measurement of Stock Market Volatility through ARCH and GARCH Models: A Case Study of Karachi Stock Exchange”, Australian Journal of Basic and Applied Sciences, Volume 3 (4), pp. 3123-3127.
Hojatallah Goudarzi & C. S. Ramanarayanan (2010), “Modeling and Estimation of Volatility in the Indian Stock Market”, Journal of Business and Management, Vol. 5(2), pp. 85-98.
Johan de Beer (2009), “Changes in the Volatility Level and Structure of Shares Post Single Stock Futures Trading”, Corporate Ownership & Control , Volume 7(2),pp. 296-311.
Ricardo Pereira (2004), “Forecasting Portuguese Stock Market Volatility”, available at www.efmaefm.org/efma2005/papers/197-pereira_paper.pdf. , viewed on 18th Feb. 2010.
Somnath Sharma(2011), “An Empirical Analysis of the Relationship Between Currency Futures and Exchange Rates Volatility in India”, RBI WPS 1/2011.
TRANS Asian Research Journals
http://www.tarj.in 16
APPENDIX
TABLE 1. CORRELOGRAM OF SQUARED RESIDUALS
Q-STATISTIC PROBABILITIES
Autocorrelation Partial Correlation AC PAC Q-Stat Prob
|** | |** | 1 0.272 0.272 214.25
|** | |* | 2 0.231 0.170 369.56
|** | |* | 3 0.231 0.147 523.97
|* | | | 4 0.174 0.063 611.51
|** | |* | 5 0.239 0.145 776.72
|** | |* | 6 0.222 0.099 919.90
|* | | | 7 0.160 0.020 993.83 0.000
|* | | | 8 0.186 0.061 1094.8 0.000
|* | | | 9 0.152 0.023 1162.1 0.000
|** | |* | 10 0.199 0.085 1277.2 0.000
|* | | | 11 0.144 -0.003 1337.6 0.000
|* | | | 12 0.157 0.039 1409.2 0.000
|* | | | 13 0.176 0.054 1499.0 0.000
|* | | | 14 0.166 0.044 1579.1 0.000
|* | | | 15 0.150 0.014 1644.8 0.000
|* | | | 16 0.184 0.062 1743.6 0.000
|** | |* | 17 0.198 0.078 1857.4 0.000
|* | | | 18 0.172 0.024 1943.5 0.000
|* | | | 19 0.157 0.012 2015.4 0.000
TRANS Asian Research Journals
http://www.tarj.in 17
CONTRACT SPECIFICATION FOR US DOLLARS – INDIAN RUPEE (USDINR) CURRENCY FUTURES
Contract specification : USD INR Currency Derivatives
Underlying Rate of exchange between one USD and INR
Exchange of trading National Stock Exchange of India Limited
Security descriptor FUTCUR USDINR