Vol.9 (2019) No. 5
ISSN: 2088-5334
Sub Surface Active Fault Identification on Quaternary and Tertiary
Rocks Using Geoelectric Method in Cilaki Drainage Basin, Southern
Part of West Java, Indonesia
Johan Budi Winarto
*,#, Emi Sukiyah
#,+, Agus Didit Haryanto
+,1, Iyan Haryanto
+,2*
Geology Agency of Indonesia, Indonesia E-mail: johanbadangeologi@gmail.com
#
Post graduate Program of Geology, Faculty of Geological Engineering, Padjadjaran University, Indonesia E-mail: emi.sukiyah@unpad.ac.id;
+
Department of Geoscience, Faculty of Geological Engineering, Padjadjaran University, Indonesia E-mail: 1agus.didit.haryanto@unpad.ac.id; 2iyanharyanto@gmail.com
Abstract
—
The geophysical surveys are needed to obtain information on subsurface geology for infrastructure development, mitigation of landslide and geothermal. Cilaki drainage basin is an area Garut Regency at southern part of West Java. The area has complex geological and the main target in development plan of Southern part of West Java. The electrical resistivity method of the Schlumberger configuration was used to identify the geological subsurface and the active fault of the study area. The measurement of the electrical resistivity was made on 7 lanes (GL 1 until GL 7). The location has a height of 195 to 925 meters above sea level with depth reaching more than 120 meters and electrical resistivity value of 6 - 450 Ω meters. Generally, the electrical resistivity value of Quaternary rock units have value between 80 and 450 Ω meters and Tertiary rock unit have value of 6 - 40 Ω meters. Based on the results of data analysis can be interpreted that the area has been deformed. This is reflected also in the geomorphology as an indication of tectonic phenomenon in the form of active faults. Quantitatively, this is reflected in the value of the mountain-front sinuosity (Smf) index which ranges 1.036 to 2.173. This phenomenon occurs in geomorphology which is composed of Tertiary and Quaternary rocks.Keywords— sub surface survey; active fault; geo-electrical method; Cilaki drainage basin.
I. INTRODUCTION
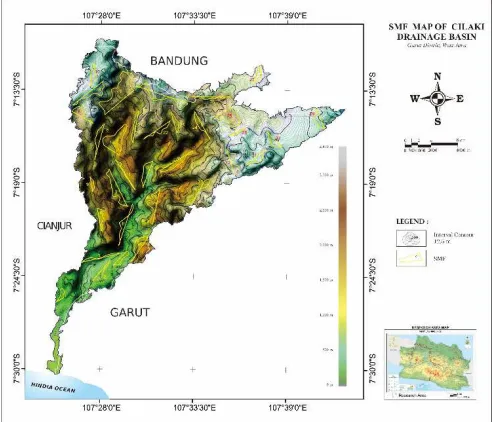
Cilaki drainage basin is a Cisewu region and surrounding of Garut in Southern part of West Java (Fig. 1). This area is hilly with complex geology feature, both of lithology and tectonic activity. The exposure of Tertiary rocks between the Quaternary deposits (Paleogene-Neogene period) is formed by the deformation process that produces current landscape conditions [1]. Fig. 1a is shows regional geology of Indonesia map as a tectonic product by three tectonic plate movement. The basement formation of geological setting is metamorphic and it is intruded with plutonic formations with Mesozoic, Cenozoic, recent volcanic formations and Quaternary deposits including ophiolite, marine deposits and metamorphic rock [2]–[4]. The illustration in Fig. 1b shows the location of research area. The West Java region is a West-part of Java Island with island arc tectonic model. The Quaternary and Tertiary period relationships as well as the association to an active fault used Smf index geomorphic [5], [6]. The results are expected to be used as important
geological information in the development of tourist areas, residential areas and infrastructure development, i.e. civilian roads, bridges, residence, tourism, and mitigation of mass movements. It is needed for local community susceptible to economic adversity and natural disaster [7].
Fig. 1 (a) The regional geological setting of Indonesia; (b) the location of the research area is Cilaki drainage basin in Cisewu region Southern Garut West Java
The southern mountainous zone in West Java is dominated by volcanic mountainous areas with moderate to steep slopes [3], [5], [14]. Fig. 2 is show a geological map of research area by geological observation. Generally, the geomorphology of Cilaki watershed is associated with Quaternary volcanic rocks. Meanwhile, the plains only occupy the downstream area of rivers and coastal that is associated with Tertiary sedimentary rocks and alluvial deposit. Stratigraphy of research area consists of Miocene-to-Holocene rock formations (Fig. 2). Formation rocks can be classified in igneous rocks, volcanic rocks, sedimentary rocks, and alluvial deposits [15]–[17]. The geological structure of the research area is influenced by the recent tectonic activity that develops from Tertiary period to the present, especially in the southern part of West Java [1]. The evidence of faults can be recognized by remote sensing method and field survey.
The geoelectric method is mostly used to determine subsurface geological structures based on variations in resistivity value of rock. Geoelectric survey with slumberger configuration is one of the relatively simple and cheap geophysical method. It is used to find the various subsurface research such as mineral exploration, ground water, environment, geothermal potential, and landslide and fault [11] [18]–[23]. The geoelectric method also used to study the potential for dam failure [12] and ground water [20], [21] [23]. The resistivity value in andesite rocks ranged from 212 Ωm to 300 Ωm with a depth of 1.3 m to 1.86 m based on research results in Polisiri Bawen, Semarang regency Center of Java [24]. The igneous rock has resistivity value between 128-1024 Ωm at Soutern Garut West Java [10]. Tools and equipment calibration can minimize the differences of resistivity values. This method can be determined to build a perspective model of sub surface geological structure.
The principle of the resistivity survey is injection of electric current through current electrode and measuring on surface area. Its response (in voltage) on the potential electrode in a certain configuration. The geoelectric method can be used to determine resistivity value of the rock and mineral [14], [23], [25]. The rocks or minerals are a dielectric material to conduct electricity [25].
Fig. 2 Geological map of Cilaki drainage basin and location of geoelectric survey
The rocks or minerals are a dielectric material to conduct electricity [25]. That material opposes the flow of electric current, known as resistivity. Fig. 3 explains the various resistivity and conductivity value of the material of the earth, water, soil, mineral and rock. The several lithology can be separated by this method. Author use the resistivity value index Palacky, provides following the classification with a resistivity value range of the earth's materials [14].
Fig. 3 The range of resistivity and conductivity value of the materials of the earth, water, soil, minerals and rocks [14]
II. MATERIAL AND METHOD
[11], [22]–[24]. The geoelectric method apply two electrodes current (C) and point of potential (P) to determine value of pseudo resistivity (p) (Fig. 4). The The data obtained from the field is pseudo value resistivity and then be converted become real value resistivity. The advance process use excel program and Res.2D program. Measurement of the value of resistivity of rocks uses the following formula:
1 = ƿ dan 2 = ƿ (1)
V1 − V2 =2ƿ 11 − 12 (2)
ΔV =2ƿ 11 − 12 13 − 14 (3)
= 1 2
1 − 12 − 13 − 14
(4)
ƿ = ΔV
(5)
Explanation:
ρ : resistivity (ohm/Ω meter)
∆V : electric potential difference between two points K : geometry factor
I : electric current
Fig. 4 Electrode Schlumberger configuration geoelectric method
The geoelectric survey was conducted on an area suspected of an active fault indication based on surface geological mapping results (Fig. 2). The geoelectric data were collected on 7 geoelectric lanes (GL) of measurements. The GL is lane measure of geoelectric method with stretch direction North South. The data is processed and analyzed in the laboratory in accordance with the research objectives.
Furthermore, analysis of rose diagram, stereographic projection, and geospatial overlay has done to strengthen the results that have been obtained. Using the theoretical of pure shear Moody and Hill (1957) applied following the ellipsoid basic model [26]. The identification of tectonic frame were performed by Geographic Information System (GIS); digital topographic map (scale 1:25,000), digital regional geology map (scale 1:100,000) and digital imagery data from 2016 Aster DEM imagery and 2017 Google Earth imagery (Image 2017 Digital Globe, Image 2017 CNES/Airbus and 2017 Image Landsat/Copernicus). The collection and analysis data
processing were use CorelDraw, MapInfo, Global Mapper software and field observation concerned with active fault.
The results of field measurements are plotted on the geological map of the study area for further interpretation related to the active fault. Analysis and interpretation of geological structures is use overlay method between DEM-SRTM radar image, topographic map and geological map that has been corrected geometry and scale. The study of active fault was used geomorphological approach. Author was used a mountain-front sinousity (Smf) index Bull W.B. and McFadden L.D. (1977) which is defined by:
=Lmf!" (6)
Where: Lmf is the length along the mountai-piedmont junction; Ls is the overall length of the mountain front [6] [8] [9]. The Smf index is suitable for the tectonic activity [18]. In this study, result of geoelectric method used to emphasize of active fault existance.
III.RESULT AND DISCUSSION
The data were obtained from the resistivity measurement of 7 lanes in the field and laboratory processing. Fig. 8d shows the photograph documentation of the geo-electric survey of Slumberger configuration to obtain the data of rock resistivity values in the research area. The location of measurement has altitude from 195 to 925 meters above sea level (a.s.l). Base on resistivity value of vary material and rocks, the study area divided into 2 class of resistivity value that is 1) on Tertiery sedimentary rock and 2) on Quaternary volcanic rock. The depth over of 120 meters and the resistivity value ranging from 6 to 450 Ω meters. The results obtained are shown in Fig. 5 and Fig. 6. Figures describes the results of geoelectric data processing in the form of cross section diagrams of measurement points with variations of values resistivity of rock, depth and rock types. There are displayed into the subsurface geological conditions of one-dimensional (1D) and two-one-dimensional (2D) false color cross-section with various measurement data variables.
Fig. 5 The 1-D cross section of geoelectric measurements, GL1 - GL7 trajectory with height of 195 to 925 meters a.s.l., depth of up to about 120 meters and resistivity values of 6 to 450 Ω meters in the Cilaki drainage basin
to many interpretations for sub surface geological phenomenon. On the other side, the two dimensional (2-D) cross section is interpreted into three block; 1) Block A, 2) Block B and 3) Block C limited by a red line subsurface geological structure (Fig. 6). Block B is identified as a deformation area. The resistivity value of Quaternary rocks has a value between 80 until 450 Ω meters while Tertiary rocks have value of 6 until 50 Ω meters.
Fig. 6 The 2D false colour cross section of geoelectric measurement, GL1- Gl 5 trajectory with height of 195 to 925 meters a.s.l, depth of up to about 120 meters and resistivity values of 6 to 450 Ω meters in the Cilaki drainage basin
The correlation of resistivity value determined by result of cross section analysis (Fig. 6 and Fig. 7). Fig. 6 explains the cross section 2D, that are show the various lithology and various resistivity value. The colors have a meaning of the resistivity value. Fig. 7 is designate the cross section map of resistivity value. The correlation of resistivity value was made by interpretation of resistivity value through lithology with certainly deep. The deformation process and tectonic activity influence can be predicted clearly by geo-electric method. The calibration of tool and equipment is necessary to minimize of the resistivity value error. The differences of resistivity value between Quaternary volcanic rock and Tertiary sedimentary rock can be used to find quantitatively of the lithological boundaries, fault and deformation areas [11]–[13], [18], [20], [23], [24].
Fig. 7 The lithology cross section, of geoelectric measurement, GL1-GL7 trajectory with height of 195 to 925 meters a.s.l, depth of up to 120 meters and resistivity values of 6 to 450 Ω meters in the Cilaki drainage basin
The result of resistivity value measurement on GL 1 to GL 5 is find the resistivity values of rock between 80 and 450 Ω meters with variation of depth between 0 and 110 meters (Fig. 4). The measurement area is composed by Quaternary volcanic rock, as shown in Fig. 2. Fig. 8a is photograph of the Tertiary tuffceous sandstone outcrops appear in the bottom of middle part Cilaki river. While, the Quarternary volcanic rock is overtake out of unconformity on Tertiary sedimentary rock. Moreover, Fig. 8b is photograp of the outcrops of Quaternary volcanic rock. It is
in the form of volcanic breccia and lava andesite structured columnar joint. Meanwhile, the GL 6 until GL 7 lanes occupies an area composed of Tertiary sedimentary rocks. This formation has rock resistivity values ranges between 6 and 50 Ω meters with a depth of more than 120 meters. The geoelectric measurements on GL 1 to GL 7 straight stretched that is always north-south direction.
Fig. 8 {a) Tertiary sedimentary rock outcrop is tuffaceous sandstone of Bentang Formation, (b) Quaternary volcanic rock outcrops, i.e. volcanic breccia and andesite with columnar joint structure, (c) brecciation, fracture and fault plane with position N 325°E/58° at the Quaternary volcanic rocks and (d) resistivity measurements in the area which is composed by Tertiary sedimentary rocks
Based on analysis of these data can be interpreted setting and boundary of lithology also the tectonic period of (Fig. 5, Fig. 6, Fig. 7 and Fig. 8). The Tertiary rock units with resistivity value between 6 until 50 Ω meters are not conformity covered by Quaternary deposits with resistivity value about 80 until 450 Ω meters. The GL3–GL5 lanes and GL1–GL2 lanes shows a relatively homogeneous resistivity on the Quaternary volcanic rock units. A extreme difference measurement is apparent in the GL 4 lane. The rock resistivity value is between 12.5 and 19 Ωmeters that is considered an anomaly and identified as a fault area. It is also can be interpret as a surface of rupture of the landslide [19].
The result of identification, analysis, and interpretation shows that is Cilaki drainage basin has been deformed as indication of tectonic process. It can provide evidence and illustration of the subsurface of the existence of the fault structure (Fig. 5 and Fig. 6). Fig. 8c shows an outcrop of geological structures, i.e. fractures and fault plane with N 325°E/58°. The evidence of the fractures and fault structure on surface and subsurface with depth over 120 meters in the Quaternary rocks indicates that the fault is potentially active. Its also happened to others active fault in research area on particularly.
survey. There are fractures and lineaments data plotting on geological map, diagrams roses, and stereographic projection. This analysis was conducted to determine of tectonic frame and type of fault structure with direction azimuth and main force of the cause. Fig. 9a shows an analysis of lineament of the ridge and valley. This work has been done to avoid misinterpretation of land use such as of forest, plantation, and other land use. The overlay of the analysis is corrected with the evidence found in the field along the predetermined lineament lanes.
Fig. 9 (a) The geological structure analyzes of the study area in the form of lineament of valley and ridge on SRTM-DEM image with the general direction of NW-SE and NE-SW, (b and c) joints analysis use DIP program with the general direction of NW-SE and NE-SW.
The main force direction of research area is set in from South to North, as shown in Fig. 10a. By using the ellipsoid model of pure shear can be determined the classification and types of fault structure [26]. Fig. 10b shows the illustration of the active fault reconstruction on recent period. It is can be created undergo subsurface interpretation of geoelectric method. Moreover, the subsurface displacement identified using the differences of the resistivity values. Fig. 9b show the result of joint analysis by stereonet program and Fig 9c is a diagram rosette to find out the types of fault structure. By this analysis, the type of fault structure in GL 4 is normal fault with azimuth direction West East (W-E). Fig. 10b is show the illustration of normal fault in GL 4 with rock resistivity value between 12.5 to 19 Ωmeters and depth of up to 120 meters. However, this normal fault with direction W-E should not formed in this area and contradicts to the theoretical of the ellipsoid model, as shown in Fig. 10a. The possible explanation is the normal fault appearance which reactive on Quaternary period. This fault was formed on older period with difference of the straight stress and force source direction.
Fig. 10 (a) The tectonic frame of research area shows the direction of main force azimuth relatively from South to North on Quarternary period. (b) The illustration of normal fault in GL 4 with azimuth direction of North-South.
Fig. 11 Mountain front sinousity (Smf) map
and Tertiary rock. The result of the average Smf value is 1.219 with range 1.036-2.173, as shown in Table 1. The average Smf value of Quaternary volcanic deposits sub-drainage basin is 1.24 with range 1.05-2.17. Meanwhile, the Tertiary sedimentary rocks sub-drainage basin has an average Smf value of 1.1 with range 1.04-1.13. There is no striking difference between the average Smf values in Quaternary rock and Tertiary rock.
TABLEI
MOUNTAIN FRONT SINOUSITY (SMF) VALUE
Lanes Lms-km Ls-km Smf Rock groups based on age
1 9.89 9.55 1.036 Tertiary rock
2 6.54 6.17 1.060 Tertiary rock
3 5.50 4.71 1.168 Tertiary rock
4 6.52 5.83 1.118 Tertiary rock
5 8.23 7.55 1.090 Tertiary rock
6 7.54 5.88 1.282 Tertiary rock
7 3.08 2.92 1.055 Quaternary rock
8 8.93 5.38 1.660 Quaternary rock
9 5.58 4.81 1.160 Quaternary rock
10 5.50 5.05 1.089 Tertiary rock
11 7.34 5.75 1.277 Quaternary rock
12 5.05 4.02 1.256 Quaternary rock
13 5.99 3.82 1.568 Quaternary rock
14 4.32 3.81 1.134 Quaternary rock
15 4.07 3.09 1.317 Quaternary rock
16 8.80 7.38 1.192 Quaternary rock
17 6.17 5.75 1.073 Quaternary rock
18 6.10 5.41 1.128 Quaternary rock
19 8.54 5.81 1.470 Quaternary rock
20 6.08 5.06 1.202 Quaternary rock
21 5.09 4.71 1.081 Quaternary rock
22 6.82 6.57 1.038 Quaternary rock
23 6.84 4.69 1.458 Quaternary rock
24 6.91 3.18 2.173 Quaternary rock
25 3.85 3.43 1.122 Quaternary rock
26 6.92 6.27 1.104 Quaternary rock
27 9.91 8.78 1.129 Quaternary rock
28 4.63 3.73 1.241 Quaternary rock
29 3.80 3.30 1.152 Quaternary rock
30 4.35 4.09 1.064 Quaternary rock
31 5.20 4.86 1.070 Quaternary rock
32 4.23 3.77 1.122 Quaternary rock
33 6.04 5.24 1.153 Quaternary rock
By using Smf geomorphic index formulation provided the following classification: Class 1 active tectonic (Smf = 1.2-1.6), Class 2 moderate to slightly active tectonic (Smf =
1.8-3.4), Class 3 tectonically inactive (Smf = 2.0-7.0). The Smf value approaches 1.0 with increasing straightness that is used as an indication of recent uplift, which concerned with the recent tectonic activity and future [8]. Generally, the Smf value of the Cilaki watershed is classified into Class 1 as an active tectonic and associated landform include elongated watershed, steep slope, and narrow valley floors. On particularly areas, the Smf value can be clasified into Class 2 – Class 3. We interpret the subsurface active faults in GL 4 as a response to current tectonic activity.
Here we report a result research that combine remote sensing interpretation and geophysics survey. The remote sensing method is useful to interpret relate earth science include as climate changes, meteorite, morphotectonics and volcanism. In order to understanding the sub surface-active fault of Cilaki watershed needed several data analysis by geomorphology approach. It is related with recent tectonic activity.
The results of geophysics survey with electric resistivity method validate the discussion of the geomorphological interpretation. This supports the hypothesis that the study of faults activity on Quaternary volcanic landforms can use both qualitative and quantitative geomorphological methods.
IV.CONCLUSIONS
The resistivity in Quaternary rocks has value between 80 and 450 Ω meters while in Tertiary rocks have value of 6 until 40 Ω meters. Differences in the resistivity value at GL 4 lane with values between 12.5 and 19 Ωmeters are considered anomalies. This indicates that the area has undergone a deformation process as indication of tectonic in the form of active fault. The geo-electric method of the slumberger configuration can be used to identify and more assertive of fracture existence that is active faults in the research area. It is known that the West-East faults with the main compressive force from South to North.
ACKNOWLEDGMENT
The authors give high appreciation to the leadership of Padjadjaran University who has provided internal grant funds 2017-2018 in RKDU scheme. Thank you also to Prof. Dr. Ir. Adjat Sudradjat, M.Sc. as researcher of the Padjadjaran University for his critical remarks and suggestions on morphometric watershed analysis. Widarto ST., Wikaya, Murni and Dedek are gratefully acknowledged for providing relevant literature, methods and GIS Software.
REFERENCES
[1] Helmi, F. and Haryanto, I. 2008. Regional structure pattern of West Java (abstract in English). Bulletin of Scientific Contribution, Vol. 6 No.1: 88-95
[2] Darman H. and Sidi H. 2000. An outline of the geology of Indonesia. Indonesian Assosiation of geologist. Jakarta
[3] Ummah K., Sukiyah E., Rosana M. F. and Syah Alam B. Y. 2018. Remote sensing identification of possible meteorite impact crater on Ciletuh, West Jawa. International Journal on Advance Science Engineering Information Technology. Vol. 8 (2018) N0. 5. ISSN 2088-5334
[5] Sukiyah E., Sunardi E., Sulaksana N. and Rendra R. 2018. Tectonic geomorphology of Upper Cimanuk drainage basin, West Java, Indonesia. International Journal on Advance Science Engineering Information Technology. Vol. 8 (2018) N0. 3. ISSN 2088-5334 [6] Sukiyah, E., Syafri, I., Winarto, JB., Susilo, MRB., Saputra, A., &
Nurfadli, E.2016. Active faults and their implications for regional development at the southern part of West Java, Indonesia. Proceeding of the FIG Working Week 2016, in Christchurch, New Zealand May 2-6, 2016
[7] Hidalgo Hanilyn A. 2015. Vulnerability assessment of agri-ecotourism communities as influenced by climate change. International Journal on Advance Science Engineering Information Technology. Vol. 5 (2015) N0. 6. ISSN 2088-5334
[8] Doornkamp, J. C. 1986. Geomorphological approaches to the study of neotectonics. Journal of Geological Society. Vol. 143: 335-342 [9] Keller, Edward A. & Pinter, Nicholas. 1996. Active tectonics:
Earthquakes, uplift, and landscape. New Jersey: Prentice Hall. [10] Eddy Zulkarnaini Gaffar. 2017. Subsurface geological structure in
South Garut base on electromagnetic data. Ris. Geo. Tam. Vol. 27. No. 2. Desember 2017. V 27. 450
[11] Lutfinur I, Khumaedi, and Susanto H. 2015, Identification of sub surface fault using Slumberger configuration geoelectrical method, Case study in Opak River. Indonesian Journal of Applied Physics, Vol. 5: 10-24.
[12] Moghaddam S., Rouhani A. K. and Amiri A. A. 2017. Subsurface structural characterization of the Chooman Dam site using geoelectric method. Iranian Journal of Geophysics. Page 22-30 [13] Moghaddas Nazer H., Chin Leo, Behnam Rahimi and Asgharn Azadi.
2018. Morpho-tectonic and geoelectric method applied to active faults characterization in Sout of Mashhad plain, Northern of Iran. Geopersia 8 (1). Pp 13-26
[14] Palacky, G. J. 1988. Resistivity Characteristics of Geologic Target, Electromagnetic Method in Applied Geophysics: 52-129.
[15] Alzwar M., Akbar N., & Bachri S. 1992. Geological Map of Garut and Pameungpeuk sheet, Jawa, Scale 1: 100,000, 2nd edition, Geological survey Centre, Geology Agency, Bandung.
[16] Koesmono, K., Kusnama, & Suwarna, N. 1996. Geological Map of Sindangbarang and Bandarwaru Sheet, Scale 1:100,000, 2nd edition, Geological survey Centre, Geology Agency, Bandung.
[17] Permana H., Gaffar E.Z., Sudarsono, Nurohman H., and Indarto S. 2015. Structures and Tectonic of The Southern Flank “Anient Caldera of Garut-Bandung” South Garut West Java. Prosseding of Geoteknology LIPI. Bandung
[18] Dewi Gentana, Nana Sulaksana, Emi Sukiyah and Euis Titin Yuningsih. 2018. Index of active tectonic assessment: Quantitative-based geomorphometric and morphotectonic analysis at Way Belu drainase basin, Lampung Province, Indonesia. International Journal on Advance Science Engineering Information Technology. Vol. 8 (2018) N0. 6. ISSN 5334
[19] Maharani I., Ziaul Faresi T. A., Septian Sari R., and Sugiyanto D. 2018. Identify Landslide Areas Using Resistivity Methods WennerSchlumberger Configuration in Meunasah Krueng Kala Area, Aceh Besar. Journal Aceh Phys. Soc., Vol.7, No.3 pp. 139-143, 2018e-ISSN: 2355-8229
[20] Febriawan Mohamad and Yusi Firmansyah. 2015. The interpretation of the occurence groundwater by geoelectric method. Sukatani distric Purwakarta. Bulletin of Scientific Contribution. Volume 13. Nomor 3. P. 243-249
[21] Susilo A., Sunaryo and Fitriah F. 2018. Ground water investigation using resistivity method and drilling for drought mitigation in Tulungagung Indonesia. International Journal of Geomate. July 2018. Vol. 15. Issue 47. Pp 124-131. Geotech, Cont, Mat & Env., DOI: https://doi org/10.21660/2018.47.98784. ISSN:2186-2982(Print), 2186-2990 (On line) Japan
[22] Sutrisno and Siti Mutia. 2017. The measurenment of subsurface environment at Cibubur region West Java Province. Advances in Intelligent Systems Research (AISR). Vol. 149
[23] Wiyono, Soemarno, Mariyanto S. and Rahmansyah A. 2017. Interpretation of natural water (Sediments) depth patterns around the river Banyuputih Situbondo East Java with method geoelectric resistivity sounding. Resources and Environment 2017. 7(1) 1-7. DOI: 10.5923/j.re20170701.01
[24] Munaji, Syaiful Imam and Ismi Lutfinur. 2013. The andesite resistivity determination by geoelectric schlumbrger configuration (Case study: Polosiri Bawen Semarang). Fisica Journal (In Indonesian). Vol. 3 No. 2. P 117
[25] Telford, M.W., Geldart L.P., Sheriff R.E., dan Keys D.A., 1990, “Applied Geophysics”, Cambridge University Press, USA.