TRENDS IN EMPLOYEES’ COST, PRODUCTIVITY AND
PROFITABILITY:
GAP BETWEEN PUBLIC AND PRIVATE SECTOR BANKS
Himanshu Jain1 Dr. Chandradeep Mishra2
1. Research Scholar
2. Assistant Manager, R Systems International Limited| India, Noida
SHIV SHAKTI
International Journal in Multidisciplinary and Academic Research (SSIJMAR)
Vol. 2, No. 3, May-June (ISSN 2278 – 5973)
ABSTRACT:
Indian banking sector came out from the highly protected environment, provided by the Indian Government, in the beginning of 1990s. The resultant fierce competitive environment, coupled with more stringent regulatory framework, has created pressure to work on their operational efficiency through structural changes and adoption of new technology. All these reforms and technological upgrading have started showing their impact on the performance of Indian banking. This article attempts to examine trend
in performance of Indian banks with the help of trend analysis and Gap Index model. The results have
shown that, public sector banks are improving well in comparison to private sector banks, However, the
performance of public sector banks is still quite low compared to the private sector banks.
KEYWORDS
2
TRENDS IN EMPLOYEES’ COST, PRODUCTIVITY AND PROFITABILITY: GAP
BETWEEN PUBLIC AND PRIVATE SECTOR BANKS
INTRODUCTION
Before 1990s banking sector was working as support system of the government, in a highly protected environment with a strong cushion of the government. There was less focus on profitability and operating efficiency. This lead to decline in operating efficiency and commercially almost wreak. This situation persists not only in the banking sector, but also in the whole financial system of India.
To overcome this inefficiency from the banking system, in 1992, the government constituted a committee under Dr. Narsimhan, to study and recommend reforms for the banking sector. Consequent upon the recommendations, a series of reforms were introduced. The government allowed private sector to enter the banking sector from 1993, and further, the foreign banks from 1994. Several new private sector banks came into existence during 1994-2005 period and several foreign banks established their branches or expanded their existing network. The government also introduced more stringent and rigorous controls in line with Basle-I. These have brought about fierce competition in the banking industry. Enhanced profitability and operational efficiency have become essential for survival and growth of any bank. Faced with the cut throat competition from
the foreign and private sector banks, the public sector banks employed a number of measures to
improve the operational efficiency, meeting customer expectations and reduction of operating
costs. These include, going for fully automated systems (Core Banking Solution based
operations) preceded with Business Process Re-engineering (BPR), offering VRS to its
employees, training and re-training of staff, lateral recruitment of specialists, emphasis on
marketing, advertising, customer relationship management and improving brand image,
diversification of activities, introduction of electronic based multiple service delivery channels,
setting up of back offices and data centers, business process outsourcing. Some of these banks
have undergone restructuring exercise with the involvement of international consulting agencies
to adopt best international practices and remove bottlenecks in their operations. All these reforms
banking. This paper intends to analysis the trends in performance of the public and private sector banks, in relation to each other, spread over a period of 15 years, with the following objectives:
OBJECTIVES
To study the productivity of banks under study.
To study the profitability of banks under study.
To study the compensation pattern of banks under study.
METHODS AND MATERIALS
The secondary data available from Reserve Bank of India’s website, spread over a period of 15
years from 1996 to 2010, constituted the basis of the study. The different components of the data
involved were: Total Business, Profit and Compensation (cost) to the employees of the selected
private and public sector banks.
The data spread over a period of 15 years on the variables under study was subjected to trend
analysis by algebraic method. The time series data was plotted on the graphics and the compound
growth model was found to be most appropriate to analyze the trend. The selected trend model
was:
Y = ABx
Or Log y = log A + x log B
Compound Growth Rate (r) = (B - 1) x 100
The efficiency of the above trend model (compound growth model) was tested by coefficient of determination (R2%).
4
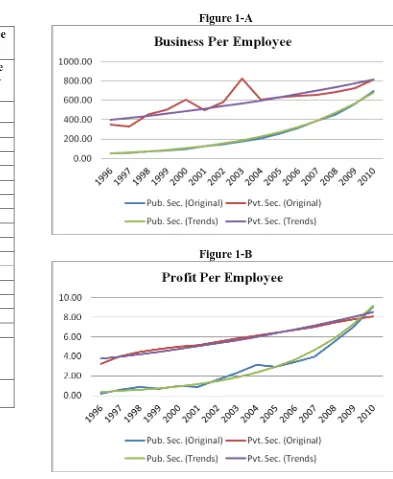
Figure 1-A
Figure 1-B EMPLOYEES’ PRODUCTIVITY
Table-1 Year Business Per Employee
(Rs. Lacs)
Profit Per Employee (Rs. Lacs)
Public Sector Banks
Private Sector Banks
Public Sector Banks
Private Sector Banks
I II III IV V
1996 53.02 350.89 0.23 3.23
1997 59.47 331.89 0.60 4.04
1998 70.52 454.52 0.88 4.45
1999 81.42 501.63 0.71 4.75
2000 98.97 607.82 1.00 4.97
2001 129.36 499.73 0.89 5.12
2002 149.15 583.36 1.61 5.50
2003 174.57 823.32 2.29 5.81
2004 208.49 606.10 3.13 6.10
2005 253.36 632.94 2.93 6.40
2006 316.07 646.63 3.42 6.72
2007 390.17 657.53 3.98 7.01
2008 455.08 684.16 5.50 7.41
2009 562.56 723.29 7.02 7.76
2010 697.37 812.56 9.05 8.09
Compound Growth
Rate 20.38% 5.26% 25.42% 5.99%
Geometric
Mean 180.59 565.84 1.88 5.65
In the present investigation, business per employee and profit per employee has been considered
as a proxy to employees’ productivity for the study purpose. The time series data on business per
employee and profit per employee for a period of 15 years from 1996 to 2010 has been
summarized in the table 1. The data was subjected to trend analysis and the constants of trend
equations estimated by the method of least square to be:
1. Business Per employee a. Public Sector Banks
Y = 40.92 (1.2038)x b. Private Sector Banks
Y = 375.23(1.0526)x 2. Profit Per Employee
a. Public Sector Banks
Y = 0.31 (1.2542)x b. Private Sector Banks
Y = 3.55 (1.06)x
The coefficient of determination for the above 4 functions were of the order of 93%, 91%, 96%
and 89% respectively. It was noticed that the growth models fitted above were very highly
significant. It indicates that the business per employee as well as profit per employee in both the
sectors are growing at a faster rate with compound growth rate of 20.38%, 5.26%, 25.42% and
5.99% annually respectively. The analysis indicated that the growth in public sector banks with
regards to employees’ productivity was growing faster than the private sector banks whereas in
terms of monetary values private sector banks were ahead of the public sector banks as is evident
in table 1. Business per employee has grown from Rs. 53.02 lacs in 1996 to Rs. 697.37 lacs in
2010 in public sector banks and from Rs. 350.89 lacs to Rs. 812.56 lacs in private sector banks.
Similarly the profit per employee in public sector banks has grown from merely Rs. 0.23 lacs in
1996 to Rs. 9.05 lacs in 2010. In case of private sector banks profit per employee has grown
from Rs. 3.23 lacs in 1996 to Rs. 8.09 lacs in 2010. Table 1 also gives the geometric means of
parameters under study. Since the growth pattern is found to be geometric in nature, geometric
means are most appropriate measure of central values. The glimpse of the table 1 indicated that
up to year 2000 the growth was moderate for all the four columns of the data and faster beyond
6
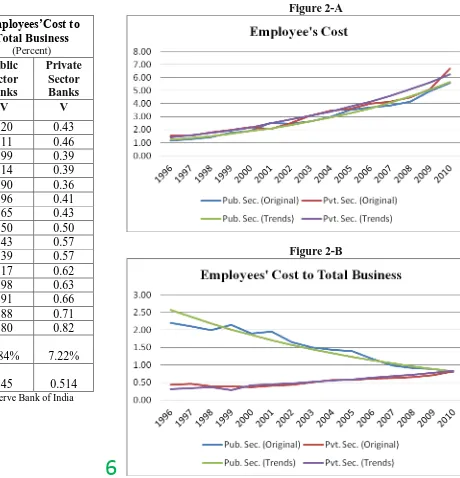
Figure 2-A
Figure 2-B EMPLOYEES’ COST
Table-2
Year Employees’Cost (Rs. Lacs)
Employees’Cost to Total Business
(Percent) Public
Sector Banks
Private Sector Banks
Public Sector Banks
Private Sector Banks
I II III IV V
1996 1.16 1.52 2.20 0.43
1997 1.25 1.52 2.11 0.46
1998 1.40 1.79 1.99 0.39
1999 1.75 1.97 2.14 0.39
2000 1.88 2.19 1.90 0.36
2001 2.53 2.04 1.96 0.41
2002 2.46 2.50 1.65 0.43
2003 2.62 3.08 1.50 0.50
2004 2.98 3.46 1.43 0.57
2005 3.51 3.61 1.39 0.57
2006 3.70 3.98 1.17 0.62
2007 3.84 4.13 0.98 0.63
2008 4.16 4.50 0.91 0.66
2009 4.95 5.11 0.88 0.71
2010 5.57 6.67 0.80 0.82
Compound
Growth Rate 11.60% 10.67% -7.84% 7.22%
Geometric
Mean 2.62 2.91 1.45 0.514
The time series data on employees’ cost and employees’ cost to total business has been
summarized in the table 2 for a period of 15 years from 1996 to 2010. The data was subjected to
trend analysis and the trend equations estimated found to be:
1. Employees’ Cost
a. Public Sector Banks
Y = 0.418 (1.116)x
b. Private Sector Banks
Y = 1.49 (1.1067)x
2. Employees’ Cost to Total Business
a. Public Sector Banks
Y = 2.786 (0.9216)x
b. Private Sector Banks
Y = 0.294(1.072)x
The coefficient of determination for the above 4 functions were of the order of 97%, 92%, 99%
and 96%. It was noticed that the growth models fitted above were very highly significant.
Employees’ cost was growing with a compound growth rate of 11.60% in public sector and
reached from Rs.1.16 lacs in 1996 to Rs. 5.57 lacs in 2010. Private sector reported growth of
10.67% and reached from Rs. 1.52 lacs to Rs. 6.67 lacs in 2010. The opposite direction was
noticed in growth trend of employees’ cost to total business. Employees’ cost to total business
declined at -7.84% in public sector and reached from 2.20% in 1996 to 0.80% in 2010. The
growth of 7.22% was reported in private sector banks and reached from 0.43% to 0.82% in 2010.
The analysis indicated that the growth in public sector banks with regards to employees’ cost
was growing almost at the same rate in both the sector with of difference of 1% only.
Employees’ cost has grown from Rs. 1.16 lacs in 1996 to Rs. 5.57 lacs in 2010 in public sector
banks and from Rs. 1.52 lacs to Rs. 6.67 lacs in private sector banks. In public sector employees’
cost to total assets has shown decay of 7.84% and private sector has shown growth of 7.22% and
reached from 2.20% to 0.80% and 0.43% to 0.82% in private sector over a span of 15 years.
8
pattern was found to be geometric in nature, geometric means are most appropriate measure of
Figure 3-A
Figure 3-B GAP INDEX
Table-3 Year Business
Per Employee
(Rs. Lacs)
Profit Per Employee (Rs. Lacs)
Employees’ Cost (Percent)
Employees’ Cost to
Total Business
(Percent)
I II III IV V
1996 73.74 12.82 13.39 66.97
1997 69.61 5.78 9.65 64.27
1998 73.14 4.07 12.16 66.93
1999 72.07 5.67 6.13 68.99
2000 71.99 3.96 7.42 68.22
2001 58.87 4.73 10.86 65.54
2002 59.28 2.42 0.81 58.75
2003 65.01 1.54 8.11 50.36
2004 48.81 0.95 7.48 42.89
2005 42.83 1.18 1.38 41.70
2006 34.34 0.97 3.70 31.03
2007 25.52 0.76 3.69 22.04
2008 20.11 0.35 3.88 16.35
2009 12.50 0.11 1.61 10.91
2010 7.63 0.11 9.03 1.42
Percentage Reduction from 1996 to
10
It has been observed from Table 3 above and the Charts 3-A and 3-B that the gaps between
public and private sector banks on all the parameters have been coming down consistently from
1996 to 2010 except for few correction in the downward pattern of profit per employee (1999
and 2005), employees’ cost (2003 and 2010) and employees’ cost to total business (1999). A
perusal of the table 3 indicated that, the gap index in respect of business per employee has
reduced from 73.74% to 7.63%. In case of profit per employee gap index has reduced from
12.82% to 0.11%. The gap in respect of employee’ cost and employees’ cost to total business
reached from 13.39% to 9.03% and from 66.97% to 1.42% respectively. The gap was highest in
business per employee (73.74%) and lowest in profit per employee (12.82%) in the beginning of
the study period but at end of the study period, the highest gap was in employee’ cost (9.03%)
and the lowest in profit per employee (0.11%). The highest reduction was observed in profit per
employee (99.17%) and lowest reduction was in employee cost (32.54%) over the study period.
CONCLUDING OBSERVATIONS
The data spread over a period of 15 years (1996-2012) in respect of public and private sector banks
for different economic indicators like business per employee, profit per employee, employees’ cost and employees’ cost to total business was subjected to trend analysis. The most appropriate trend
for the data was selected as compound growth model (semi log). The trend has shown a very good
fit with high degree of coefficient of determination for the entire set of indicators under study. The
analysis has reveled that business per employee was growing @ 20.38% in public sector and 5.26%
in private sector compounded annually. The profit per employee has grown at 25.42% and 5.99% in
two sectors respectively. The growth of employees’ cost has been estimated to be 11.60% and 10.67% in two sectors along with employees’ cost to total business showing a negative growth
(decay) of 7.84% and 2.20% in the two sectors respectively. The study has shown a wide gap in
business per employee as well as employees’ cost to total business in the initial year and narrowed down subsequently. However, profit per employee and employees’ cost, the gap was comparatively
low and has shown divergent trend. The study has shown that the two sectors are competing to
achieve their targets and public sector banks have taken remedial measures to improve its
productivity and meet the challenges of private sector. However, the performance of public sector
banks is still quite low compared to the private sector banks. Public sector banks need to continue
competing with the private sector banks. It is also interesting to note that there is overall
reduction in the Gap index in different parameters during the study period. However, the trend
has to be closely monitored to reach the final conclusion.
REFERENCES
1) Claessens, S., Demirguic-Kunt, and H. Huizinga (2001), “How Does Foreign Entry
Affect the Domestic Banking Sector?”, Journal Banking and Finance, vol. 25.
2) Chatterjee, P.K. (1979), “Bank Profitability- The Real Issue”, The Journal of Indian
Institute of the Bankers, Vol.45, No. 3.
3) Chaudhuri, S. (2002), “Some Issues in Growth and Profitability in Indian Public Sector
Banks”, Economic and Political Weekly, vol. 37, No. 6.
4) Shanmugam, K. R.,& Das, A.(2004), “Efficiency of Indian Commercial Banks During
the Reform Period”, Applied Financial Economics, Taylor and Francis Journals, vol. 14.
5) Kumar, S., and Sreeramulu, M. (Winter 2007), “Employees’ Productivity and Cost- A
Comparative Study of Banks in India During 1997 to 2008”, Reserve Bank of India
Occasional Papers, Vol. 28, No. 3.
6) Kumar Lakshmi, Malathy, D., and Ganesh, L.S., (2010) "Productivity Growth and
Efficiency Change in Indian Banking: Technology Effect vs Catch-Up Effect", Journal of
Advances in Management Research, Vol. 7, Issue: 2.
7) Mittal, Manish and Aruna Dhade (May, 2007), “Profitability and Productivity in Indian
Banks: A Comparative Study”, AIMS International, Volume 1, No. 2.
8) Rakesh Mohan, “Reforms, Productivity and Efficiency in Banking”, The Indian
Experience, Address Delivered at the 21st Annual General Meeting and Conference of the
Pakistan Society of Development Economists at Islamabad in December 2005.
9) Reserve Bank of India, Trend and Progress of Banks in India, various issues
(1996-2010)
10) Reserve Bank of India (1977), Report of the Productivity, Efficiency and Profitability
Committee on Banking, (Luther Committee).
11) Reserve Bank of India, Statistical Tables Relating to Banks in India.
12) www.business-beacon.com, Dated 5th November 2012.