Disclosure of Goodwill Impairment in the Baltic States
Alfreda Sapkauskiene, Sviesa Leitoniene, Eligija Vainiusiene
Kaunas University of Technology
K. Donelaicio st. 73, 44029, Kaunas, Lithuania
E-mail. alfreda.sapkauskiene@ktu.lt, sviesa.leitoniene@ktu.lt, eligijavainiusiene@gmail.com
http://dx.doi.org/10.5755/j01.ee.27.4.15360
International accounting standards provide recommendations that specify which factors should be taken into consideration prior to the determination of goodwill impairment; however, decisions on goodwill impairment disclosures are mainly conditioned by the influence of managers and other factors based on self-interests. Therefore, the objective of the article is to perform research on goodwill impairment managed by companies that are listed by the NASDAQ OMX Baltic Stock Exchange and to determine factors and causes influencing decisions on goodwill impairment. Findings show that the replacement of managers has an effect on disclosing losses of goodwill impairment. In addition, companies are inclined to recognize goodwill impairment losses under the most favourable circumstances. The indebted companies are more inclined to disclose goodwill impairment. Furthermore, results of the study demonstrated that an economic crisis experienced by a country affects the disclosure of goodwill impairment; however, it does not have an effect on the written-off quantity of goodwill amounts.
Keywords: Goodwill Impairment, IFRS, Earnings Management, Disclosure of Goodwill.
Introduction
In recent years, scientific research literature (Huikku et al., 2016; Fillip et al., 2015; Jordan & Clark, 2015; Paugman & Ramond, 2015; Giner & Pardo, 2014; Iatridis & Senftlechner, 2014) and real world situations have witnessed a rise in discussions analysing the significance of goodwill impairment and its influence on company performance results. The inclusion of goodwill into financial statements and the prevalence of its amounts (especially if they are of certain value) in balance sheets attract the interest of investors, auditors and other users of financial statements. Due to its growing relative portion that forms company assets, goodwill is gaining more and more importance as a financial element of accounting. Thus, the increasing portion of goodwill in a balance sheet has impact on the reasons for research on its changes.
In accordance with the International Financial Reporting Standards, companies, which prepare consolidated financial statements for periods beginning as of 1 January 2005, shall apply the goodwill impairment testing method to the accounting of goodwill. The standards require that goodwill impairment should be reviewed once a year, but if there are certain indications that have an effect on goodwill impairment. However, these standards provide only narrow instructions on how goodwill impairment should be assessed and what indications affect goodwill impairment (Van de Poel et al., 2009; Bepari et al., 2011).
When amendments were introduced to goodwill accounting provisions, it was anticipated that financial statements would correspond to economic reality and their users would consider them more reliable. However, as scientific research shows, fair value-based goodwill impairment testing provides managers with a possibility to selfishly manipulate information (Lemans, 2010; Ramana
and Watts, 2011; Saastamoinen & Pajunen, 2012; Iatridi & Senftlechner, 2014; Darrough et al., 2014; Giner & Pardo, 2014; Jordan & Clark, 2015). Hence, the main problem is that when the accounting method for goodwill amortization is replaced with the unpredictable testing for goodwill impairment, the external users of financial statements find it difficult to establish when goodwill impairment occurred and when goodwill impairment will occur. In addition, owing to the probability of opportunistic goals of managers, the users of financial statements cannot be certain about whether goodwill write-offs were properly executed. Therefore, a great deal of the latest scientific research related to goodwill impairment is aimed at revealing the basic factors and causes of goodwill impairment (Ramanna & Watts, 2008; Van de Poel et al., 2009; Lemans, 2010; Camodeca & Almici, 2012; Jarva, 2012; Saastamoinen & Pajunen, 2012; Jamaliah, 2013; Rehman & Shahzad, 2014; Fillip et al., 2015, Paugman & Ramond, 2015; Andre et al.,
2015). It is also important to determine whether it is possible to rely upon goodwill impairment disclosed in financial statements, when it comes to the new member states of the European Union such as the Baltic States, which include Lithuania, Latvia and Estonia.
The objective of the article is to perform research on goodwill impairment managed by companies that are listed by NASDAQ OMX Baltic Stock Exchange and to determine factors and causes influencing decisions on goodwill impairment. It is necessary to mention that a number of scientists chose listed companies as a research sample (Giner & Pardo, 2014; Hamberg et al., 2011).
indicators, the Pearson correlation analysis (dealing with the strength of relationship), and simulation and comparison methods.
Factors Influencing Goodwill Impairment
Intangible assets, including goodwill, are currently of great relevance. In contemporary economics, intangible assets are an important part of value creation. The balance sheets of companies listed by the NASDAQ OMX Baltic Stock Exchange demonstrate that the amount of goodwill increased from 30,000 to 155,000 Euros during the 2005– 2013 period. There is also a continuous rise in the ratio between goodwill and total assets (from 0,02 to 0,045). It is possible to relate this to a continuous increase in mergers and acquisitions within the market of the Baltic States. Goodwill attracts the interest of investors, auditors, and preparers and other users of financial statements; therefore, there is a need for comprehensive information about goodwill. Accounting standards require that all the companies should review their goodwill each year for possible impairment. In accordance with the current accounting guidelines, i.e. the 36th International Accounting Standard (IAS) on Impairment of Asset, goodwill impairment testing shall be performed once a year, and if an event occurs or there is a change in circumstances that is likely to reduce the fair value of an accounted unit below its balance value, an additional review for possible goodwill impairment shall be conducted in the course of the year. According to the Lithuanian National Accounting Standards, when goodwill impairment is determined, companies begin to apply the procedure established by the 23rd Business Accounting Standard (BAS) for Impairment of Assets based on which assets are deemed impaired if their balance value is higher than their recoverable value. If there is a significant difference, the balance value of such assets shall be decreased down to the recoverable value and the amount by which assets are reduced is recognized as a loss due to impairment.
International and Business Accounting Standards provide a list of examples and proposals for goodwill impairment testing (Part 12 of the IAS 36, Part 3 of the BAS 23). Accounting standards focus on a number of factors that condition goodwill impairment and receive comprehensive coverage in scientific research papers (Ramanna & Watts, 2008; Van de Poel et al., 2009; Lemans, 2010; Camodeca & Almici, 2012; Jarva, 2012; Saastamoinen & Pajunen, 2012; Jamaliah, 2013; Rehman & Shahzad, 2014; Fillip et al.,
2015, Paugman & Ramond, 2015; Andre et al., 2015). At the same time, the analysis of scientific research literature showed that there are plenty of other reasons conditioning companies reach a decision on goodwill impairment in contrast to what accounting standards indicate. (Sapkauskiene & Leitoniene, 2014; Fillip et al., 2015; Huikku et al., 2016). Only the most frequently researched causes are discussed thoroughly in this article.
The analysis of scientific literature allowed discovering a great deal of research proving that company managers have the greatest influence on making decisions whether or not to disclose goodwill impairment and many reasons impact the decisions that are reached by company managers (Lemans, 2010; Ramana & Watts, 2011; Saastamoinen & Pajunen, 2012; Iatridi & Senftlechner, 2014; Darrough et al.,
2014; Giner & Pardo, 2014; Jordan & Clark, 2015).
Scientific research proved that companies, which witnessed the change of managers, are more inclined to disclose the losses of goodwill impairment. This decision is based on the fact that new managers seek to reduce the probability of the disclosure of goodwill impairment and to exhibit better performance results while holding managerial positions (AbuGhazaleh et al., 2011; Hamberg et al., 2011). Lemans (2010) maintains that the change of managers is a cause that affects the disclosure of large losses of goodwill impairment. In addition, the selection of new managers is related to the endeavour to disclose improper acquisitions executed by former managers and to improve their image. (Masters-Stout
et al., 2008).
did not establish the connection between negative financial results and goodwill impairment disclosures.
Goodwill impairment has a negative effect on financial results and usually prompts a negative reaction of investors, which manifests itself in a decline in share prices (Escaffre & Sefsaf, 2010; Aquino et al., 2011). The negative response of investors also occurs when companies are heavily indebted. The disclosure of goodwill impairment increases the relative level of debt and capital; therefore, there is a great likelihood that company’s debt avoids disclosing the losses of goodwill impairment. However, the research conducted by Jamaliah (2013) demonstrated opposite results and did not determine an important link between the level of company debt and the disclosure of goodwill impairment, and this can be identified as another reason influencing decisions on goodwill impairment.
In the area of scientific research, the size of companies is yet another one of the most common factors assigned to company characteristics and known to have a significant relation with the disclosure of goodwill impairment (Lemans, 2010; Ramana & Watts, 2012; Saastamoinen & Pajunen, 2012; Jamaliah, 2013). As a result of the visibility and accessibility of large companies, they encounter more external observations and attract more attention from investors and analytics, which imposes pressure on the senior management to use timely decisions on the disclosure of goodwill impairment (Zang, 2008; Ramanna & Watts, 2012; Lemans, 2010; Saastamoinen & Pajunen, 2012). In addition, scientific research showed that larger companies execute more business mergers or acquisitions and are more inclined to disclose the losses of goodwill impairment, which results in the disclosure of larger losses of goodwill impairment. However, it is necessary to mention that in contrast to the majority of scientific research, Petersen and Plenborg (2010) failed to establish connections between the size of companies and the disclosure of goodwill impairment.
An economic crisis is one of the most important economic factors increasing the uncertainty about net cash flows and goodwill impairment losses. According to Sutthachai and Cooke (2009), when a country experiences an economic crisis, it implies a relevant economic disturbance that contributes to changes in the environment of financial accountability. Many scientists provided substantiation in their research that companies are inclined to write off larger amounts of goodwill during the economic crisis (Bepari et al., 2011; Camodeca & Almici, 2012).
Thus, goodwill impairment disclosures are mostly impacted by opportunistic goals that involve pursuing improvements in the company’s financial situation. Even though the analysis of literature demonstrated that accounting standards provide recommendations that specify which factors should be taken into consideration prior to the determination of goodwill impairment, scientific research revealed that decisions on goodwill impairment disclosures are mainly conditioned by the influence of managers and other factors based on self-interests.
Hypotheses
Development
and
Model
Specification
The analysis of scientific research showed that in seeking to disclose goodwill impairment, the following
two-fold problems are solved: whether or not to recognize goodwill impairment and to which extent the value of goodwill should be reduced. Therefore, the following two-fold hypotheses are raised by taking into consideration the main causes of decisions reached to reveal goodwill impairment, which are most frequently singled out in scientific research.
H1A: Companies, which witnessed the change of managers, are more inclined to disclose goodwill impairment.
H1B: Companies, which witnessed the change of managers, are more inclined to disclose a larger amount of goodwill impairment.
H2A: Companies, which demonstrate a negative financial result, are more inclined to disclose goodwill impairment.
H2B: Companies, which demonstrate a negative financial result, are more inclined to disclose a larger amount of goodwill impairment.
H3A: Companies, which demonstrate a higher level of debt, are more inclined not to disclose goodwill impairment. H3B: Companies, which demonstrate a higher level of debt, are more inclined to disclose a smaller amount of goodwill impairment.
H4A: Large companies are more inclined to disclose goodwill impairment.
H4B: Large companies are more inclined to disclose a larger amount of goodwill impairment.
H5A: Companies are more inclined to disclose goodwill impairment during the economic crisis.
H5B: Companies are more inclined to disclose a larger amount of goodwill impairment during the economic crisis.
Since these are two-fold hypotheses encompassing different accounting decisions, the following distinct regression models are applied with regard to the present research: the binary logistic regression model, which involves the modelling of a binary dependent variable, and the linear regression model, which involves the modelling of an interval variable.
The binary logistic regression model, which was also applied by scientists Verriest & Gaeremynck (2009), Bepari
et al. (2011), Darrough et al. (2014) in order to research goodwill impairment decisions, is written down in the following manner:
GWIMP=C+b1(MNGCH)+b2(EARN)+b3(DEBT)+b4(SI
ZE)+b5(CRISIS)+b6(SALES)+b7(OCF)+b8(ROA)+b9(M
VR)+b10(GDP)+b11(VALUE) (1)
where b1, b2, b3, b4, b5, b6, b7, b8, b9, b10, b11 and C are the
estimated parameters of the model. The linear regression model was also applied by Verriest and Gaeremynck (2009), Lemans (2010), as well as Saastamoinen and Pajunen (2012) in order to establish the influence of certain factors on the magnitude of goodwill impairment. The linear regression model incorporates the same variables as the first model does and the model equation is written down in the following manner:
GWAMOUNT=C+b1(MNGCH)+b2(EARN)+b3(DEBT)
+b4(SIZE)+b5(CRISIS)+b6(SALES)+b7(OCF)+b8(ROA)
+ b9 (MVR)+b10(GDP)+b11(VALUE) (2)
where b1, b2, b3, b4, b5, b6, b7, b8, b9, b10, b11 and C are the
research, two dependent variables are used because one seeks to determine both the selection of goodwill impairment, i.e. whether or not to disclose goodwill impairment for the respective year, and the decision on the basis of which the amount of goodwill impairment is established. As the first decision uses two values, in the first model, a dependent variable stands as goodwill impairment (GWIMP) and takes the value of 1 if the company has disclosed the losses of goodwill impairment, otherwise it is equal to 0. In the second model, a dependent variable stands as an amount of goodwill impairment (GWAMOUNT) and is equal to the amount of goodwill impairment present during the company’s current year, or year t, divided by the entire assets of the previous year in seeking to determine the ratio between goodwill and assets prior to the disclosure of the losses of goodwill impairment.
For confirmation of the hypotheses raised, the study uses quantitative and qualitative independent variables as explanatory variables in the regression models. They measure how change of managers, earnings management, company debt level, company size and economic crisis affects probability of disclosure of impairment of goodwill and the amount of impairment of goodwill being disclosed.
The first hypotheses, H1A and H1B, aim to investigate the influence of management change on the decisions for disclosure impairment of goodwill. An independent variable change of managers (MNGCH) is a factor to which value 1 is assigned in case of change of the management in year t-1 and t, and 0 otherwise. Since scientific research has shown that the new managers encouraged by some reasons tend to disclose goodwill impairment losses, we predict a positive (+) connection between new manager and disclosure of goodwill impairment and amount being disclosed.
Sets of the second and third hypotheses are related to internal financial factors. Hypotheses H2A and H2B are related to earnings management, while H3A and H3B – to the debt level of the company.
In order to investigate whether managers are tending to use forms of earnings, the regression models include the independent variable earnings management (EARN). Calculation of this variable primarily requires determining company‘s financial result prior to disclosure of goodwill impairment. Furthermore, we calculate change in determined financial result, which is divided by the total assets. Calculation of negative variable EARN requires selection of negative values and calculation of their median each year. When change of company‘s financial result in the relevant year is lower than the median for all companies, the regressor acquires value 1, otherwise it is equal to 0. The majority of scientists use the industry‘s median to research whether the companies manage earnings. Since the research sample involves too small number of companies in certain industries, in this case, we use a median of companies participating in the research. It is assumed that in cases of a negative financial result, company managers may be inclined to use the earnings-reducing accounting procedures and disclose goodwill impairment losses. Therefore, it is expected a positive connection (+) between dependent variables and the independent variable EARN.
Hypotheses H3A and H3B investigate the impact of the debt level of a company on goodwill impairment decisions. The independent variable company‘s debt level (DEBT)
shows the long-term and short-term debt and capital ratio at the beginning of year t (or at the end of year t-1) of a company, i.e. before disclosure of the goodwill impairment losses. The debt to equity ratio at the beginning of year t shows the company‘s financial situation prior to disclosure or non-disclosure of goodwill impairment. High indicator of this ratio may show higher financial risks. Therefore, as shown by scientific research, those companies which are more indebted tend not to disclose the goodwill impairment losses (Zang, 2008; AbuGhazaleh et al., 2011). Therefore, it is assumed that a higher debt to equity ratio produces a greater probability that the companies seek to avoid disclosure of goodwill impairment losses or disclose a lesser amount. Consequently it is expected to have a negative (-) connection between this variable and independent variables.
The fourth hypotheses, H4A and H4B, are related to company size. The independent variable company size (SIZE) is calculated as the company‘s total assets natural logarithm at the end of year t. Most scientific research shows that larger companies usually carry out more business acquisitions or mergers leading to inclination to disclose goodwill impairment and the of goodwill impairment being disclosed is correspondingly larger (Zang, 2008). Consequently, it is expected to have a positive (+) connection between this independent variable and dependent variables.
The last hypotheses, H5A and H5B, aim to investigate the impact of the economic crisis on goodwill impairment decisions. The independent variable economic crisis (CRISIS) is a factor the value of which it is equal to 1 in the periods of year 2008–2009, and is equal to 0 in other periods. Scientific research has shown that the economic crisis has a strong influence on goodwill impairment decisions. As a consequence of the financial crisis, i.e. collapse of the property market, deep recession increases the uncertainty for the cash-flows that increase the probability for disclosure of goodwill impairment. It is therefore expected that there is a positive (+) connection between CRISIS and the dependent variable.
Scientific literature presents many reasons that can influence decisions on goodwill impairment. Therefore, having determined to ensure that the research is as thorough as possible and having evaluated the possibility of data accessibility, the following control variables are incorporated into the models in addition to the above-mentioned regressors: the value of goodwill on a balance sheet (VALUE), a change in sales (SALES), a change in operational cash flows (OCF), a change in return on assets (ROA), a relationship between the market value and the balance sheet value (MVR) and a change in the gross domestic value (GDP).
The variable value of goodwill (VALUE) is also included into the regression models in order to establish its possible impact on the decision reached with regard to goodwill impairment (Zang, 2008; Van de Poel et al.,
goodwill on their balance sheets, are more inclined to disclose the losses of goodwill impairment.
Furthermore, scientific research papers point to the fact that poor company performance results can also have an effect on decisions made in relation to goodwill impairment. Thus, based on the available scientific research (Van de Poel
et al., 2009; Lemans, 2010; Saastamoinen & Pajunen, 2012; Jamaliach, 2013), the regression models include the most common performance indicators, i.e. a change in sales (SALES), which is calculated as a shift in company sales from t-1 to t being divided by total assets at the end of the year t-1, and a change in operational cash flows (OCF), which is calculated as a shift in basic operational cash flows from t-1 to t being divided by total assets at the end of the year t-1. These variables are divided by total assets in order to prevent the significant distortion of regression results and to ensure their comparability among companies (Riedl, 2004). The third variable, a change in return on assets (ROA), is calculated as a percentage shift in return on assets from the year t-1 till year t. A negative relationship with dependent variables is forecasted in the case of the aforementioned variables since a decrease in variables shows a deterioration in company performance results, which leads to an increase in the likelihood that the disclosure of goodwill impairment will occur eventually. Yet another performance indicator is a relationship between the market value and the balance sheet value. In accordance with the recommendations provided by the International Financial Reporting Standards, when performing goodwill impairment testing, one should consider this indicator, which is calculated by dividing the market share price by the accounting value at the end of the year t. A high ratio of this indicator implies that investors believe in the company’s growth potential and there is no need to disclose the losses of goodwill impairment. As a result, it is predicted that there is a negative relationship between this regressor and goodwill impairment-related decisions.
Moreover, in order to assess how general economic changes affect decisions reached with regard to goodwill impairment, the regression models incorporate an additional variable a change in gross domestic product (GDP). A negative shift in this indicator demonstrates that the country is experiencing a recession and this has a negative impact on the fair value of assets. Asset impairment increases the probability that the company will disclose the losses of goodwill impairment and there will be a larger amount of losses; therefore, it is forecasted that there is be a negative relationship between this variable and dependent variables.
In order to verify the suitability of the model, the statistical regression analysis is applied, which comprises the verification of the suitability of the model to be used for data and the preliminary suitability of variables. First, the strength of the intercorrelation between the variables is established, i.e. it is verified whether the problem of multicollinearity prevails. Secondly, the regression model is developed and the size of the coefficient of determination is assessed (only in the case of the binary logistic regression model). Third, it is verified whether the p value of the likelihood ratio criterion (the Fisher criterion or the likelihood ratio test) stands ˂ 0.05. Fourth, it is verified whether all the variables are statistically significant (the p values of Student’s t-tests are < 0.05). If they are not, the
model is adjusted, i.e. insignificant variables are removed one by one beginning with a variable that has the highest value and recalculating the regression equation. Fifth, the regression model is developed, which incorporates only the most significant variables.
The execution of the empirical research encompassed the use of information available from the annual reports of companies listed by NASDAQ OMX Baltic Stock Exchange. The mathematical statistical analysis was performed by combining Microsoft Office Excel applications with Eviews8 and SPSS19 applications for statistical data processing.
Empirical Results
Data Source and Sample Selection
In order to verify the hypotheses presented and to perform the study, the consolidated financial statements of companies listed in the official and additional trade list in the NASDAQ OMX Baltic Stock Exchange and stock Exchange data were used.
All companies listed on NASDAQ OMX Baltic Stock Exchange, during preparation of financial statements must follow the accounting standards and prepare consolidated accounting in accordance with the requirements of International Financial Reporting Standards. According to IFRS, all companies quoting its shares at the regulated markets in the European Union must submit consolidated reports for accounting periods beginning from 1 January, 2005. Therefore, in order to perform a comprehensive investigation, the study was performed based on data provided in consolidated financial statements for the period of 2005–2014. Data on goodwill impairment from the annual financial statements were manually collected, while the exchange differences were converted into Euros using the Bank of Lithuania Exchange Rates at the balance sheet date.
10 companies from Lithuania and Estonia and 7 companies from Latvia have been selected for study. As the study involves similar amounts of companies from all Baltic countries, it provides the opportunity to compare countries with each other for goodwill impairment disclosure.
All companies listed on the NASDAQ OMX Baltic Stock Exchange are classified according the Global Industry Classification Standard – GICS, which allows comparing companies with the ones involved in similar activities. The study involves companies covering seven industry sectors. As evidenced by the selected data, there is no possibility to compare companies by sector of activity, as sectors such as telecommunications, financial services and basic materials are represented by a very small number of companies due to the lack of data.
A Descriptive Analysis of Study Sample
The results provided in part A in table 1 show that within the study period, the average size of goodwill in the balance sheet compared to the total assets (VALUE) consists of 5% at the beginning of the year. Average goodwill impairment amount (GWAMOUNT) is equal to 0,2 proc. of total assets. Management has been changed (MNGCH) in twenty companies (50 observations) and it amounted to 24 percent on average. The results in table 2 show that the goodwill impairment (GWIMP) from the total study sample covering 207 observations in 27 companies was 20 percent. In order to compare variable results of companies that disclosed and did not disclose goodwill impairment losses, the entire study sample in part B of table 1 is divided into two parts, i.e. data of observations of companies that disclosed and did not disclose goodwill impairment losses are provided separately.
Table 1 A Descriptive Analysis of Study Sample
Part A: The statistical analysis of the data for the entire study sample
PERFORMANCE DATA / VARIABLES n Maximum Minimum Mean Median Std. Dev.
Dependent variables
GWIMP 207 1.00 0.00 0.20 0.00 0.40
GWAMOUNT 207 0.06 0.00 0.002 0.00 0.009
Independent variables
MNGCH 207 1.00 0.00 0.24 0.00 0.43
EARN 207 1.00 0.00 0.21 0.00 0.41
DEBT 207 13.72 0.016 1.42 1.12 1.71
SIZE 207 14.48 8.28 11.43 11.36 1.24
CRISIS 207 1.00 0.00 0.25 0.00 0.43
Control variables
SALES 207 5.65 -1.41 0.13 0.04 0.51
OCF 207 1.67 -0.9 0.007 0.004 0.17
ROA 207 0.71 -0.65 -0.003 -0.0015 0.13
MVR 207 7.09 0.00 1.37 0.96 1.20
GDP 207 11.00 -17.70 2.02 3.7 7.59
VALUE 207 0.51 0.00 0.05 0.005 0.10
Part B: Statistical analysis of companies, which revealed and not revealed goodwill impairment losses
PERFORMANCE DATA / VARIABLES
Data of companies, which disclosure goodwill impairment losses (n-41)
Data of companies, which doesn’t disclosure goodwill impairment losses (n-166)
Mean Median Std. Dev. Mean Median Std. Dev.
Depended variables
GWIMP 1.00 1.00 0.00 0.00 0.00 0.00
GWAMOUNT 0.01 0.005 0.017 0.00 0.00 0.00
Independent variables
MNGCH 0.54 1.00 0.51 0.17 0.00 0.38
EARN 0.41 0.00 0.49 0.16 0.00 0.37
DEBT 2.31 1.44 3.08 1.19 1.02 1.06
SIZE 11.55 11.49 1.00 11.40 11.31 1.30
CRISIS 0.49 0.00 0.51 0.19 0.00 0.4
Control variables
SALES -0.02 -0.014 0.44 0.16 0.06 0.52
OCF -0.001 -0.004 0.09 0.01 0.005 0.19
ROA -0.05 -0.03 0.17 0,01 0.001 0.12
MVR 1.63 0.93 1.71 1.31 1.01 1.04
GDP -1.38 1.6 9.03 2.86 3.9 6.97
VALUE 0.081 0.014 0.13 0.046 0.001 0.09
The results provided in part B of table 1 show that the amount of goodwill (VALUE) in the balance sheet of the companies that disclosed goodwill impairment losses is almost twice that of the companies which did not disclose goodwill impairment. Based on these data, we can make preliminary conclusions that larger amount of goodwill in the balance sheet affects goodwill impairment disclosure. These results correspond to the scientific studies (Master-Stout et al., 2008; Zang, 2008; Van de Poel et al., 2009; Bepari et al., 2011) which found that the companies with higher goodwill in the balance sheet are more likely to disclose goodwill impairment losses.
Further analysis of part B of table 1 shows that managers changed (MNGCH) more often in the companies that disclosed goodwill impairment losses. These results are
consistent with the majority of scientific research and allow preliminary conclusions that the first hypothesis should be accepted.
The average of variable earning management (EARN) among analyzed companies that have adopted different decisions also significantly differ. This shows that the unprofitable companies are more likely to disclose goodwill impairment losses and allows predicting that the hypotheses related to earnings management will be accepted.
agree with the findings by Jamaliah (2013). The results obtained show that the third hypothesis should be rejected.
Assessment of company‘s size results obtained show that the average of variable SIZE of the companies that disclosed goodwill impairment losses is higher than that of the companies that did not disclose goodwill impairment losses. Although the difference is small, it can be preliminary concluded that the larger companies are more likely to disclose goodwill impairment losses. The results also show acceptance of the fourth hypotheses.
The obtained results of variable CRISIS show that the financial crisis provides the probability that the company will disclose goodwill impairment losses. These results are consistent with Sutthaichai and Cooke (2009), Bloom (2009), as well as Camodeca and Almici (2012). The results obtained allow show that the last hypothesis stating that the financial crisis companies are more likely to disclose goodwill impairment losses will be accepted.
The results of all control variables show that these variables of the companies that disclosed goodwill impairment losses, except the relationship between the market and balance value (MVR), are lower than of the companies that did not disclose goodwill impairment losses.
Thus, based on the initial results obtained, that worsening performance results of companies increase probability of disclosure of goodwill impairment.
Since the study covers the period from 2006 to 2013, it is relevant to analyze the results obtained from different years in order to be able to compare the influence of all variables on the decision of the company to disclose goodwill impairment losses each year. The analysis showed that the amount of goodwill in the balance sheet at the beginning of each year is distributed differently and has a tendency to increase. The highest average amount of goodwill is equal to 7 percent of total assets during the last 2011–2013 years. Companies recognized most goodwill impairment losses during the financial crisis in 2008 and 2009 with 35 and 42 percent, respectively. The average disclosed goodwill impairment amount is also higher at the time of economic crises that formed 0,30 percent and 0,90 percent of total assets of the last year.
Thus, the financial crisis allows confirming the initial conclusions that the economic downturn has impact to the goodwill impairment disclosure decision and disclosed amount of goodwill impairment.
Table 2 States Comparative Analysis
STATE DATA / VARIABLES
LITHUANIA LATVIA ESTONIA
n - 78 n - 53 n - 76
Mean Median Std. Dev. Mean Median Std. Dev. Mean Median Std. Dev.
GWIMP 0.24 0.00 0.43 0.06 0.00 0.23 0.25 0.00 0.44
GWAMOUNT 0.003 0.00 0.01 0.0005 0.00 0.002 0.003 0.00 0.01
MNGCH 0.17 0.00 0.38 0.28 0.00 0.45 0.29 0.00 0.46
EARN 0.22 0.00 0.42 0.17 0.00 0.38 0.24 0.00 0.43
DEBT 2.06 1.47 2.39 0.59 0.46 0.41 1.33 1.24 1.07
SIZE 11.19 11.21 0.87 11.24 11.37 1.72 11.81 11.60 1.1
CRISIS 0.26 0.00 0.44 0.25 0.00 0.43 0.25 0.00 0.44
SALES 0.11 0.03 0.43 0.08 0.04 0.17 0.18 0.08 0.71
OCF 0.007 0.004 0.25 0.01 0.003 0.08 0.002 0.007 0.12
ROA -0.003 0.0004 0.11 -0.002 0.0007 0.05 -0002 -0.01 0.18
MVR 1.62 1.38 1.34 0.76 0.53 0.58 1.54 1.13 1.24
GDP 2.40 3.30 7.12 1.74 4.1 8.31 1.82 2.6 7.63
VALUE 0.04 0.005 0.06 0.01 0.00 0.05 0.10 0.03 0.14
As the study involves a similar number of companies from Lithuania, Latvia and Estonia, it gives the opportunity to compare countries with each other for goodwill impairment disclosure. Data given in table 2 shows that during the study period, 24 percent of Lithuanian companies recognized goodwill impairment, 6 percent of Latvian companies and 25 percent of Estonian companies. Average results of amount of goodwill impairment (GWAMOUNT) show that the amount of goodwill impairment disclosed by the companies of different countries represents a very small percentage. In summary, Lithuanian and Estonian companies are more likely to disclose goodwill impairment. Comparing goodwill (VALUE), the disclosed goodwill impairment (GWAMOUNT) and change of managers (MNGCH) can predict that the Estonian companies execute more business mergers and acquisitions.
Multicollinearity and Correlation
Table 3, among dependent variables goodwill impairment (GWIMP) and goodwill impairment amount
variable, but based on the correlation results, the correlation obtained between these variables is positive and strong. This means that the higher debt to capital ratio affects goodwill impairment. Also positive but very weak significance was found between dependent variable and variables the company size (SIZE) and the value of goodwill (VALUE), while the probability p shows that there is no correlation between these variables. These results lead to the preliminary findings that are contrary to the predicted ones, the company‘s size and the amount of goodwill in the balance sheet does not affect the goodwill impairment disclosure. The analysis of variables reflecting performance of a company shows that SALES and ROA, as it was
predicted negatively correlates with this dependent variable. Because of the deterioration of these operating results, companies are more likely to disclose goodwill impairment losses. The analysis of other variables that reflect the performance of companies show that the change in operational cash flow (OCF) also negatively correlates with the dependent, but probability p shows that there is no correlation between these variables. Also, the correlation between MVR and the dependent variable has not been determined. It is also a negative correlation between a dependent variable and GDP, and the probability p shows strong correlation between this variable and goodwill impairment.
Table 3 The Results of Correlation Analysis
VARIABLES CORRELATION COEFFICIENT / PROBABILITY (p) GWI M P GWAM OU NT M NGCH E AR N DE B T S IZ E CR IS IS S AL E
OCF ROA MRV GDP VALUE
GWIMP 1
-
GWAMOUNT 0.99
0.00
1 -
MNGCH 0.34 0.00 0.22 0.001 1 -
EARN 0.25
0.0004 0.26 0.0001 0.15 0.033 1 -
DEBT 0.26
0.0001 0.02 0.72 0.01 0.85 0.01 0.84 1 -
SIZE 0.05
0.488 -0.007 0.93 0.006 0.94 -0.11 0.12 -0.20 0.003 1 -
CRISIS 0.27
0.0001 0.24 0.0004 0.19 0.005 0.22 0.002 -0.03 0.64 0.03 0.69 1 -
SALES -0.14
0.04 -0.21 0.002 -0.15 0.034 -0.22 0.001 -0.05 0.46 -0.04 0.54 -0.21 0.001 1 -
OCF -0.023
0.75 -0.006 0.93 -0.01 0.85 -0.10 0.14 -0.04 0.55 0.004 0.95 -0.01 0.89 -0.19 0.007 1 -
ROA -0.19
0.006 -0.24 0.0005 -0.02 0.72 -0.55 0.000 0.24 0.000 4 -0.05 0.51 -0.28 0.00 0.12 0.09 -0.08 0.25 1 -
MVR 0.02
0.13 -0.03 0.71 -0.006 0.94 -0.04 0.53 0.30 0.00 -0.13 0.07 -0.23 0.0006 0.29 0.00 -0.07 0.31 0.07 0.31 1 -
GDP -0.22
0.001 -0.26 0.0001 -0.16 0.024 -0.14 0.04 -0.09 0.17 -0.002 0.98 -0.7 0.00 0.33 0.00 -0.06 0.36 0.11 0.12 0.26 0.000 2 1 -
VALUE 0.13
0.053 0.26 0.0002 0.1 0.16 -0.02 0.83 0.05 0.46 -0.11 0.11 -0.02 0.82 -0.002 0.97 0.03 0.68 0.03 0.68 -0.005 0.93 -0.04 0.4 1
The analysis of connection of the dependent variable goodwill impairment amount (GWAMOUNT) with variables shows positive and similar correlation of the VALUE, EARN, CRISIS and MNGCH. The results presented in table 4 show that the obtained values of the probability p, the correlation between these variables and goodwill impairment amount is very strong. These results lead to the preliminary findings that higher amount of goodwill in the balance sheet, negative operating result of a company, financial crisis and management change increases the probability of disclosure of higher amount of the goodwill impairment. Also, a positive correlation was found between this dependent variable and variable DEBT. In this case, as with the dependent variable the GWIMP, the results are different than predicted, i.e. the higher debt to capital ratio should lead to a greater amount of goodwill impairment. However, the correlation coefficient show that the significance of the variable is very weak, and the probability p shows that there is no correlation between these variables. Thus, the correlation results obtained and the
The Analysis of Binary Logistic Regression Model
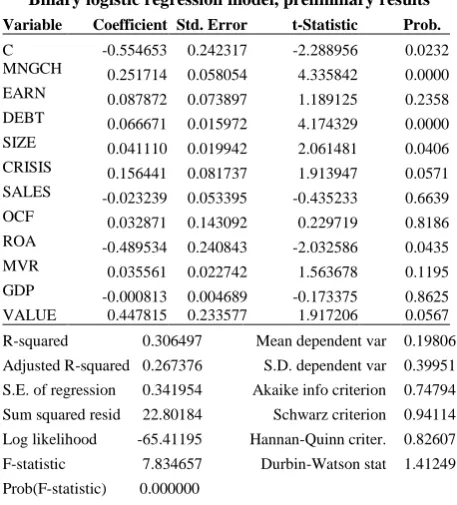
The binary logistic regression model is formed to verify the raised hypotheses H1A, H2A, H3A, H4A, H5A aimed to identify the influence of factors on goodwill impairment disclosure decision (Table 4). The data presented in table 4 shows that the regression is significant, i.e. the model is appropriate. Therefore, the assessment of the first binary regression model results show that the model has a lot of irrelevant variables (EARN, CRISIS, VALUE, SALES, OCF, MRV and GDP) that may distort the results of the model. Therefore, in order to identify only the most significant variables affecting the goodwill impairment decision, the irrelevant variables should be eliminated from the regression model. Irrelevant variables are eliminated from the model starting from the variable having the highest probability p value. The regression equation then would be resolved. After eliminating all irrelevant variables, only four significant variables of eleven tested ones were determined that affect the goodwill impairment disclosure.
The most significant variables are the MNGCH, the DEBT, the ROA and the CRISIS (table 5). Thus, the final binary logistic regression model equation is as follows:
GWIMP=0.274 MNGCH+0.070 DEBT+0.142 CRISIS – 0.663 ROA (3)
The model is appropriate, as Fisher criterion (Prob(F-statistic)) value p is equal to 0,000000 and is < 0,05, and the coefficient of determination (R-square) value is 0,270449, i.e. greater than 0,20.
Table 4 Binary logistic regression model, preliminary results
Thus, the results obtained indicate the following: The hypothesis H1A, which was aimed to determine the impact a manager change had on goodwill impairment disclosure is ACCEPTED, as the correlation of variable MNGCH is positive and statistically significant. This means that the company‘s management change increases the probability of goodwill impairment disclosure. This finding coincides with studies by Beatty and Weber (2006), Masters-Stout et al. (2008), Lapointe-Antubes et al. (2008),
Lemans (2010), Abughazalech et al. (2011), Ramana and Watts (2011), Saastamoinen and Pajunen (2012) and Hamberg et al. (2011).
Table 5
Binary Logistic Regression Model with Significant Variables
Variable Coefficient Std. Error t-Statistic Prob.
MNGCH 0.274622 0.054368 5.051162 0.0000
DEBT 0.070628 0.012023 5.874155 0.0000
CRISIS 0.142352 0.055679 2.556649 0.0113
ROA -0.663803 0.199064 -3.334614 0.0010
R-squared 0.270449 Mean dependent var 0.198068
Adjusted R-squared 0.259668 S.D. dependent var 0.399510
S.E. of regression 0.343748 Akaike info criterion 0.721320
Sum squared resid 23.98706 Schwarz criterion 0.785720
Log likelihood -70.65663 Hannan-Quinn criter. 0.747363
F-statistic Prob(F-statistic)
8.657962 0.000000
Durbin-Watson stat 1.412091
The hypothesis H2A which was aimed to determine if the loss-making companies are more likely to disclose goodwill impairment losses is REJECTED, as the variable EARN is statistically insignificant. Hence, the negative result of the activity of the company has no impact on the goodwill impairment prompting suggestions that the companies do not use goodwill impairment for earnings management. This finding coincides with the studies by the scientists Guler (2007) and Jahmani (2010) which also did not find that the loss-making companies are more likely to disclose the goodwill impairment losses.
The hypothesis H3A that was aimed to determine if the indebted companies do not tend to disclose goodwill impairment losses is REJECTED as the obtained results were in contrast to the predicted ones. As the coefficient of the variable DEBT is positive (predicted negative) and the variable is statistically significant, the more indebted companies are likely to disclose the goodwill impairment losses. This finding is in contrary to the results of the studies carried out by Zang (2008), AbuGhazalech et al. (2011), as well as Ramanna and Watts (2012).
The hypothesis H4A which was aimed to determine if the larger companies are more likely to disclose the goodwill impairment is REJECTED, as the variable SIZE is statistically insignificant, and this means that the company size does not affect the goodwill impairment disclosure. This finding coincides with the studies by Vichtsarawong (2007) as well as Peterson and Plenborg, (2010), which also did not find the significant correlation between the size of a company and the goodwill impairment disclosure.
The hypothesis H5A was aimed to determine the influence of the financial crisis on the goodwill impairment disclosure is ACCEPTED, as the variable CRISIS is statistically significant. Thus, the results show that the economic crisis increases the possibility of disclosure of the goodwill impairment. This finding coincides with studies performed by Sutthachai and Cooke (2009), Bepari et al.
(2011) and Camodeca and Almici (2012).
Summarizing the results obtained from other variables shows that the control variables (SALES, OCF, MVR and GDP) do not affect the goodwill impairment disclosure. The results coincide with previously discussed evidences, i.e. these factors influence the goodwill impairment disclosure,
Variable Coefficient Std. Error t-Statistic Prob.
C -0.554653 0.242317 -2.288956 0.0232
MNGCH 0.251714 0.058054 4.335842 0.0000
EARN 0.087872 0.073897 1.189125 0.2358
DEBT 0.066671 0.015972 4.174329 0.0000
SIZE 0.041110 0.019942 2.061481 0.0406
CRISIS 0.156441 0.081737 1.913947 0.0571
SALES -0.023239 0.053395 -0.435233 0.6639
OCF 0.032871 0.143092 0.229719 0.8186
ROA -0.489534 0.240843 -2.032586 0.0435
MVR 0.035561 0.022742 1.563678 0.1195
GDP -0.000813 0.004689 -0.173375 0.8625
VALUE 0.447815 0.233577 1.917206 0.0567
R-squared 0.306497 Mean dependent var 0.19806
Adjusted R-squared 0.267376 S.D. dependent var 0.39951
S.E. of regression 0.341954 Akaike info criterion 0.74794
Sum squared resid 22.80184 Schwarz criterion 0.94114
Log likelihood -65.41195 Hannan-Quinn criter. 0.82607
F-statistic 7.834657 Durbin-Watson stat 1.41249
but most studies do not indicate the significance of these variables. The variable VALUE is also insignificant and this coincides with studies performed by Omar Mohd-Salem (2011) and AbuGhazalech et al. (2011). The only variable reflecting operating results, return on assets change (ROA), can predict the goodwill impairment disclosure, as there is a very significant correlation between this variable and the goodwill impairment disclosure.
The Analysis of Linear Regression Results
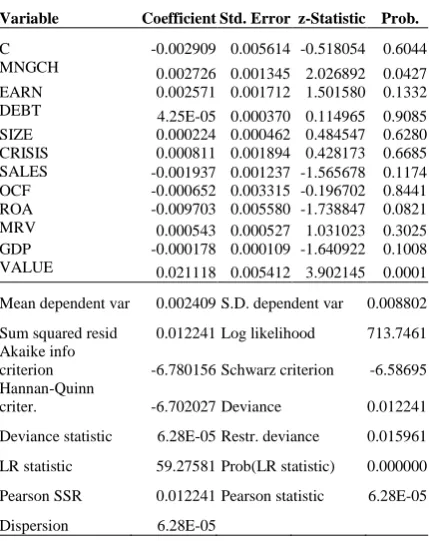
The linear regression model is formed to verify the hypotheses H1B, H2B, H3B, H4B, H5B aimed to determine the influence of factors on the amount of goodwill impairment being disclosed (table 6).
Table 7 shows that the regression is significant; thus, we can further access model variables.
The analysis of the results presented in the Prob. column of table 6 that reflects the significance of variables shows that only two variables affect the amount of goodwill impairment disclosure. The strongest influence has the variable VALUE. This shows that the companies with a higher amount of goodwill in the balance statement are more likely to disclose a higher amount of goodwill impairment. Another significant variable is the MNGCH. Based on these results, the hypothesis H1B which is aimed to determine the influence of management change on the amount of goodwill impairment will be accepted. The analysis of the remaining variables related to the hypotheses H2B, H3B, H4B and H5B shows that the coefficient of the variable DEBT, which investigates hypothesis H3B, is positive and insignificant. This shows that the more indebted companies are tend to hold in confidence the less goodwill impairment amount.
Table 6
The Initial Results, of the Linear Regression Model
Variable Coefficient Std. Error z-Statistic Prob.
C -0.002909 0.005614 -0.518054 0.6044
MNGCH 0.002726 0.001345 2.026892 0.0427
EARN 0.002571 0.001712 1.501580 0.1332
DEBT 4.25E-05 0.000370 0.114965 0.9085
SIZE 0.000224 0.000462 0.484547 0.6280
CRISIS 0.000811 0.001894 0.428173 0.6685
SALES -0.001937 0.001237 -1.565678 0.1174
OCF -0.000652 0.003315 -0.196702 0.8441
ROA -0.009703 0.005580 -1.738847 0.0821
MRV 0.000543 0.000527 1.031023 0.3025
GDP -0.000178 0.000109 -1.640922 0.1008
VALUE 0.021118 0.005412 3.902145 0.0001
Mean dependent var 0.002409 S.D. dependent var 0.008802
Sum squared resid 0.012241 Log likelihood 713.7461
Akaike info
criterion -6.780156 Schwarz criterion -6.58695
Hannan-Quinn
criter. -6.702027 Deviance 0.012241
Deviance statistic 6.28E-05 Restr. deviance 0.015961
LR statistic 59.27581 Prob(LR statistic) 0.000000
Pearson SSR 0.012241 Pearson statistic 6.28E-05
Dispersion 6.28E-05
The initial results allow predicting that the hypothesis H2B should be rejected. The probability p values of the variables SIZE and CRISIS shows the insignificant influence of these variables on the amount of goodwill impairment being disclosed and allows stating that the hypotheses H4B and H5B will not be confirmed. The variable EARN has the nearest materiality threshold (p is equal to 0,1332). However, this result shows that the negative result of a company has no influence on recognition of the greatest amount of the goodwill impairment and allows predicting that the hypothesis H2B will be rejected. When assessing of the control variables, the probability p values of all variables are higher than 0,05, and this shows that these variables are insignificant. Only the probability p value of the ROA is close to the materiality threshold (0,0821) and may change during modification of the regression model. The coefficient of the last variable GDP is negative and insignificant (p is equal to 0,1008). Thus, the economic recession in the country should not have any influence on the disclosure of a greater amount of goodwill impairment; however, the value of this variable is also close to the materiality threshold and may change during modification of the model.
The initial linear regression model results shows that the model has many insignificant variables the model must be improved. As insignificant variables may distort the results, they must be eliminated from the model. The insignificant variables are eliminated one by one starting from the variable with the highest probability p value.
Having eliminated all insignificant variables, we obtain the final regression model with significant variables. The results obtained in table 7 show that the amount of goodwill impairment being disclosed is determined by the amount of goodwill (VALUE), the management change (MNGCH), a negative operating result of the company (EARN) and return on assets change (ROA).
Thus, the final linear regression model equation is as follows:
GWIMP=0.002 MNGCH+0.004 EARN–0,0002 ROA
+0.020 VALUE (4)
Thus, the obtained linear regression model results are summarized as follows:
The hypothesis H1B which was aimed to determine the impact of management change on the amount of goodwill impairment being disclosed is ACCEPTED. Thus, the management change affects not only the goodwill impairment disclosure decision, but also the amount of the goodwill impairment being disclosed.
Table 7
The Linear Regression Model with Significant Variables
Variable Coefficient Std. Error z-Statistic Prob.
MNGCH 0.002933 0.001230 2.383819 0.0071
EARN 0.004763 0.001276 3.732621 0.0002
ROA -0.000230 7.04E-05 -3.267921 0.0011
VALUE 0.020567 0.005002 4.111952 0.0000
Sum squared resid 0.012699 Log likelihood 710.1053
Akaike info criterion -6.822273 Schwarz criterion -6.75787
Hannan-Quinn criter. -6.796230 Deviance 0.012699
Deviance statistic 6.26E-05 Pearson SSR 0.012699
The hypothesis H2B which was aimed to determine that negatively operating companies are more likely to disclose greater goodwill impairment losses is ACCEPTED. Thus, although it was determined that the negative company‘s result does not affect the goodwill impairment disclosure decision (hypothesis H2A is not confirmed), it does determine the amount of goodwill impairment being disclosed. Lemans (2010) said that large amounts in write-off accounting is an example of earnings management in order to reduce the company‘s earnings. Thus, the loss-making companies disclose the greater amount of goodwill impairment expecting the future losses will be lower or will be avoided and thus seek to increase or at least improve earnings in the forthcoming year. Such decision may be related to the management bonuses that are associated with the operating results. Due to the lack of data, a management bonus plan of a company have not been analysed separately; however, based on scientific studies, it can be predicted that this may have an influence on disclosure of greater goodwill impairment losses in order to increase the chances to achieve bonuses in upcoming years.
The hypothesis H3B which was aimed to determine the company‘s debt influence on the amount of goodwill impairment disclosure is REJECTED. The results show that the more indebted companies are not likely to disclose less goodwill impairment amount. The findings coincide with studies carried out by Guler (2007) and Jahmani (2010).
The hypothesis H4B which was aimed to determine the impact of company size on goodwill impairment amount being disclosed is REJECTED and larger companies tend to hold in confidence greater goodwill impairment losses. The results again coincide with conclusions made by Vichtsarawong (2007), Peterson and Plenborg (2010).
The hypothesis H5B which was aimed to determine the impact of economic crisis on the amount of goodwill being disclosed is REJECTED. The economic crisis in the country affects goodwill impairment disclosure (H5A hypothesis is accepted), however, it does not affect the amount of goodwill impairment being disclosed.
Thus, summarizing all control variables involved in the model shows that the amount of goodwill (VALUE) has the greatest and most significant influence on the amount of goodwill impairment disclosure. Thus, the companies disclose greater goodwill impairment losses when goodwill balance value is higher, and thus reflects the real influence of goodwill amount in the balance statement on the operating results of a company. The results obtained coincide with the conclusions made by Zang (2008), Van de Poel et al. (2009), and Bepari et al. (2012). The significance of the variable GDP has changed throughout the entire study; however, the results showed that the economic situation in the country does not affect the amount of goodwill impairment. The study also shows that the reduction of ROA has an influence on the companies to disclose the higher amount of the goodwill impairment.
Conclusions
Scientific research shows that there is a limited possibility for predicting goodwill impairment based on the information submitted in financial statements. Accounting standards provide the list of factors that can influence
probable goodwill impairment; however, the performed analysis of literature sources demonstrates that there is a range of other factors and causes affecting goodwill impairment in practice. The empirical analysis of studies also reveals that a major part of decisions to disclose goodwill impairment is conditioned by the pursuit of self-interest and the manipulation of accounting information manipulations from the manager’s side.
Having conducted research on goodwill impairment occurring within a number of companies listed by NASDAQ OMX Baltic, the evaluation of study hypotheses is performed. H1A and H1B hypotheses were accepted on the basis of the results of the binary logistic regression model. Findings show that companies, which witnessed the replacement of managers, are more inclined to disclose the losses of goodwill impairment. In addition, the replacement of managers has an effect on disclosing a larger amount of goodwill impairment. The present research has established that the negative result of company performance does not influence a decision to disclose the losses of goodwill impairment (the H2A hypothesis has not been proven); however, it conditions a decision to write off a larger amount of goodwill impairment because the H2B hypothesis has been accepted. Thus, it may be maintained that companies are inclined to delay goodwill write-offs and to recognize goodwill impairment losses under the most favorable circumstances. Hypotheses related to company indebtedness levels have not been proven; however, obtained results demonstrate that indebted companies are more inclined to disclose goodwill impairment. The impact of the size of companies on goodwill impairment and its amounts has not been determined, since H4A and H4B hypotheses have not been proven. Furthermore, the present research has established that an economic crisis experienced by a country affects the disclosure of goodwill impairment (the H5A hypothesis has been accepted); however, it does not have effect on the written-off quantity of goodwill amounts (the H5B hypothesis has not been proven). Out of all the indicators explored in the study, a change in return on assets is the only indicator that influences companies to disclose the losses of goodwill impairment and to execute the write-offs of larger amounts of goodwill.
As the present study encompasses a relatively short period (2005-2013) of the application of the new method for goodwill accounting, it becomes necessary to perform research that would cover a longer period of time in order to be able to determine a long-term impact of International Financial Reporting Standards regulating goodwill accounting on decisions reached with regard to goodwill write-offs. Moreover, it would be useful to assess whether an industrial branch makes a difference when selecting whether or not to disclose goodwill impairment. Since the present study excludes companies in the banking sector (due to different applicable legal instruments and provisions regulating company activities), it would be helpful to conduct research on goodwill impairment within a number of companies belonging to this sector. It would also be beneficial to explore the effect of the role of the family, the form of ownership and the choice of auditors on decisions made in relation to goodwill impairment.
therefore, it is recommended to reduce this subjectivity by, for example, providing the senior management with instructions on how to perform goodwill impairment testing. A large amount of research on this subject is required in order to be able to include potential instructions into
standards or to provide standards with more detailed descriptions on how to review goodwill impairment. This would essentially facilitate the selection of goodwill impairment testing for auditors and would decrease related subjectivity.
References
AbuGhazaleh, N. M., Al-Hares, O. M., & Roberts, C. (2011). Accounting Discretion in Goodwill Impairments: UK Evidence. Journal of International Financial Management & Accounting, 22, 165–204. http://dx.doi.org/10.1111/ j.1467-646X.2011.01049.x
Aquino, C., Rensel, A., Rensel, C., & Lee, T. (2011). The Impact of Goodwill on Stock Volatility. Journal of International Finance and Economics, 11, 31–37.
Andre, P., Filip, A., & Paugman, L. (2015). Effect of Mandatory IFRS Adoption on Conditional Conservatism in Europe.
Journal of Business Finance & Accounting, 42(3/4), 482–514. http://dx.doi.org/10.1111/jbfa.12105
Beatty, A., & Weber, J. (2006). Accounting Discretion in Fair Value Estimates: an Examination of SFAS 142 Goodwill Impairments. Journal of Accounting Research, 44, 257–288. http://dx.doi.org/10.1111/j.1475-679X.2006.00200.x Bepari, M. K., Rahman, S. F., & Mollik, A. T. (2011). Firm's Compliance with the Disclosure Requirements of IFRS for
Goodwill Impairment Testing: Effect of the Global Financial Crisis and Other Firm Characteristics. Journal of Accounting & Organizational Change, 10, 116–149. http://dx.doi.org/10.1108/JAOC-02-2011-0008
Bloom, M. (2009). Accounting for Goodwill. Abacus, 45, 379–89. http://dx.doi.org/10.1111/j.1467-6281.2009.00295.x Camodeca, R., & Almici, A. (2012). The Information Content of Goodwill Impairment before and after Financial Crisis:
Evidence from European Listed Banks. 7th Annual Business Research Conference, London. Available from internet: www.wbiconpro.com.
Chambers, D., & Finger, C. (2011). Goodwill Non-Impairments. The CPA journal, 81, 38–41.
Comiskey, E. E., & Mulford, C. W. (2010). Goodwill, Triggering Events, and Impairment Accounting. College of Management, Georgia Institute of Technology. Managerial Finance, 36, 746–767. http://dx.doi.org/10.1108/ 03074351011064636
Darrough, M. L., Guler, L., & Wang, P. (2014). Goodwill Impairment Losses and CEO Compensation. Journal of Accounting, Auditing & Finance, 29(4), 435–463. http://dx.doi.org/10.1177/0148558X14537824
Escaffre, L., & Sefsaf, R. (2010). French market reaction to the announcement of goodwill impairment. Working paper. University of Angers.
Fillip, A., Jeanjean, T., & Paugam, L. (2015). Using Real Activities to Avoid Goodwill Impairment Lossess: Evidence and Effect on Future Performance. Journal of Business Finance and Accounting, 42(3/4), 515–554. http://dx.doi.org/10.1111/jbfa.12107
Giner, B., & Pardo, F. (2014). How Ethical are Managers' Goodwill Impairment Decisions in Spanish-Listed Firms?
Journal of Business Ethics, 132(1), 21–40. http://dx.doi.org/10.1007/s10551-014-2303-8
Guler, L. (2007). Goodwill Impairment charges under SFAS 142: Role of executives' incentives and corporate governance. Unpublished dissertation in partial fulfillment of the requirements for the degree of Doctor of Philosophy. Texas A & M University, U.S.A. http://dx.doi.org/10.2139/ssrn.930718
Hamberg, M., Paananen, M., & Novak, J. (2011). The Adoption of IFRS 3: the Effects of Managerial Discretion and Stock Market Reactions. European Accounting Review, 20, 263–88. http://dx.doi.org/10.1080/09638181003687877
Huikku, J., Mouritsen, J., & Silvola, H. (2016). Relative Reliability and the Recognisable Firm: Calculating Goodwill Impairment Value. Accounting, Organizations and Society, 1–16. Available from internet: http://www.sciencedirect.com/science/article/pii/S0361368216300344 http://dx.doi.org/10.1016/j.aos.2016.03.005 Iatridis, G. E., & Senftlechner, D. (2014). An Empirical Investigation of Goodwill in Austria: Evidence on Management
Change and Cost of Capital. Australian Accounting Review, 24, 171–181. http://dx.doi.org/10.1111/auar.12014 Jahmani, Y., Dowling, W. A., & Torres, P. D. (2010). Goodwill Impairment: A New Window for Earnings Management.
Journal of Business & Economics Research, 8, 9–24. http://dx.doi.org/10.19030/jber.v8i2.669
dissertation: University of Glasgow.
Jordan, Ch. E, & Clark, S. J. (2015). Do Canadian Companies Employ Big Bath Accounting When Recording Goodwill Impairment? International Journal of Economics and Finance, (Sep), 159–168.
Lapointe-Antunes, P., Cormier, D., & Magnan, M. (2008). Equity Recognition of Mandatory Accounting Changes: The Case of Transitional Goodwill Impairment Losses. Canadian Journal of Administrative Sciences, 25, 37–54. http://dx.doi.org/10.1002/cjas.41
Lemans, J. (2010). Goodwill Impairment as a Tool for Earnings Management. Master's thesis: Accounting, Auditing and Control, Erasmus University Rotterdam.
Masters – Stout, B., Costigan, M. L., & Lovata, L. M. (2008). Goodwill Impairments and Chief Executive a Officer Tenure.
Critical Persperctives on Acounting, 19, 1370–1383. http://dx.doi.org/10.1016/j.cpa.2007.04.002
Massoud, M.F., & Raiborn, C. A (2003). Accounting for Goodwill: Are We Better Off? Review of Business, 24, 26–32. Omar, N., & Mohd-Saleh, N. (2011). Family and Government Influence on Goodwill Impairment: Evidence from
Malaysia. International Conference on Financial Management and Economics, 11.
Onesti, T., & Romano, M. (2012). Earnings Management and Goodwill Accounting: Implications on Dividend Policy in Italian Listed Companies. Review of Accounting and Finance, 4, 55–74. http://dx.doi.org/10.2139/ssrn.2179159 Paugman, L., & Ramond, O. (2015). Effect of Impairment-testing Disclosure on Cost of Equity Capital. Journal of
Business Finance & Accounting, 42(5/6), 515–554.
Petersen, C., & Plenborg, T. (2010). How do firms Implement Impairment Tests of Goodwill? Abacus, 46, 419–445. http://dx.doi.org/10.1111/j.1467-6281.2010.00326.x
Ramanna, K., & Watts, R. L. (2008). Evidence from Goodwill Non – Impairments on the Effects of Unverifiable Fair Value Accounting. Harvard Business School Accounting and Management Unit. Working paper.
Ramanna, K., & Watts, R. L. (2012). Evidence on the Use of Unverifiable Estimates in Required Goodwill Impairment.
Review of Accounting Studies, 17, 749–780. http://dx.doi.org/10.1007/s11142-012-9188-5
Rehman I. R., & Shahzad F. (2014). The Economic Consequences of Mandatory IFRS Reporting: Emerging Market Perspective. Inzinerine Ekonomika-Engineering Economics, 25(4), 401–409. http://dx.doi.org/10.5755/ j01.ee.25.4.2775
Riedl, E.J. (2004). An Examination of Long-lived Asset Impairments. The Accounting Review, 79, 823–852. http://dx.doi.org/10.2308/accr.2004.79.3.823
Saastamoinen, J., & Pajunen, K. (2012). Goodwill Impairment Losses as Managerial Choices. Available from internet: http://ssrn.com/abstract=2000690.
Sutthachai, S., & Cooke, T. (2009). An Analysis of Thai Financial Reporting Practices and the Impact of the 1997 Economic Crisis. Abacus, 45, 493–517. http://dx.doi.org/10.1111/j.1467-6281.2009.00285.x
Sapkauskiene, A., & Leitoniene, S. (2014). The Analysis of Factors Influencing the Write-off of Goodwill. Journal of Procedia – Social and behavioral sciences, 156, 643–647. http://dx.doi.org/10.1016/j.sbspro.2014.11.256
Van de Poel, K., Maijorr, S., & Vanstraelen, A. (2009). IFRS Goodwill Impairment Test and Earnings Management: the Influence of Audit Quality and the Institutional Environment. Available from internet: http://www.researchgate.net. Verriest, A., & Gaeremynck, A. (2009). What Determines Goodwill Impairment. Review of Business andEconomics, 106–
128.
Vichitsarawong, T. (2007). The Usefulness of Goodwill Impairment under SFAS No. 142 in Reflecting the Relative Efficienty of Firms. Doctoral disertation: accounting. Oklahoma State University.
Zang, Y. (2008). Discretionary Behavior with Respect to the Adoption of SFAS no. 142 and the Behavior of Security Prices. Review of Accounting and Finance, 7, 38–68. http://dx.doi.org/10.1108/14757700810853842