Interactive visual exploration and analysis of
origin-destination data
Linfang Ding,
a,bLiqiu Meng,
bJian Yang,
cand Jukka M. Krisp
aa University of Augsburg, Augsburg, Germany; [email protected], [email protected] b Technical University of Munich, Munich, Germany; [email protected]
c Zhengzhou Institute of Surveying and Mapping, Zhengzhou, China; [email protected]
Abstract: In this paper, we propose a visual analytics approach for the exploration of spatiotemporal interaction patterns of massive origin-destination data. Firstly, we visually query the movement database for data at certain time windows. Secondly, we conduct interactive clustering to allow the users to select input variables/features (e.g., origins, destinations, distance, and duration) and to adjust clustering parameters (e.g. distance threshold). The agglomerative hierarchical clustering method is applied for the multivariate clustering of the origin-destination data. Thirdly, we design a parallel coordinates plot for visualizing the precomputed clusters and for further exploration of interesting clusters. Finally, we propose a gradient line rendering technique to show the spatial and directional distribution of origin-destination clusters on a map view. We implement the visual analytics approach in a web-based interactive environment and apply it to real-world floating car data from Shanghai. The experiment results show the origin/destination hotspots and their spatial interaction patterns. They also demonstrate the effectiveness of our proposed approach.
Keywords: Origin-destination, Interactive clustering, Parallel coordinates, Gradient line rendering
1.
Introduction
With the prevalence of location-aware devices, such as mobile phones, GPS devices in floating cars, analyzing and visualizing mobility data have become very important to understand the complex spatiotemporal interactions.
There have been many techniques developed to map massive connections between pairs of geographic locations. For instance, Tobler (1987) proposed direct mapping of migration data using geographic flow vectors. (Wood, Dykes, and Slingsby 2010) visually explore origins and destinations in geographic space by mapping origin-destination vectors as cells. They also preserved the spatial layout of all origin and destination locations by constructing a gridded two-level spatial treemap. Boyandin et al. (2011) presented a new interactive visualization approach named Flowstrates, in which the origins and the destinations of the flows are displayed in two separate maps, and the changes over time of the flow magnitudes are represented in a separate heatmap view in the middle. Guo and his colleagues (Guo and Zhu 2014, Guo et al. 2012) proposed a series of flow mapping techniques to investigate origin-destination flow data and study the spatiotemporal mobility patterns. Anwar, Nagel, and Ratti (2014) developed a visualization technique to support traffic incident analysis by using an expanding circle to highlight the traffic origins. Ding, Yang, and Meng (2015) focused on the visual analysis of traffic flow interactions related to transport hubs.
Besides mapping movements between geographic locations, there are also extensive work on visualizing
focus on the network visualization. For instance, edge bundling (Holten 2006) is a popular information visualization technique to reduce edge intersection and visual clutter. The usage of information visualization and geographic visualization into interactive environment are increasingly popular for analyzing movement data. For instance, (van den Elzen and van Wijk 2014) proposed a layered visual analytics approach to enables users to interactively inspect massive mobile phone data and gain insight at different levels of abstraction both in time and space.
In spite of the numerous works, it is still very challenging to visually explore the movement interactions in time and space due to the complex structures of the data and the constrained visualization space. For instance, when visualizing massive individual trajectories, line over plotting makes the users hardly discern any meaningful patterns. To deal with these issues, novel visual analytics approaches combining advanced computational and novel visual techniques are demanded.
In this paper, we propose a visual analytical approach for the exploration of massive individual origin-destination lines. This approach consists of visual querying of movement database, interactive clustering, parallel coordinates plots, and gradient line rendering techniques. We implement the proposed approach in a web-based interactive system and carry out experiments on a large amount of real-world floating car data from Shanghai.
2.
A visual analytical approach for
origin-destination data exploration
This approach consists of four components: visual querying of movement database, interactive clustering, parallel coordinates plots, and gradient line rendering of data on a map view. Firstly, we design a visual querying interface to allow an efficient retrieve and inspection of only relevant data partitions. Secondly, we conduct interactive clustering to achieve optimal clustering results by input features selection and clustering parameters adjustment. Thirdly, we carefully design a parallel coordinates plot for an intuitive perception of origin-destination clusters and allow for further analysis of interesting clusters. Finally, we propose a gradient line rendering technique and visualize the select individual origin-destination data on a map view.
2.1 Visual querying of movement database
This component allows visual query of the movement database for interesting trajectory subsets at a certain time slot. An overview + focus visualization technique is applied and implemented to allow users to perceive hourly variation of the total numbers of origin and destination points. In addition, users can interactive select data at certain time windows. Figure 1 shows the time line view.
Fig. 1. Visual query of the time line view
2.2 Interactive clustering
Clustering techniques are generic data mining approaches for exploring massive data. For multivariate data clustering, setting appropriate clustering features and optimal parameters plays an important role to generate meaningful clustering results. For instance, analysts might be interested in investigating origin-destination lines with comment origins or destinations.
We develop an interactive clustering interface to allow users to adjust the input features and parameters. Figure 2 shows the interface with a checklist of related features and a slider bar for adjusting the clustering distance.
Fig. 2. Interactive clustering interface for feature selection and distance setting.
The selected origin-destination data are then clustered by the agglomerative hierarchical clustering method (Kaufman and Rousseeuw 1990). The principle of hierarchical clustering is that for a given set of data objects it is hierarchically decomposed, forming a dendrogram - a tree that splits the database recursively into small subsets. The dendrogram can be formed either
‘bottom-up’ or ‘top-down’. The agglomerative approach adopts the ‘bottom-up’ way. It starts with each object forming a separate group and successively merges the objects or groups according to some measures like the distance between the two group centers, which is done until a termination condition holds.
2.3 Parallel coordinates
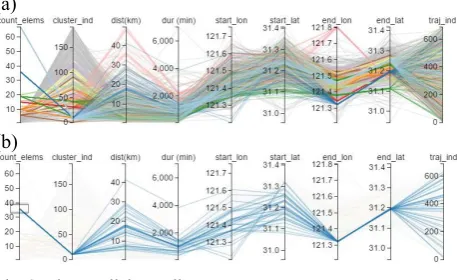
Parallel coordinates (Inselberg 1985) have been widely applied to reveal natural clusters of high-dimensional and multivariate data. A variety of toolkits are also developed to implement the technique. In our work, the parallel coordinate is designed to visualize the precomputed clusters and the multivariate relations. In addition, it allows users to interactively select potentially interesting clusters for future analysis. For immediate perception of individual clusters, we design the parallel coordinates as follows.
Firstly, besides the multiple attributes like in the clustering interface, we add to the parallel coordinates two more features, i.e. the individual cluster identifier and the number of the elements of each cluster. The aim is to explicitly show the cluster results as two axes and allow an easy inspection of individual clusters. Secondly, we assign proper z-index to the objects in order to display larger clusters on top of the small clusters. For larger clusters, we use the semi-transparency to reveal the hidden objects. Finally, we assign distinctive colors to clusters with larger number of elements, which are potential hotspots. A qualitative color scheme from colorbrewer is chosen. For the other smaller clusters, we use the same color, e.g. gray.
Figure 3(a) illustrates the interface of the parallel cooridnates plots and Figure 3(b) shows one selected cluster.
(a)
(b)
Fig. 3. The parallel coordinates.
2.4 Map view and the gradient line rendering
As the parallel coordinates shows the high-dimensional origin-destination lines in a transformed way, in this component we use a 2-D map to explicitly visualize them in the geographical space. The map view is linked to the parallel coordinates, and only the origin-destination lines of the selected clusters will be rendered on the map for further investigation.
technique. We firstly round the coordinate values at the origins/destinations to reduce the line intersections at their locations. Secondly, we order the origin-destination lines according to their length. Lines with long distances are pushed into the background (using a small z-index) so that short line would be visible. Finally, we segment the lines to line segments and assign the line segments from origin to destination with gradient colors from dark to light color values, which provides the user an intuitive feeling of line direction.
Figure 4 shows the origin-destination lines of the selected cluster in Figure 3(b). The interpretation of the visualization is that there are many taxis driving from different places (dark blue) to a common destination (light white).
Fig. 4. The origin-destination lines by gradient rendering.
3.
Experiments
The test FCD dataset is temporally ordered position records collected from about 2000 taxis from 10th May to 30th June 2016 in Shanghai with a temporal resolution of 10 seconds, resulting in more than half billion GPS entries. Each GPS entry, basically represented as p = (x, y, t), is associated with fields of date, time, car identifier, location, instantaneous velocity, and car status.
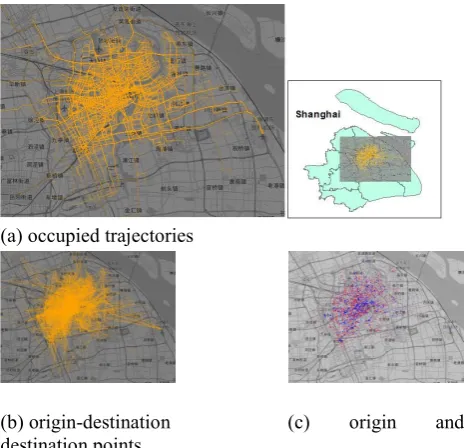
A trajectory can be reconstructed by connecting the consecutive GPS records with the representation as (p1, p2, … , pn). A variety types of trajectory can be derived based on their attributes. For instance, we can easily reconstruct occupancy trajectories or trips for which the “car status” values are 1. The fist points of the occupancy trajectories are origins, and the last points are destinations. By connecting the origin and destination points, we can derive their origin-destination lines. Figure 5 illustrates for all cars at 7:00-8:00 on 31 May, 2010, the reconstructed occupancy trajectories and their corresponding origin-destination lines, and the origin and destination points. There are 2504 origin-destination lines in this time slot. In Figure 5(b) it is hardly to perceive any interesting spatial interaction patterns from the highly clustered origin-destination lines.
(a) occupied trajectories
(b) origin-destination (c) origin and destination points
Fig. 5. The (a) trajectories, (b) origin-destination lines, and (c) the origin (red) and destination (blue) points at 7:00-8:00 on 31 May 2010.
We apply our proposed visual exploration approach to analyze the test data. We firstly query two subsets of origindestination lines at 5:00-6:00 and 7:00-8:00 through the time line in the visual interface. To have an overview of the spatiotemporal distribution of the origin and destination points, we visualize the total amounts of origin and destinations using heatmaps. Figure 6 shows the heatmap results. Obviously, there are more mobility activities at 7:00-8:00 than at 5:00-6:00. Moreover, some hotspots can be easily detected.
(a) origins at 5:00-6:00 (b) origins at 7:00-8:00
(c) destinations at 5:00-6:00 (d) destinations at 7:00-8:00
Fig. 6. The frequency distribution of origin and destinations.
clustering results are visualized in the parallel coordinates. Figure 7 illustrates the clustering results based on the “destinations”. Looking at the first axis, we can perceive many larger clusters (e.g. with more than 40 elements) at 7:00-8:00 and fewer at 5:00-6:00. Similarly, we can inspect the clustering results based on “origins”.
(a) 5:00-6:00 (b) 7:00-8:00
Fig. 7. The clustering results based on “destinations” shown in parallel coordinates.
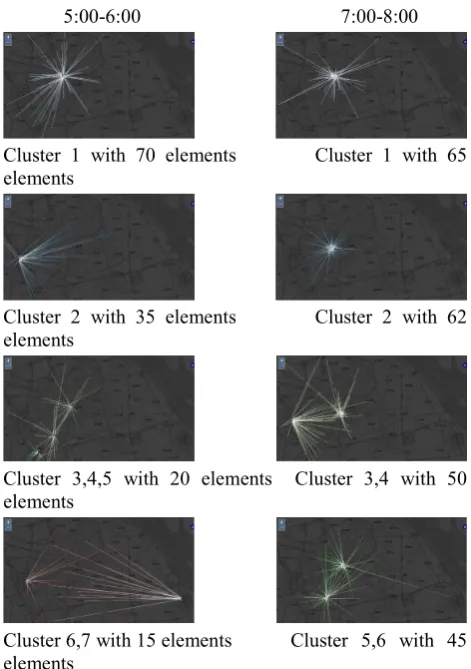
We can select interesting clusters from the parallel coordinates and inspect their spatial interactions on the linked map views. Figure 8 lists several maps view of the selected larger clusters in Figure 7.
5:00-6:00 7:00-8:00
Cluster 1 with 70 elements Cluster 1 with 65 elements
Cluster 2 with 35 elements Cluster 2 with 62 elements
Cluster 3,4,5 with 20 elements Cluster 3,4 with 50 elements
Cluster 6,7 with 15 elements Cluster 5,6 with 45 elements
Figure 8: Significant clusters based on “destination”.
In Figure 8, we can clearly perceive the spatial interactions of each clusters of origin-destination lines. After manually checking with a base map, we found that nearly all significant clusters at 5:00-6:00 are of destinations to transport hubs, like train stations and airports. While at 7:00-8:00, besides transport hubs, most of the others are destination of working places, e.g. industry or high tech zones.
Similarly, we can visualize the significant clusters based on “origin” at these two time slots. Figure 9 shows the origin-destination lines on map views.
5:00-6:00 7:00-8:00
Cluster 1,2 with 13-14 elements Cluster 1 with 45 elements
Cluster 3,4 with 10-12 elements Cluster 2,3 with 40 elements
Cluster 5,6 with 9 elements Cluster 4,5 with 35 elements
Cluster 7,8,9,10 with 8 elements Cluster 6 with 32 elements
Figure 9: Significant clusters based on “origin”.
In Figure 9, the spatial interactions of clusters of origin-destination lines can also be easily identified. Compared to the patterns with Figure 8, we can observe that 1) the sizes of clusters based on “origin” are normally smaller than based on “destination”; 2) the spatial patterns of clusters based on “origin” reveal more local interactions than based on “destination”; 3) there are asymmetric patterns of starting and ending behaviors/locations. A plausible explanation these patterns is that at 5:00 and 7:00 many destination hotspots might correspond to transport hubs and working places, which are very more compactly distributed, while most origin hotspots may at the residential areas which are more spread distributed. However, the radiation shapes of the origin-destination lines are different and difficult to foresee, which relies on the spatial location of the cluster.
4.
Conclusion
In this paper, we proposed a visual analytic approach for exploring origin-destination lines. The approach consists of the visual querying of movement database, the interactive clustering, parallel coordinates and a gradient rendering.
spatiotemporal interaction patterns of the origin-destination data.
It also demonstrates the feasibility and effectiveness of our proposed approach.
In the future, we will further improve and optimize the current interactive system. We are planning to analyze indepth the spatiotemporal interaction patterns of the origin-destination data of different temporal intervals and scales to reveal the patterns of movement in the daily life. For instance, it would be interesting to investigate the differences of spatial distributions of origin and destination points at the rush hours in the morning and evening, and differences of the movement interactions of week days and weekends.
5.
Acknowledgements
We are grateful to Prof. Chun Liu from Tongji University, Shanghai for sharing with us the floating car data.
6.
References
Anwar, Afian, Till Nagel, and Carlo Ratti. 2014. "Traffic Origins: A Simple Visualization Technique to Support Traffic Incident Analysis." Pacific Visualization Symposium (PacificVis), 2014 IEEE.
Boyandin, Ilya, Enrico Bertini, Peter Bak, and Denis Lalanne. 2011. "Flowstrates: an approach for visual exploration of temporal origin-destination
data." Proceedings of the 13th Eurographics / IEEE - VGTC conference on Visualization, Bergen, Norway. Ding, Linfang, Jian Yang, and Liqiu Meng. 2015. "Visual
Analytics for Understanding Traffic Flows of Transportation Hub from Movement Data." Proceedings of the 27th International Cartographic Conference (ICC), Rio de Janeiro, Brazil.
Guo, Diansheng, and Xi Zhu. 2014. "Origin-Destination Flow Data Smoothing and Mapping." IEEE Trans. Vis. Comput. Graph. 20 (12):20432052. doi: 10.1109/TVCG.2014.2346271.
Guo, Diansheng, Xi Zhu, Hai Jin, Peng Gao, and Clio Andris. 2012. "Discovering Spatial Patterns in Origin-Destination Mobility Data." T. GIS 16 (3):411-429. doi: 10.1111/j.1467-9671.2012.01344.x.
Holten, Danny. 2006. "Hierarchical edge bundles: Visualization of adjacency relations in hierarchical data." Visualization and Computer Graphics, IEEE Transactions on 12 (5):741-748.
Inselberg, Alfred. 1985. "The plane with parallel coordinates." The Visual Computer 1 (2):69-91. doi: 10.1007/bf01898350.
Kaufman, Leonard, and P Rousseeuw. 1990. Finding Groups in Data: Wiley & Sons, Inc., New York.
Tobler, Waldo R. 1987. "Experiments In Migration Mapping By Computer." The American Cartographer 14 (2):155-163. doi: 10.1559/152304087783875273. van den Elzen, Stef, and Jarke J van Wijk. 2014.
"Multivariate Network Exploration and Presentation:
From Detail to Overview via Selections and Aggregations."