Vol.5 (2015) No. 6
ISSN: 2088-5334
Studying of The Viability of Selected Probiotics in Soy Milk
to Develop A Functional Beverage Product
Dao Thi Anh Thu
#, Chau Ngoc Tuan
*, Nguyen Thi Xuan Van
##
Chemical Engineering Department, University of Science and Technology, The University of Danang, Danang City, Vietnam. E-mail: [email protected]
* Statistics-Informatics Department, University of Economics, The University of Danang, Danang city, Vietnam. E-mail: [email protected]
Abstract— In this research, Lactobacillus casei (L.casei) and Lactobacillus plantarum (L.plantarum) were added into two soymilk
products. The number of survival probiotics as well as the effects of probiotic strains, soymilk brands and additives to the quality of
final product were also studied. The initial number was added around 107 to 108(CFU/ml) into Fami and Vinasoy soy milk. The
number of survival probiotics was stable during the first four weeks with about 107 (CFU/ml) and then decreased to around 106 (CFU/ml) in the sixth week. In term of soymilk’s quality, the pH decreased dramatically while the Brix fell slowly after storing seven days in both soymilk products. The influence of food additive-fructose oligosaccharides adding to microencapsulate probiotics was also examined to increase storage time and final product quality.
Keywords— Lactobacillus casei; Lactobacillus plantarum; probiotics; soy milk; functional food.
I. INTRODUCTION
The traditional soy food products, for example soymilk, soy nuts and green soybeans, appear in nearly every aisle of the supermarket. The soybean is the cheap, cholesterol- and lactose-free and protein-rich source compared to other cereals. It also contains many vitamins and minerals. The soymilk has great economical potential in food industry because it contains low value of saturated fat, no cholesterol and high in manganese, magnesium and selenium [1].
The finding of probiotics has leaded to the many important applications towards the development of functional foods in the food industry. Probiotics have been associated with a range of health benefits and have been made available to the consumers via a range of dairy products. The term probiotic are defined as ‘live microorganisms which when administered in adequate amounts confer a health benefit on the host’ (WHO, 2002). The Lactobacillus and Bifidobacterium species are the most widely used probiotics among lactic acid bacteria [2]. The health benefits associated with probiotics include lowering intestinal pH, reducing the colonization of pathogenic bacteria, improving the host immune system, treatment some diarrhea types. More researches have suggested that the probiotic activities also positive influence the aiding the lactose intolerance systems, shortening of rotavirus diarrhea
[3]. The amount of probiotics must be larger than 107viable cells per gram or per milliliter of a product to confer benefits to the consumer [4]. Dairy products are often chosen as vehicles to carry probiotics to develop functional food products. However, the growing concerns about dairy products such as allergens, cholesterol effects, lactose intolerance as well as open market of probiotics to vegetarian leads to the demands for alternative vehicles. Microencapsulation has been demonstrated its functions to protect against the harsh environment like heating, acidity or rancidity until releasing the survival bacteria in the gastrointestinal tract. Lack of commercial acceptance of soymilk because of undesirable beany and lipoxygenase-catalyzed flavours still be increased. The stachyose and raffinose in soybean also make the stomach discomfort for consumers. Fructooligosaccharides FOS has 2-10 fructose units linked by glycosidic bonds have been reported as potential prebiotics [5].
In this project, the soymilk was chosen to be the vehicle for probiotics to widen the market of soymilk as well as probiotics as a functional beverage product. The aim of this project is to determine the viability of probiotics L. casei and
L. plantarum in two different soymilk products with and
were also studied to determine the effects of probiotics on soymilk.
II. MATERIALS AND METHOD
Fami soymilk is produced from 100% pure soy beans. Vinasoy soymilk is the products with optimal retention of isoflavones and natural proteins with the aids of a processing system. Both products are from Vietnam Soya Products Company. The nutritional ingredients of both soymilk brands are presented in table 1 and 2.
TABLEI
THE NUTRITIONAL INGREDIENTS OF FAMI SOYMILK PRODUCT
Nutritional ingredients / 100ml
Energy Protein Fat Carbohydrate Mineral Dietary Fiber Vitamin B1 Cholesterol
54.6 Kcal 1,9g 1.0g 9.5g 0.3g 290mg 60mcg 0.0g
TABLEII
THE NUTRITIONAL INGREDIENTS OF VINASOY SOYMILK PRODUCT
Nutritional ingredients / 100ml Energy
Carbohydrate Protein Fat Mineral Isoflavones Cholesterol
50.3 Kcal 6.0g 3.2g 1.5g 400mg 12mg 0.0mg
Freeze-dried probiotic culture of L. casei and L.
plantarum from Microbiology Laboratory, The University of
Science and Technology, The University of Danang. The soluble fiber Purpal F with the main ingredients is fructose oligosaccharide (FOS) from the Medical Biomaterial & Pharmaceutical Company Limited, Vietnam.
A. Bacterial suspension
Freeze-dried probiotic cells of L. casei and L. plantarum were hydrated and then incubated to achieve biomass as fresh culture after growing at 370C in 17h and 19h respectively. Then they were centrifuged at 6,000rpm to get the resulting pellet. The cell paste then was obtained after washing with saline. Then all the media were added into soymilk samples.
B. Microencapsulation Procedure (Experiments with additives)
The 2% w/w of commercial soluble fiber was added into distilled water and then adjusted to pH of around 6.0. The washed cell paste was added 2% w/w (to the soymilk) into the solution of soluble fiber to be encapsulated. Then the mixture of probiotics and fiber solution were mixed properly by magnetic agitation at constant speed. Then this mixture were incorporated with the soymilk. [7].
C. Enumeration to determine the survival of probiotics
Saline was used to dilute sample decimally and then were plated on MRS agar to be incubated at 37 0C under aerobic
condition in incubator. Plate count agar was incubated aerobically and anaerobically as parallel experiments to monitor cross contamination. The numbers of survival probiotics were recorded after seven-day storage.
D. Final product quality
The changes of products’ quality were determined by pH and Brix value after seven-day storage.
E. Statistical Analysis
All experiments were conducted and obtained results following the Factorial design created by Minitab software The Factorial design with Replications function was applied to find out the critical process variables that affect the optical output power. Three factors were varied including soymilk brands, species and additives (soluble fiber).
TABLEIII
ALL EXPERIMENTS ACCORDING TO THE FACTORIAL DESIGN AND THE
LEVEL OF EACH FACTOR
All measurements were done in triplicate and all results were average.
F. Storage
All the samples were stored at 40C to be evaluated the survival of probiotics and the soymilk’s quality.
III.RESULTS AND DISCUSSION
The results of all experiments arranged by Minitab software are shown in table 4.
TABLEIV
A. The grow curve of probiotic
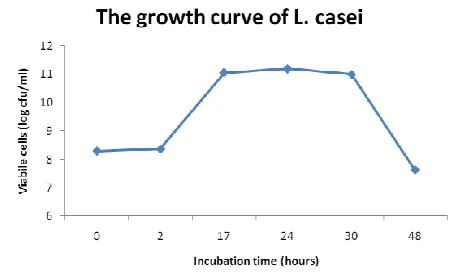
1) The grow curve of L. casei:The growth rate of L. casei
and L. plantarum strain used for whole research are presented in figure 1 and 2.
.Fig.1 The growth curve of L. Casei
It could be observed from fig 1 that the stationary phase was around from 17 to 30 hours. The cell paste was harvested after 17 hour growing, it means the cells were in late log phase and start of stationary phase. The lactobacilli also was determined with greater higher growth rates than Bifidobacteria [8]. It has been determinated that L. casei cells should be harvested after only 12 hour growing [9]. The growth phase when the cells harvested is crucial and affect significantly to the survival rate of bacteria in following process.
2) The grow curve of L. plantarum: It can be seen clearly
from the above graph that the stationary phase of this strain was from 19 to 30 hours. According to Sawaminee and Dimitris, the L. plantarum could be harvested after 16 hour growing in MRS broth at 370C to produce fermented products [10]. The duration of growing was 19 hours for L.
plantarum due to its activity and cost effectiveness. After
19hour growing, the number of probiotic was recorded with 244x106 cfu/ml.
Fig.2 The growth curve of L. Plantarum
The best time to harvest cells depends on the strains and growing environment. There are many conflicted results about this issue. The species used in this research was stored for a long time before being reactived therefore they may need more time to reach stationary phase. It is demonstrated
that cell damage was not occurred in stationary phase cells, meanwhile cell injury was observed in lag phase cells and the early log phase cells were most damaged [11]. The lack of nutrients and decline of glucose of growing conditions in the stationary phase lead to more resistant property of bacteria cells to additional stresses like osmotic, heat damage[12]. In other study, the lactic acid bacteria obtained the highest activity at the end of the logarithmic growth phase [13].
B. The change of soymilk’s quality
Fig. 3 The graph about changes of pH and Brix were recorded during 12 experiments.
1) The changes of Fami soymilk: The initial pH of Fami
soymilk was 6.75 before adding probiotics. According to the above figure, the highest pH was recorded with the growth of L. casei and no additives adding while the lowest one was in experiment with L. plantarum with additives. The pH with L. plantarum decreased faster than L. casei. It is clear that the pH of product is strain-dependent. The Brix of experiment number 6 is highest because of additives adding, while the lowest Brix was recorded at experiment 4. The additive absolutely contributed to the higher Brix . The changes of Brix value was clearer than pH value.
2) The changes of Vinasoy soymilk: The changes of pH in
Vinasoy milk is more clear than in Fami soymilk. According to the results, the pH of experiment number 3 was lowest because of L. plantarum fermentation while the number 5 one was highest. The activity of fermentation of L. plantarum is significant higher than L. casei.. The experiment number 5 with additives including sugar which make higher pH. The most stable product was the experiment number 5. There was the significant change in the brix of Vinasoy soymilk samples. The brix descreased because of the growth of probiotics. The samples with additives absolutely were higher Brix than other samples
General discussion: The changes of pH and brix have
moonomeric respectively. It is suggested that L. plantarum may have hydrolyzed raffinose through the bifidus carbohydrate catabolism pathway to produce acetate and lactate. The L. plantarum achived the highest acid lactic production in the medium with 2% raffinose. The reason is the utilization of rafinose, stachyose and sucrose in soymilk varies and depends on the a-galactosidase activity of organism. It has been reported that the growth of L.
plantarum is stronger than other organisms in the medium
compared to others because the alpha-galactosidase activity of this strain rise dramatically(Sumarna,2008). Meanwhile, the pH and brix from samples with L. casei were changed slightly compared with the one from L. plantarum. Therefore, the L. casei may be more suitable to produce product of soymilk with probiotics.
The fat content in Vinasoy sample is higher in Fami maybe another reasons made the pH change more clearerly. The fat content also make the milk is easierly spoiled than low fat content milk because of the lipid peroxidation. This would be an unstable environment for the survival of probiotics.
The higher stability quality also felt in the samples with additives compared to the one without additives. The probiotic strains affects significantly on pH while additives affects dramaticaly on the Brix in the same soymilk brand.
C. The survival of probiotics
Fig. 4 The survival of probiotics in each experiment
In the samples without additives, the number of survival probiotics was decreased slightly but still stable around 106 cfu/ml during storing at 40C after seven days. The number of survival probiotics in Fami samples was more stable and less decreased than in the Vinasoy samples.
The higher carbohydrate, lower cellulose and less fat content in Fami than Vinasoy maybe response for the survival of probiotics. The higher brix would contains more nutrition for the viability of probiotics leading to a more stable in number of viable probiotics. The lipid also decreased the growth of probiotics because they prevent probiotics access the nutrients in the medium. The cellulose could become microencapsulation materials to cover the probiotics to prevent them with growing environment. That may be the reason the probiotics in Fami is higher and more stable than in Vinasoy.
D.
E. The influences of additive on the probiotic viability and soymilk’s quality
In the sample with additive, the number of survival probiotics is more stable and slightly increased. The reason is that the main ingredient of additive is soluble fiber fructose oligosachrides (FOS) would become food for probiotic growth as prebiotic and microencapsulation materials. The FOS adding is the supplementation with prebiotics to enhance the viability of probiotics. It was reported that there was a significant increase of the probiotic growth in prebiotic-supplemented soymilk of FOS, inulin, mannitol, maltodextrin and pectin (Yeo & Liong, 2010). They also determined that the additive also gain the lactic acid production. The α-galactosidase activity of probiotics also was increased based on the FOS and maltodextrin addition that support the hydrolysis and utilisation of soy oligosaccharides and simple sugars. Therefore, it is potential to use soymilk as alternative vehicle for probiotics.
Fami with additive could be more suitable and ideal environment to carry probiotics because its low fat content and high protein, carbohydrate.
F. Sensory evaluation
The final products was slight sour, opalescent color, orange odor. The orange flavour donates the undesired flavour of soymilk and lactic acid that improve the sensory value of final products. The average liking grade of sensory evaluation was 6.8 according to the night-point Hedonic scale.
G. The effects of variables using Minitab software analysis
The effects of all variables were confirmed by the result from Minitab analysis method.
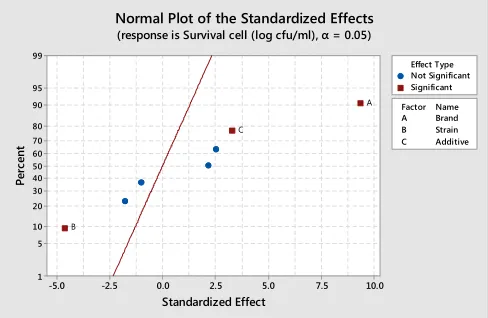
1) The Standardized effects on each response: The normal
probability plots of the standardized effects of each response were evaluated to see which effects influence the response, being presented in figure 5, 6 and 7 for survival cell, brix and pH respectively. It is easily observed from this figure that there were three variables have significant effect on the number of survival probiotics including strain, brand and additive. In term of Brix, the additive played as the significant effect type. Meanwhile, no significant effect was recorded for pH value. The reason may be the difference of pH was not statistical significant.
10.0 7.5 5.0 2.5 0.0 -2.5 -5.0
99
95 90 80 70 60 50 40 30 20 10 5
1
A Brand B Strain C Additive Factor Name
Standardized Effect
P
e
rc
e
n
t
Not Significant Significant Effect Type
C
B
A Normal Plot of the Standardized Effects (response is Survival cell (log cfu/ml), α = 0.05)
4 3 2 1 0 -1 -2 -3 99 95 90 80 70 60 50 40 30 20 10 5 1 A Brand B Strain C Additive Factor Name Standardized Effect P e rc e n t Not Significant Significant Effect Type C Normal Plot of the Standardized Effects
(response is Brix, α = 0.05)
Fig. 6 Normal plot of the standardized effects on the brix
3 2 1 0 -1 -2 -3 99 95 90 80 70 60 50 40 30 20 10 5 1 A Brand B Strain C Additive Factor Name Standardized Effect P e rc e n t Not Significant Significant Effect Type Normal Plot of the Standardized Effects
(response is pH, α = 0.05)
Fig. 7 Normal plot of the standardized effects on the pH
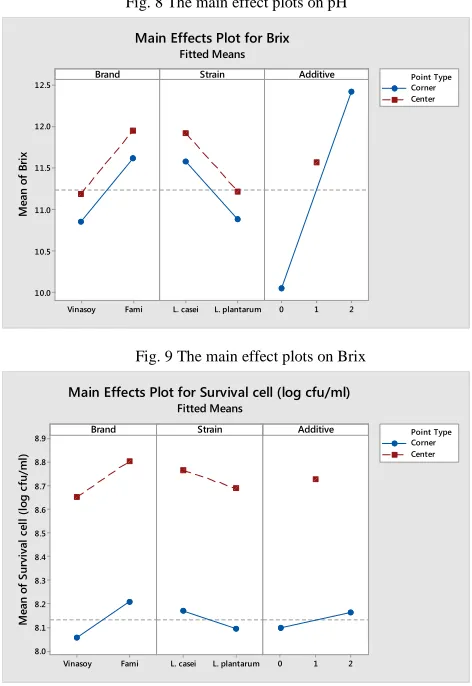
2) The main effects on each response. The main effect plot
is the difference in the mean response between two levels of a factor. The main effects plot was created for pH, brix and survival probiotics to visualize the main effects on each response, being shown in the figure 8, 9 and 10 respectively. The main effects plot shows the means of response from all experiments with variables. Each point represents the mean for one level of a factor. The horizontal center black lines show the means for all experiments. The main effect plots would adequately describe the relationship between each factor and the response.
The first panel of the plot in figure 8 indicates that the pH was affected significantly by the soymilk brands and probiotic strains. The additive just affected slightly with the line is nearly horizontal then there is no main effect. Each level of the factor affects the response in the same way, and the response mean is the same across all factor levels. Therefore, if we would like to change pH of product, we should focus on soymilk brand and probiotic strains.
Meanwhile, the additive influences significantly on the Brix of final products as being shown in figure 9 because of its steepest line.
In term of survival probiotic number, the additive shows its least effects while the brand is the most significant one. The highest quantity of viable probiotics could be achieved in the Fami soymilk.
Fami Vinasoy 5.1 5.0 4.9 4.8 4.7 L. plantarum
L. casei 0 1 2
Brand M e an o f p H Strain Additive Corner Center Point Type
Main Effects Plot for pH
Fitted Means
Fig. 8 The main effect plots on pH
Fami Vinasoy 12.5 12.0 11.5 11.0 10.5 10.0 L. plantarum
L. casei 0 1 2
Brand M e a n o f B ri x Strain Additive Corner Center Point Type Main Effects Plot for Brix
Fitted Means
Fig. 9 The main effect plots on Brix
Fami Vinasoy 8.9 8.8 8.7 8.6 8.5 8.4 8.3 8.2 8.1 8.0 L. plantarum
L. casei 0 1 2
Brand M e a n o f S u rv iv a l ce ll ( lo g c fu /m l) Strain Additive Corner Center Point Type Main Effects Plot for Survival cell (log cfu/ml)
Fitted Means
Fig. 10 The main effect plots on the survival of probiotic
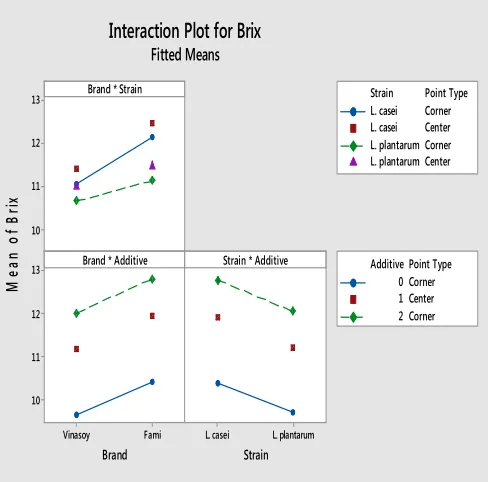
3) The interaction of effects on each response. The
relationships between variables and the strength of any relationships were identified by graphs in figure 11, 12 and 13 for pH, brix and survival cell respectively.
5.2 5.0 4.8 4.6 Fami Vinasoy 5.2 5.0 4.8 4.6 L. plantarum L. casei
Brand * Strain
Brand * Additive
Brand
Strain * Additive
Strain
L. casei Corner
L. casei Center
L. plantarum Corner L. plantarum Center
Strain Point Type
0 Corner 1 Center 2 Corner Additive Point Type
M e a n o f p H
Interaction Plot for pH
Fitted Means
Fig. 11 The interaction of effects plots on pH
Each point in the interaction plot shows the pH value at different combinations of factor levels. If the lines are not parallel, the plot indicates that there is an interaction between the two factors. The interaction plot indicates that there was no interaction between milk brands and probiotic strains. In term of the soymilk brand and additives interaction, the highest pH was recorded in the Fami milk samples without additives while the lowest one felt in the Vinasoy milk without additives. Because the slope of the line for no adding additive is steeper, it is concluded that the Fami brand has a greater effect on pH when no additive was used. Similarly, the L. plantarum have higher influence on pH when using the additive.
13 12 11 10 Fami Vinasoy 13 12 11 10 L. plantarum L. casei
Brand * Strain
Brand * Additive
Brand
Strain * Additive
Strain
L. casei Corner
L. casei Center
L. plantarum Corner L. plantarum Center
Strain Point Type
0 Corner 1 Center 2 Corner Additive Point Type
M e a n o f B ri x
Interaction Plot for Brix
Fitted Means
Fig. 12 The interaction of effects plots on Brix
There is no significant interaction between brand and additive as well as strain and additive on the brix. According to the panel of brand and strain interaction, the slope of the line for L. casei is steeper, it is concluded the Fami have greater effect on brix when the L. casei was used instead L.
plantarum. 8.8 8.6 8.4 8.2 8.0 Fami Vinasoy 8.8 8.6 8.4 8.2 8.0 L. plantarum L. casei
Brand * Strain
Brand * Additive
Brand
Strain * Additive
Strain
L. casei Corner L. casei Center L. plantarum Corner L. plantarum Center Strain Point Type
0 Corner 1 Center 2 Corner Additive Point Type
M e a n o f S u rv iv a l ce ll (l o g c fu /m l)
Interaction Plot for Survival cell (log cfu/ml)
Fitted Means
Fig. 13 The interaction of effects plots on survival cells
It could be observed from above figure that the Vinasoy have greater influence on the viability of probiotics when L.
plantarum was applied while the L. casei have higher effect
when adding additive. The highest quantity of survival probiotics could be achieved in the Fami brand with L. casei and additive.
IV.CONCLUSIONS
Soymilk was a potential medium to carry probiotics to be developed as functional beverage products with viable counts of the strains being above the minimum requirement.
L. casei is more suitable to be added into soymilk and
additives also should be included to improve the taste and maintain the probiotic quantity of final product.
ACKNOWLEDGMENT
We would like to acknowledge the support from the staffs of the Food Technology Laboratory, the University of Science and Technology, the University of Danang with their abundantly helpful and facilities preparation for this project. We also would like to convey thanks to our colleagues for their advice and encouragement to pursue this research.
REFERENCES
[1] O. A. Sowonola, T. Y. Tunde-Akintunde, and F. Adedeji,
“Nutritional and sensory qualities of soymilk kunnu blends”, African
Journal of Food Agriculture Nutrition and Development”, vol. 5, no.
2, pp. 1-12, 2005.
[2] N. T. Williams, “Probiotics”, American Journal of Health-System
[3] A. C. Ouwehand, S. Salminen, and E. Isolauri, “Probiotics: an overview of beneficial effects”, Antonie Van Leeuwenhoek, vol. 82, pp. 279-289, 2002.
[4] P. L. Teoh, H. Mirhosseini, S. Mustafa, A. S. M. Hussin, and M. Y.
Abdul Manap, “Recent Approaches in the Development of Encapsulated Delivery Systems for Probiotics”, Food Biotechnology, vol. 25, pp. 77-101, 2011.
[5] S. K. Yeo and M. T. Liong, “Effect of prebiotics on viability and growth characteristics of probiotics in soymilk”, Journal of the
Science of Food and Agriculture, vol. 90, pp. 267-275, 2010.
[6] D. Rodrigues, S. Sousa, A. M. Gomes., M. M. Pintado, J. P. Silva, P. Costa, M. H. Amaral, T. A. P. Rocha-Santos, A. C. Freitas, “Storage Stability of Lactobacillus paracasei as Free Cells or Encapsulated in Alginate-Based Microcapsules in Low pH Fruit Juices”, Food And
Bioprocess Technology, vol. 5, pp. 2748-2757, 2012.
[7] O. N. Donkor, “Influence of probiotic organisms on release of bioactive compounds in yoghurt and soy yoghurt”, Doctor of Philosophy thesis, School of Molecular Sciences Faculty of Health, Engineering and Science Victoria University, Werribee Campus, VIC, Australia, 2007.
[8] V. I. Chalova, J. M. Lingbeck, Y. M. Kwon, and S. C. Ricke, “Extracellular antimutagenic activities of selected probiotic Bifidobacterium and Lactobacillus spp. as a function of growth
phase”, Journal of Environmental Science and Health, Part B, vol. 43, pp. 193-198, 2008.
[9] A. L. F. Pereira, T. C. Maciel and S. Rodrigues, “Probiotic beverage from cashew apple juice fermented with Lactobacillus casei”, Food
Research International, vol. 44, pp. 1276–1283, 2011.
[10] S. Nualkaekul and D. Charalampopoulo, “Survival of Lactobacillus plantarum in model solutions and fruit juices”, International Journal
of Food Microbiology, vol. 146, pp. 111–117, 2011.
[11] B. M. Corcoran, R. P. Ross, G. F. Fitzgerald, and C. Stanton, “Comparative survival of probiotic lactobacilli spray-dried in the presence of prebiotic substances”, J Appl Microbiol, vol. 96, pp. 1024-1039, 2008.
[12] A. Janusz, “Drying ofMicroorganisms forFood Applications”,
Advances in Food Dehydration, CRC Press, pp. 315-353, 2008.
Sumarna, “Changes of raffinose and stachyose in soy milk fermentation by lactic acid bacteria from local fermented foods of Indonesian”, Malaysian Journal of Microbiology, vol. 4, pp. 26- 34, 2008.