INVESTIGATION OF THE IMPACT OF SELECTED ADDITIVES ON
INDEX PROPERTIES OF SUBGRADE SOILS
F. E. Elufowoju*
PHYSICAL PLANNING & DEVELOPMENT UNIT, OBAFEMI AWOLOWO UNIVERSITY, ILE-IFE, OSUN STATE, NIGERIA.
E-mail address: [email protected]
ABSTRACT
An investigation into the effects of steel slag and saw dust ash on index properties of selected subgrade soils is here presented. The influence of various percentages by weight of steel slag and saw dust ash on index properties i.e. liquid limit, plastic limit, plasticity index and linear shrinkage of subgrade soils were deduced from the results of laboratory analysis conducted in accordance with standards. The results obtained showed that values of the index properties decreased as the quantities of steel slag and saw dust ash added to the soils increased and vice versa.
Keywords: index properties, liquid limit, plastic limit, plasticity index, linear shrinkage, steel slag, saw dust ash
1. INTRODUCTION
Soil is an aggregation of particles that may range very widely in size. Some of these particles are given specific names according to their sizes, such as gravel, sand, silt, clay, etc. Soil, being a mass of irregular-shaped particles of varying sizes, will consist of the particles (or solids), voids (pores or spaces) between particles, water in some of the voids, and air taking up the remaining void space [1].
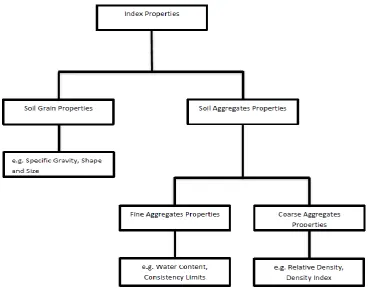
The soil properties, on which their classification and identification are based, are known as index properties. These properties include: (i) Grain Size Distribution (size and shape of particles), (ii) Consistency Limits (relative density), and (iii) Plasticity Index. The index properties of soils can be studied in a general way under two classes. They are: (a) Soil grain properties, and (b) Soil aggregate properties. The principal soil grain properties are the size and shape of grains, and the mineralogical character of the finer fractions (applicable to clay soils). The most significant aggregate property of cohesionless soils is the relative density, whereas that of cohesive soils is the consistency. Water content can also be studied as an aggregate property as applied to cohesive soils. The strength and compressibility characteristics of cohesive soils are functions of water content. As such water content is an important factor in understanding the aggregate behavior of cohesive soils. By contrast,
water content does not alter the properties of a cohesionless soil significantly except when the mass is submerged, in which case only its unit weight is reduced. When water is added to the dry soil mass, it changes from solid state to liquid state; passing through semi solid and plastic states. Atterberg identify some other limits which are most useful for engineering purpose [2, 3]. Index properties are properties that help in the identification and classification of soils, and are also indicative to the engineering properties. These properties are in two broad categories as shown in Figure 1.
Atterberg developed a method for describing the limit consistency of fine-grained soils on the basis of moisture content i.e. the consistency limits and/or the water content of soils indicates the percentage of fine aggregates in soil. Atterberg limit includes; liquid and plastic limits, plasticity index and linear shrinkage limit. Atterberg limit is the water content at which the consistence of a fine-grained soil is transformed from plastic state to liquid state and from semi-solid state (shrinkage limit) to a plastic state [4, 5].
Various researchers have studied the effects of using wastes materials as additives or alternative construction material. Steel slag (SS) and sawdust ash (SDA) are wastes (by-products of production of steel, and open air or controlled combustion of shavings from wood sawing respectively).
Vol. 38, No. 2, April 2019, pp.
289 – 297
Copyright© Faculty of Engineering, University of Nigeria, Nsukka,Print ISSN: 0331-8443, Electronic ISSN: 2467-8821
Figure 1: Classification of index properties (adapted from www.civildigital.com/index-properties-soil-determined)
Slag according to [6] can be used in construction of semi rigid pavement structure which does not deform under traffic load and not flexible enough to resist cracking by mixing together basic oxygen furnace (BOF) slag, blast furnace (BF) slag and fly ash in controlled proportions. Based on the study conducted by [7] on the influences of steel slag utilization as coarse aggregate on hot mix asphaltic concrete properties; it was concluded that the introduction of steel slag (in predetermined optimal quantity) into the asphalt mixes produced better Marshall Stability and flow test results than mixtures with limestone. Wood ash generally possesses certain pozzolanic property [8] which can affect most geotechnical properties of soil thereby making it suitable for construction works; [9] also affirmed that the introduction of wood ash to soil is to serve as stabiliser or conditioner for the soil. It has been established that the capacity of wood ash to hold water is its most significant effect when mixed with soil [10, 11].
This research studied the impact of steel slag, and saw dust ash as additives on the index properties of selected subgrade soils. The combined usage of these materials as additives for improving the index properties of subgrade soil is desirable; hence this
study.
This research shall provide information on the suitability and optimum percentages of steel slag and saw dust ash required as additives for improving the index properties of the selected subgrade soils.
2. METHODOLOGY
Laboratory analysis of the soil samples were carried out in accordance with standard procedures in BS 1377-1(2016) and BS 1924 (1990). Index characteristics such as liquid limit, plastic limit, plasticity index and linear shrinkage limit of soil were first determined for the soil only, then for mixtures of soil+SS, and soil+SS+SDA in pre-determined percentages (i.e. percentage replacement by weight of dry soil).
2.1 Collection of Samples
Plate 1, Granulated steel slag
Plate 2, Steel slag fragments
Plate 3, Sun-drying saw dust
Sawdust was collected from a saw mill within the premises of the plank market opposite Olopomeji bus stop along Ilesa road, Ile-Ife, Osun State. It was noted
that the particles of saw dust collected has different colours (i.e. yellow, brown, cream etc.) which suggests the particles may have come from different species of trees. The saw dust was sun-dried to remove moisture in order to enhance burning (Plate 3). The dried saw dust was packed into a steel drum and set on fire to burn until it completely turns into ash. In the opinion of [12], the temperature at which the saw dust burns in open air may not be less than 600 oC.
Soil samples were collected from three different locations in Osun state, Nigeria (Figures 2 & 3). The soil samples were collected from three different formations as shown on Figure 4. The coordinates of these locations were determined using a GPS. The selected sites and sample names are as follows;
Figure 2: Map of Nigeria Showing Osun State (www.google.com/Nigeriamap)
Figure 3: Map of Osun State Showing Ife-Central and Atakumosa-West Local Government Areas
Figure 4, Geological Map of the Area around Ile–Ife (Adapted from Microsoft Encarta 2009 and Iwo Sheet 60 Geological Map)
Plate 4, Sample A
Plate 5, Sample B
(i) Soils sample A is red in colour with some mica content, (see Plate 4) was collected from a borrow pit on coordinate N – 07o34’28.0”, E –
004o36’44.0” at the outskirt Osu in Atakumosa
-West Local Government Area, Osun State. (ii) Soil sample B which is cream coloured with some
ting of yellow and red, and mica content (Plate 5) was obtained from a proposed project site on coordinate N – 07o29’35.7”, E – 004o28’57.7” at
Fasina area, along Ife/Ibadan expressway in Ife-Central Local Government Area, Osun State. (iii) Soil sample C which has chocolate brown
colouration with substantial mica content (Plate 6) was obtained from a location at the outskirt of Abagbooro on coordinate N – 07o32’25.2”, E –
004o30’59.5” along Tonkere road, Obafemi
Awolowo University, Ile-Ife, in Ife-Central Local Government Area, Osun State.
C
Plate 6: Sample C
Overall four tests namely; grain size analysis, liquid limit; plastic limit and linear shrinkage were conducted on each of the samples (i.e. A, B and C). The samples were first spread on a plinth large enough to enhance air drying. Some quantity of each sample was taken for grain size analysis and oven dried at 110 oC for 24
hours to ensure total removal of moisture before weighing the quantity to be used.
2.2 Grain Size Analysis of Soil samples
Samples A, B and C, and SS (500g each) were washed under running water in two sieves – 75 µm sieve (BS No. 200) and 63 µm sieve (BS No. 240) to completely remove the silt content. The materials retained on the two sieves were washed carefully into labelled metal dishes (one for each soil sample and SS), with a little quantity of water. The dishes were kept in the oven for 24 hours at 110 oC after which the dried sample
were sieved by agitating the material through a set sieves whose individual weights had been determined and recorded. The material retained on each sieve was weighed together with sieve and recorded. The percentage of material retained on each sieve was calculated as a ratio of the mass retained over mass of dried sample sieved multiplied by 100%. The percentage of material passing through each sieve was calculated as a cumulative difference between percentages retained on each sieve (starting from percentage retained on the first sieve which is deducted from 100%). The sieve opening was plotted against percentage passing (finer) on a logarithm paper to determine the grading of the soil, the uniformity coefficient (Cu) and the coefficient of
curvature (Cc).
2.3 Liquid Limit Determination
Casagrande apparatus was used in determining the
dried soil sample passing 425 µm sieve (BS No. 36) was mixed thoroughly with little water to form a uniform paste. A portion of the paste was placed in the cup of the Casagrande apparatus and the surface smoothened with spatula to a maximum depth of 10 mm. The curved end of the grooving tool was drawn transversely through the soil paste; along the symmetrical axis of the cup, while holding the tool perpendicular to the cup. The handle of the Casagrande apparatus was turned at 2 revolutions per second and the number of blows that closed the bottom of the groove by 10mm length was recorded. A small portion of the soil paste was cut from either sides of the groove to determine the moisture content. The remaining soil paste in the cup was transferred onto a glass plate and mix thoroughly after adding a small quantity of water.
The above procedure was repeated for samples A, B and C only, then for soil-SS mixtures and soil-SS-SDA mixture at 95:5, 90: 10, 85:15, 80:20 percentages by weight of dry soil; with 3, 5, 7, and 10 percentages by weight replacement of SS by SDA in the latter. The procedure was repeated five times to obtain a set of readings. The moisture contents (%) for the number of blows obtained from each of the mix ratios and the soil samples only were recorded. The moisture contents (%) values for each sample and mix ratios were plotted against the number of blows. The liquid limit for each sample and mix ratio was taken as the moisture content (%) corresponding to 25 blows as obtained from the graphical plot.
2.4 Plastic Limit Determination
About 30 g of air dried soil sample passing through
425 μm sieve (BS No 36) was mixed thoroughly with
and rolling again.
2.5 Linear Shrinkage
About 100 g of soil passing through 425 µm sieve (BS No. 36) was mixed thoroughly with water until a paste is formed. The shrinkage mould was cleaned properly to remove all dirt and soil particle. The inside of the mould was coated with a thin film of Vaseline after its empty weight was taken and recorded as M1. The soil
paste was loaded into the mould with a spatula while tapping the mould gently on a hard surface. The edge of the spatula was used to smoothen and level the top surface of the paste. The length and weight of the soil paste and the shrinkage mould were taken and recorded as L1 and M2 respectively. The mould was
kept in the oven for 24 hours at 110 oC after which the
length and weight of dried soil and mould were taken and recorded as L2 and M3 respectively. The essence
of the taking the weights was to determine the moisture content of the paste. The above procedure was repeated for samples A, B and C only, then samples A, B and C plus SS at soil–SS mix ratio of 95:5, 90: 10, 85:15, 80:20 percentage by weight of dry soil, and samples A, B and C plus SS and SDA at soil-SS-SDA mix ratio of 95:5, 90: 10, 85:15, 80:20 percentage by weight of dry soil; with 3, 5, 7, and 10 percentages by weight replacement of SS by SDA. Figure 8; show the response of the soil samples to the addition of varying percentages of SS and SDA for linear shrinkage limits. The linear shrinkage value was calculated from the following equation;
𝐿𝑆(%) = (1 −𝐿𝑑
𝐿𝑞
) × 100 (1)
Where: LS= Linear shrinkage; Ld = Length of oven dried sample and Lq = Initial length of specimen
3. RESULTS AND DISCUSSION 3.1 Soil Classification
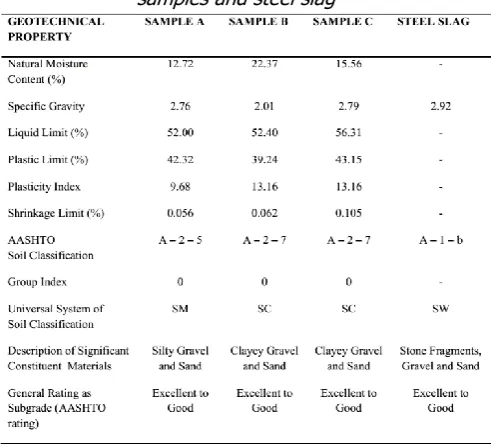
The three soil samples and steel slag were classified using the AASHTO and USCS soil classification systems as shown in Table 1. AASHTO system of classification was used to classify sample A as A-2-5 soil; because less than 35 % of the soil material was finer than 75 µm, liquid limit was greater than 40 % while the plasticity index was lower than 10 %, whereas samples B and C were classified as A-2-7 because less than 35 % of their materials were finer than 75 µm, their liquid limits were greater than 40 % and their plasticity indexes greater than 11 %. Steel slag was classified as A-1-b since only 16.83 % of it (< 25% max.) was finer than 75 µm.
By USCS classification, sample A was classified as sandy-silt (SM) because its plasticity index (PI) < 10 % with 0.5 % fines content (i.e. material passing 75 µm), samples B and C were classified as sandy-clay (SC) because their PI > 11 % and 0.5 % fines content (i.e. material passing 75 µm). Steel slag was classified as well graded sand (SW) because a greater percentage of the material falls within the sand bracket (coarse and medium dense sand) also the percentage of materials of different particle sizes that constitute steel slag were within the same range (Table 2).
The particle size distribution curves (Figure 5) of samples A, B and C are similar due to the fact that the bulk of the soil are made up of medium and fine sand particles (Table 2) than steel slag.
Table 1. Summary of geotechnical properties of soil samples and steel slag
3.2 Atterberg Limits
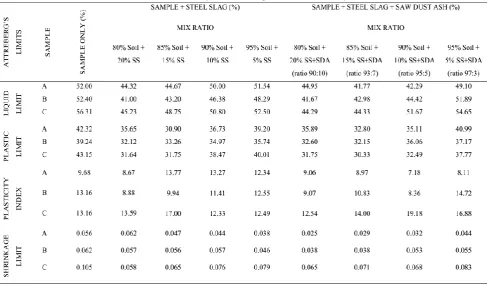
Table 3 shows that soil sample C has the highest liquid limit value of 56.31 % compared to soil samples A and B which are 52.00 % and 52.40 % respectively. The plastic limits were; 42.32 % for sample A, 39.24 % for sample B and 43.15 % for sample C. According to [13], soils containing kalonite clay minerals have liquid limits values ranging from 52.0 % upwards and plastic limit values ranging from 15 % upwards; this gives an indication that the soil samples may contain kaolinite minerals. Similarly, soils have low plasticity if their liquid limit is less than 35 %, while 35 % to 50 % indicates intermediate plasticity [14]. A plasticity value between 50 % and 70 % indicates high plasticity; between 70 % and 100 % very high plasticity. The plastic limits recorded for soil samples A, B and C, categorised them as having intermediate plasticity. Table 3 shows the effects on index properties of soil samples when varying percentages of SS and SDA were added. It was recorded that the liquid limit of the soils dropped from 52 %, 52.4 % and 56.31 % respectively for samples A, B, C to 44.32 %, 41.00 % and 45.23 % respectively when 20 % SS was added to each of samples A, B and C. However, the values rose gradually back to over 50 % as the percentage of SS added to the soil reduced. The same trend was observed with the addition of SDA into the mix; liquid limit for the soils dropped to 44.95 %, 41.67 %, and
44.29 % respectively at 20 % SS+SDA. The values then rose gradually back to over 50 % as the quantities of additives decreased.
The plastic limit of the soils also dropped from 42.32 %, 39.24 % and 43.15 % for the soils only to 35.65 %, 32.12 % and 31.64 % when 20 % SS was added to samples A, B and C respectively. However, the values rose gradually back to 40 % as the percentage of SS added to the soil reduced from 20 % to 5 % by weight of soil sample used. A similar trend was observed when with the addition of SDA into the soil-SS mix. The plastic limit values for the soils dropped to 35.89 %, 32.60 %, and 31.75 % respectively when 20 % SS+SDA was added to the soil samples. The plastic limit values then rose gradually back to about 41 % as the quantities of additives in the mixture was reduced to 5 % by weight of soil sample.
The plasticity index of each soil samples was reduced from 9.68 % for sample A, and 13.16 % for samples B and C; at 100 % soil to 8.67 %, 8.88 % and 13.59 % for samples A, B and C respectively when 20 % slag was added to each soil sample. The plasticity indexes of the soils rose gradually as the quantity of steel slag in each mix reduce thereby making for increased quantity of fines. The three samples reacted almost in similar manner to moisture at 5 % SS; as their plasticity indexes were approximately the same value (Table 3).
According to [15] and [16], the quantity of moisture absorbed by soil before it reaches its plastic limit depends on the quantity of fines (i.e. particles passing 0.075mm sieve) it contains. It therefore follows that the higher the quantity of particles coarser than 0.075mm the lower the quantity of moisture required by the soil to reach its plastic limit. It is the opinion of [17] that properties of subgrade soil can be improved by blending of soils with additives to achieve a desired gradation, texture or plasticity, or act as a binder to cement the soil. The improvement occurs due to the chemical reaction between the additive and soil as well as strength and stiffness; the additive may also improve gradation, workability and plasticity of subgrade soil. Likewise, [18] submitted that stable subgrade can be achieved by increasing the soil particle size through a reduction in the plasticity index, reducing the shrink/swell potential and cementation. Soil plasticity is caused by the adsorbed water surrounding the clay particles; the type of clay minerals and their proportional amounts in a soil will affect the liquid and plastic limits. Plasticity index of a soil increases linearly with the percentage of clay-size fraction (% finer than 0.002mm by weight) present [19].
Fine-grained soils contain both clay minerals and associated minerals, and the interactions between the
clay minerals and water affect the soil’s water-holding capacity. Water is strongly adsorbed onto the external surfaces of hydrophilic non-swelling clay minerals, whereas water adsorbs onto both the external and internal surfaces of swelling clay minerals. Soil composition influences the water content at the liquid and plastic limits. The plasticity index of a soil increases linearly with the percentage of clay-size fraction present. Therefore the quantity of water at the Atterberg limits depends mostly on the size and the portion of clay minerals in non-swelling soils, while in swelling soils it also depends on the quantity of interlayer water, which is mostly dependent on the type of clay minerals, exchangeable cations and the chemical composition of the pore water [20] and [4]. In summary, Atterberg limits of soil depends on the coarseness or fineness of the soil particles; that is the quantity of fine or coarse particles contained in a particular soil dictates its moisture content and change from plastic to liquid or to semi solid etc.
4. CONCLUSIONS
The following conclusions were drawn from the outcome of this study;
i. The addition of varying percentages of steel slag and saw dust ash to each of the soil samples A, B, and C has effects on their index properties. ii. Liquid limit, plastic limit, plasticity index and linear
shrinkage values of the selected soil samples reduced when higher percentages of steel slag and saw dust ash were added to the soil samples (10 % - 20 %).
iii. The liquid limit, plastic limit, plasticity index and linear shrinkage of the soil samples increased at lower percentages of SS and SDA to values closer to that recorded at 0 % SS and SDA.
iv. The quantity of fine particles contained in the soils samples dictate their moisture contents and changes observed in liquid and plastic limits of samples. Hence, the Atterberg limits of soils depend on its texture, i.e. the degree of coarseness or fineness of the soil particles.
5. REFERENCES
[1] Bowles, J. E. (1995), Foundation Analysis and Design, McGraw-Hill Science Engineering Math, New York, pp. 16 – 17.
[2] Hasseb, J. (2017), Index Properties of Soil,
www.aboutcivil.org/index-properties-of-soil.ntml, accessed 19/02/2019
[3] Murthy, V.N.S (2002), Geotechnical Engineering: Principles and Practices of Soil Mechanics and Foundation Engineering, Seventh Edition, Marcel Dekker Incorporated, 270 Madison Avenue, New York, New York10016, pp. 52 – 53.
[4] Bojana, D., and Stanislav, Š. “Atterberg Limits in
Relation to other Properties of Fine-Grained
Soils”, Acta Geotechnica Slovenica, Vol. 5, Number 5, 2013, pp 1-9.
[5] Das, B.M. (2008), Advanced Soil Mechanics, Third Edition, Taylor & Francis, 270 Madison Avenue, New York, NY 10016, USA, and 2 Park Square, Milton Park, Abingdon, Oxon OX14 4RN, pp. 47. [6] Ebenezer, A. O., Mohd, R. H., and Md.
Maniruzzaman, A. A. “Characteristics and Utilisation of Steel Slag in Road Construction”,
Journal Teknologi, Vol. 70, Number 7, 2014, pp 117-123.
[7] Ahmedzade, P. and Sengoz, B. “Evaluation of
Steel Slag Coarse Aggregate in Hot Mix Asphalt
Concrete”, Journal of Hazardous Materials, Vol. 165, Number 1-3, 2009, pp 300-305. [8] Okunade, E. A. (2008). “The Effect of Wood Ash
1042-1048.
[9] Amu, O., Adewumi, I. K., Ayodele, A. L.,
Mustapha, R. A. and Ola, O. O. “Analysis of
California Bearing Ratio Values of Lime and Wood
Ash Stabilized Lateritic Soil”, Journal of Applied Sciences, Vol. 5, Number 8, 2005, pp 1479-1483. [10] Etiegni, L. and Campbell, A. G. “Physical and
Chemical Characteristics of Wood Ash”,
Bioresource Technology, Vol. 37, Number 2, 1991, pp 173-178.
[11] Misra, M. K., Ragland, K. W., and Baker, A. J.
“Wood Ash Composition as a Function of Furnace Temperature”, Biomass Bioenergy, Vol. 4, 1993, pp 103-116.
[12] Raheem, A.A. and Sulaiman, O.K. (2013). Saw Dust Ash as Partial Replacement for Cement in the Production of Sandcrete Hollow Blocks. International Journal of Engineering Research and Applications 3(4): 713.
[13] Bain J. A. (1970). A Plasticity Chart as an Aid to the Identification and Assessment of Industrial Clays, Institute of Geological Sciences, London, 1970.
[14] Withlow, R. Basic Soil Mechanics (Third ed.), Addison Wesley Longman Limited, Harlow Essex, England, 1995.
[15] Akinwunmi, I.I. “Utilization of Steel Slag for Stabilization of a Lateritic Soil”, Unpublished Master of Engineering Thesis, Department of Civil Engineering, Covenant University, Ota, Ogun State, 2012, pp 43, 45, 53.
[16] Ismail, A. I. M. & Belal, Z. L. “Influence of Slag
on the Improvement of Engineering Properties of
Different Soils, Nile Delta, Egypt”. National Science, Vol. 12, Number 3, 2014, pp 7-78. [17] Department of the Army. “Materials Testing”, FM
5-572/NAVFAC MO 330 / AFJMAN, Vol. 32-1221, Number 1, 1999, pp 2 – 62.
[18] Ika-Putra A. “Stabilisation of Expansive Subgrade Soils With Slag And Cement For Road Construction”. Unpublished M.Phil Thesis,
Department of Civil Engineering, Faculty of Science and Engineering, Curtins University, 2014.
[19] Das, B.M. “Principles of Foundation Engineering (Seventh ed., SI)”, Stamford, CT: Cengage
Learning, 2011.