Hidden Costs in the Evaluation of Quality Failure Costs
Vytautas Snieska, Asta Daunoriene, Alma Zekeviciene
Kaunas University of Technology
K. Donelaicio st. 73, LT-44309, Kaunas, Lithuania
e-mail: [email protected], [email protected], [email protected]
http://dx.doi.org/10.5755/j01.ee.24.3.1186
In modern global market organizations striving for survive and successful compete have not only to satisfy needs of customers but to perform it with the least costs.
Specialists of quality management determined that quality costs make a big part of total factor costs, taking about 30 % (Srivastava, 2008). Reducing of quality costs allows reducing of total organizational costs that would result in reducing of price of goods manufactured or services supplied, increase of customers’ satisfaction or improved oeganization performance (Juran, 1951; Crosby, 1979; Heagy, 1991; Tsai, 1998; Moen, 1998; Malchi & McGurk, 2001; Prickett & Rapley, 2001; Love & Irani, 2003; Tannock & Saelem, 2007; Sower, Quarles & Broussard, 2007; Wu et al., 2011). Organizations that have prepared the programs of quality costs accounting adapted to their specific activity and paying more attention to implementation of quality programs, can identify, set in underlying order, evaluate and select quality investments more easy (Bottorff, 1997). Also quality costs programs allow calculation of return of investment to quality, help to find out how development is going (Gray, 1995), determine where highest costs appear and allow to find out what is the loss due to poor quality (Bottorff, 1997). Unfortunately, many organizations don’t know their quality costs (Yang, 2008). Between the reasons determining the absence of quality costs accounting in the organization, following are indicated: use of many types of different accounting systems (Harry & Schroeder, 2000), traditional costs accounting systems are not adapted to identify quality costs data (Chiadamrong, 2003), lack of adequate methods to determine the results of poor quality (Chen & Yang, 2002).
Studies performed by Viger & Anandarajan (1999) show that organizations that are calculating and analyzing quality costs, are making efficient decisions more often than those not calculating quality costs. Having calculated the loss due to poor quality and determined where its appearance is the largest, organizations can make decisions allowing optimization of quality costs. While optimizing quality costs, benefit increases (Fine & Charles, 1986; Freiesleben, 2005). Also, optimization of quality costs is a condition necessary to survive and anchor in the market.
Quality costs programs were implemented and used worldwide (Carr, 1992; Schiffauerova & Thomson, 2006a).
However, both the scientific literature and enterprises’ practice still are having questions how to calculate all constituents of categories of quality costs in details in striving for maximal benefit from the system of accounting of quality costs. In the article there is discussion about the problems of quality costs accounting in striving for detailed calculation of all quality costs, a problem of lack of hidden failure quality costs accounting methodology analyzed, a review of literature on quality costs accounting models presented, the studies performed by other authors discussed, suggestions how to calculate hidden failure quality costs presented. An empirical study was performed in Lithuanian organization where methodology of accounting of constituents of hidden failure quality costs was tested.
Keywords: external failure quality costs, evaluation of hidden failure quality costs, loss of customer loyalty, loss of image, quality costs models.
Introduction
Now quality costs in worldwide practice are usually distinguished into three main categories of quality costs: prevention, appraisal and failure (by distinguishing inner and external) costs (Sharma & Kumar, 2007; Sower et al., 2007; Schiffauerova & Thomson, 2006a; Tannock & Saelem, 2005; Angell & Chandra, 2001). Orientation of modern organizations towards satisfaction of customers’ needs and expectations requires for decrease of failure costs and improvement of quality (Mukhopadhyay, 2004). Calculation of external failure quality costs allows organizations to find out what loss they are suffering because the mistakes committed influenced the customer. Therefore external failure quality costs are determined as one of the most significant quality costs.
are not evaluating hidden failure quality costs (Porter & Rayner, 1992; Tatikonda & Tatikonda, 1996).
Hidden external failure quality costs are difficult to be identified, measured and evaluated in numbers therefore in calculation of external failure quality costs, hidden quality costs are not determined usually. However these costs have not to be unnoticed or ignored. Summers (2000) states that even if hidden failure quality costs can only be named but not evaluated quantitatively, knowing of them is important and useful for organization.
External failure quality costs have been analyzed worldwide by many scientists (Feigenbaum, 1956, 1961; Crosby, 1979, 1996; Juran, 1951; Malchi & McGurk, 2001 et al.) and evaluated by many global organizations. However in the scientific literature there is no methodology allowing calculation of all external failure quality cots. It is important to form a methodology allowing evaluation of all external failure quality costs. Therefore scientific problem analyzed in the study is formulated as a question: how to make an integrated evaluation of external failure quality costs that are composed of visible failure quality costs and hidden ones?
Research goal – creation of methodology of evaluation of external failure quality costs.
Research object –external failure quality costs. Research method is composed of theoretical background of methodology based on analysis of scientific literature and of results pilot study performed in Lithuanian organization. Lithuanian enterprises have no practice of calculation of quality costs. Therefore testing of external failure quality costs in national context is overbearing.
Theoretical background
There is no one agreement how costs of quality should be classified (Machovski & Dale, 1998; Yang, 2008). Quality costs are evaluated according to main four models of quality costs accountancy: P-A-F or „Crosby“ model (Feigenbaum, 1956), model of possibilities costs (Sandoval-Chavez & Beruvides, 1998); Modarress & Ansari, 1987), process costs model (Ross, 1977; Marsh, 1989) and ABC (Activity Based Costs) model (Cooper, 1988; Cooper & Kaplan, 1988). Dividing in accordance to the categories indicates common principles of quality costs models. Having analyzed quality costs models, Hwang & Aspinwall (1996) indicated their advantages and disadvantages. In order the quality costs model selected by the organization should become a successful systemic tool, it should be corresponding organization’s present state, environment, goals and demands (Schiffauerova & Thomson, 2006a; Schiffauerova & Thomson, 2006b; Tsai & Hsu, 2010).
For the present, in worldwide practice quality costs are usually calculated according to the P-A-F (Prevention, Appraisal, Failure costs) model presented by (Feigenbaum, 1956; Superville et al., 2003). Many of used quality costs models are based on P-A-Fclassification(Plunkett & Dale, 1987; Machowski & Dale, 1998; Sandoval-Chavez & Beruvides, 1998). P-A-F model is being mostly discussed in the scientific literature as well.
The main assumptions for P-A-F model are that investment to prevention and appraisal activities decrease
failure quality costs, and, further investment to prevention activity decrease appraisal quality costs (Porter & Rayner, 1992; Plunkett & Dale, 1987). The goal of quality costs system is to find the level of quality where total quality costs are decreasing.
The P-A-F scheme of Feigenbaum and Juran was confirmed by American Society for Quality Control (ASQC, 1971), British Standard institute (BS6143, 1990), Council of Australian Standards Association (AS2561-1982, 1982; AS2561-2010, 2010), it is used in many organizations that are evaluating quality costs as well (Porter & Rayner, 1992).
External failure costs appear when the mistakes committed by the organization influence customer directly, i.e., when products of poor quality have reached customers already (Campanella, 1999). Despite the fact that every particular sector of industry has own unique elements of external failure costs (Plunkett & Dale, 1986), typical external failure costs usually include such costs as:
complaints investigation;
costs of returned products and services;
costs of defect product repair, change at customer’s; cost of warranty service;
discounts due to nonconformance of products and services;
fines for breach of ecological and other laws; costs of lost customers’ goodwill;
costs of lost image.
External failure quality costs are considered as one of the most significant quality costs that are the most difficult to evaluate between all four categories of quality costs (Sower, 2004). This statement is reasoned because external failure quality costs are suffered by customers directly, furthermore, these costs for many organizations make 50 to 90 of all quality costs.
Despite now quality costs in worldwide practice are usually divided according to P-A-F model presented by Feigenbaum and Juran, the model is being criticized by different authors for few reasons. One of them is that the original P-A-F model doesn’t include hidden failure quality costs (Yang, 2008; Krishnan, 2006; Tsai, 1998; Modarress & Ansari, 1987).
Dahlgaard, Kristensen & Kanji (1992) stated that when using traditional PAF classification, part of poor quality costs remains unevaluated and offered to distinguish quality costs into visible and invisible (hidden).
Visible external failure quality costs include such costs as: complaints investigation, costs of returned products and services, change at customer’s, warranty costs, discounts due to nonconformance of products and services as well as fines for breach of ecological and other laws. These visible failure costs for organizations are not difficult to evaluate, i.e. to express in terms of money.
evaluated with the help of quality function development quality home matrixes (matrixes of customers’ needs and benefits, and modified planning matrix). This is the only model known that helps calculating how many hidden failure quality costs are suffered by the organization.
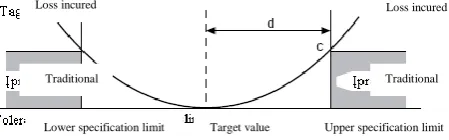
Some authors offered to use Taguchi’s loss function to control external failure quality costs. Such components as lost sales (Margavio et al., 1994) and hidden failure costs (Albright & Roth, 1992; Kim & Liao, 1994) would be under control as well, for example, customers dissatisfaction, costs due to lost image and lost part of market. However, Taguchi’s loss function does not present a particular method how external hidden failure quality costs could be calculated. (Moen, 1998; Margavio et al., 1994).
American Society for Quality Control supported the use of Taguchi‘s loss function for the principles of quality costs in general terms as well. However, a little was done in order to describe value within the limits of tolerance (c) and distance from target value of these limits (d). These values are essential in determining proportionality constant (k), and then total value of Taguchi’s loss function. Since values (c) and (d) are essential, but there is no good methodology presented allowing their calculation. In order to avoid this problem, a simplified activity based costing (ABC) method for quality cost was created (Cooper, 1988; Cooper & Kaplan, 1988).
By using simplified activity based method for quality costs, there is striving to analyze unsatisfied demands of customers as ease manageable and measureable activities, and to add quality costs of every activity to categories of total quality costs respectively. In striving for determining of external failure quality costs, every demand of customers’ is being analyzed. Simplified activity based costing (ABC) method for quality costs relates external failure quality costs to final product through particular activities performed in the organization. In evaluating of external failure quality costs, it is proposed to distribute every activity directly and indirectly into such elements: labour (labour expenditure), unnecessary material, process interference and use of equipment.
Figure 1. Taguchi‘s loss function
The use of the method of quality cost calculation based on simplified activity determines changes in Taguchi‘s loss function.
Hidden external failure quality costs include costs of loss of customers‘ loyalty, image loss and brand damage.
Many programs of quality costs accounting performed in organizations are not covering external hidden failure quality costs (Bottorff, 1997; Carr, 1992). There are organizations that are bound on thorough calculation of all quality costs and finally discard their intention of calculation of possibilities costs and external hidden costs
(Burns, 1976; Dale & Wan, 2002) because such accounting seems too sophisticated and unclear to them. Without calculation of external hidden failure quality costs, organizations are running the venture to obtain long term effect of customers’ dissatisfaction (Albright & Roth, 1992; Carr & Tyson, 1992; Deming, 1986; Feigenbaum, 1961). Importance of accounting of hidden quality costs elements was indicated by Juran & Gryna (1988), Goodstadt & Marti (1990). According to Heagy (1991) the loss of organization’s image often costs much more than expected and ignoring of loss costs leads managers of organizations to make wrong management decisions. Malchi & McGurk (2001) state that organizations that realized and satisfied needs of customers are profitable threefold better than organizations with quality that is lower in customers’ point of view.
This could determine other problems as well, because mistakes while gathering data can distort quality costs and influence unsuitable management decisions (Tatikonda & Tatikonda, 1996). Therefore managers are not willing to invest to preventive activity of decrease of quality nonconformity, which diminishes the importance of quality costs data.
The results of lack of accounting of hidden external failure quality costs are being felt by the organization for a long time. They are expressed by such results as, for example, decrease of part of market, loss of competitive advantage. Hidden external failure quality costs directly reduce business, increase present total costs. For example, in striving to return lost customers more resources are required for support. With no means provided for control of hidden external failure costs, organization’s activity can become unprofitable. Therefore hidden external failure quality costs have to be controlled. According to Giakatis, Enkawa & Washitani (2001), hidden external quality costs are much bigger than part of the costs calculated by P-A-F model.
Of late years accounting of possibilities and hidden external failure quality costs are reputed as very significant (Srivastava, 2008; Yang, 2008; Tsai & Hsu, 2010), because a huge competition is stimulating organizations for search of ways of higher activity.
Different authors are classifying different costs as hidden external failure quality costs, but they are very similar essentially. For example, Campanella (1999) and Summers (2000) are classifying loss of customers’ goodwill, loss of organization’s image, lost sales as hidden external failure quality costs. Modarress & Ansari (1987) consider costs of loss of customers’ goodwill as hidden external failure quality costs. Evans and Lindsay (2005), Albright & Roth (1992) while examining hidden external failure quality costs, make accent on importance of reputation and image because future perspectives and sales depend on them. Hidden external failure quality costs are being related to nonmaterial values such as organization’s reputation, customers’ needs. Tsai (1998) puts costs of lost image and lost sales among hidden external failure quality costs. Krishnan, Agus & Husain (2000) calculated loss of inefficient work time. According to the opinion of Kaynama & Black (2000) hidden external failure quality costs are composed of costs of lost organizations’ image, unsatisfied angry customers, lost sales and loss due to
Loss incured Loss incured
Target value
Lower specification limit Upper specification limit
judicial claims. Schiffauerova & Thomson (2006a) think that hidden external failure quality costs are costs that can be calculated as unearned income. Srivastava (2008) assumes lost current sales, lost future sales and loss of society as hidden quality costs. Yang (2008) offered to supplement traditional P-A-F model with hidden external quality costs that are composed of two costs categories: extra resultant quality costs and estimated hidden quality costs, and to calculate them in every process having place in organization.
All methods of quality costs accounting reviewed only partially reflect quality related costs, that can be calculated by using information from chosen accounting system. In order to evaluate external hidden failure quality costs different models of quality costs analysis and evaluation has to be integrated.
Research and analysis method
The main objective of this article is to explore the practical issues of external failure quality costing.
External failure quality costs evaluation methodology has been based on deduction principles with a purpose to systematize and integrate different external failure quality costs analysis methods.
With reference to analyzed scientific literature, all external failure quality costs in the empirical study are divided into two parts (Figure 2):
1) visible external failure quality costs; 2) hidden external failure quality costs:
a. related to loss of customers’ goodwill; b. related to possible loss of lost brand value; c. related to loss of organization’s lost image.
Figure 2. Sources of data of evaluation of external failure quality costs
Vsisible external failure quality costs
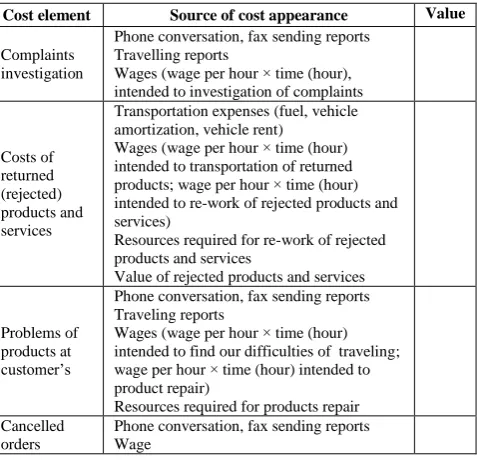
In calculation of visible external failure quality costs due to estimated quality costs elements in organization, firstly the sources of quality costs and their value expression are determined (Table 1). After determining of numeric value of these costs further hidden external quality costs are calculated.
Table 1
Sources of visible external failure quality costs
Cost element Source of cost appearance Value
Complaints investigation
Phone conversation, fax sending reports Travelling reports
Wages (wage per hour × time (hour), intended to investigation of complaints
Costs of returned (rejected) products and services
Transportation expenses (fuel, vehicle amortization, vehicle rent)
Wages (wage per hour × time (hour) intended to transportation of returned products; wage per hour × time (hour) intended to re-work of rejected products and services)
Resources required for re-work of rejected products and services
Value of rejected products and services
Problems of products at customer’s
Phone conversation, fax sending reports Traveling reports
Wages (wage per hour × time (hour) intended to find our difficulties of traveling; wage per hour × time (hour) intended to product repair)
Resources required for products repair Cancelled
orders
Phone conversation, fax sending reports Wage
Cost element Source of cost appearance Value
Resources required for annulment of cancelled orders, collection of cancelled goods and similar
Costs of warranty payments
Wages
Resources required for performance of warranty services
Discounts due to
nonconformin g products and services
Discounts
Fines for breach of ecological and other laws
Fines
Total ∑
Hidden external failure quality costs related to loss of customers’ goodwill
Calculating hidden external failure quality costs related to lost of customers’ goodwill is determined raw weight related to lose of customers’ goodwill (Table 2), which could be expressed as:
i i
i
I
R
RW
(1)where: Ii – weightened importance to requirement i;
Ri – difference between organization and compet-itive organization conformity to requirement;
i – customer requirement, i=1,...k.
ic i
i
P
P
R
(2)where: Pi – organization confomity to requirement I
according the voice of customer;
Pic – competitive organization confomity to requirement i.
Raw weigh shows the probability that poor product or service performance will result in hidden costs. Negative Ri (Ri 0) indicates that the organization’s performance is
better than their competitor and it is expected that loss will not occur even if the customer is dissatisfied and the requirement has a high importance attached to it. Negative values of Ri will not result in a loss (Ri equate to 0). If the
organization’s performance is low compared to the competitor’s, a loss will occur (the difference between organization & competitive organization conformity to requirement i is positive, Ri 0).
When the difference between organization and competitive organization conformity to requirement i is positive and equal to maximum (Ri=Ri,max), then:
max , max
, i i
i
I
R
RW
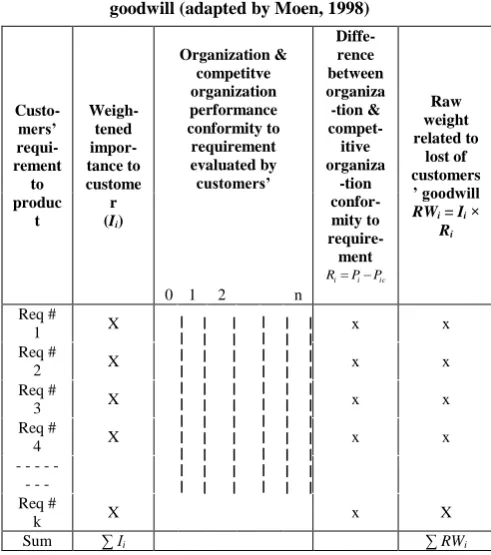
(3) Table 2Calculation of raw weight related to lost of customers’ goodwill (adapted by Moen, 1998)
Custo-mers’ requi-rement to produc t Weigh-tened impor-tance to custome r (Ii)
Organization & competitve organization performance conformity to requirement evaluated by customers’ Diffe-rence between organiza -tion & compet-itive organiza -tion confor-mity to require-ment ic i i P P
R Raw weight related to lost of customers ’ goodwill
RWi = Ii ×
Ri
0 1 2 n
Req #
1 X x x
Req #
2 X x x
Req #
3 X x x
Req #
4 X x x
- - - - - - Req #
k X x X
Sum ∑ Ii ∑ RWi
In order to calculate loss due to unsatisfied customers over the analyzed period (e.g. month) is adapted Jones & Williams (1995) method.
Table 3
Loss due to unsatisfied customers lost (adapted by Jones & Williams, 1995)
Description Value
1 Average value of each sale of good (service) x
2 Average retain profit x
3 Sales during the period selected for analysis x 4 How many customers the organization has x 5 Average periodicity of purchases x 6 Number of satisfied customers
7 Number of unsatisfied customers (U) x 7A Number of unsatisfied customers who are not intended
to buy repeatedly
7B Number of unsatisfied customers who are intented to buy repeatedly
8 Number of purchases of product of satisfied and unsatisfied with intensions to buy customers during analyzed period (line 6 x line 5 + line 7B x line 5)
x
9 Loss of customers’ purchases due to unsatisfying (line
7A x line 5) x
10 Loss of income due to unsatisfied customers (line 9 x
line 2) x
11 Average costs of attraction of new customer x 12 Costs of replacing of unsatisfied customers by others
(line 9 x line 11) x
13 Total loss (line 12 + line 10) (Tloss) x
Table 3 shows the calculation of loss (Tloss) imposed
by the unsatisfied customers.
Having ascertained raw weight related to lost of customers’ goodwill (RWi) (Table 2) and calculated loss
related to lost unsatisfied customers (Tloss) (Table 3), it is
calculated how many hidden external failure quality costs related to the loss of customers’ goodwill due to unsatisfied requirements suffers the organization over the period analyzed (e.g., month).
Loss rate (rloss) is calculated to estimate all hidden
external failure quality costs related with unsatisfied customers requirements Ii, where difference in performance
evaluation is Ri, is maximum:
n i i i loss i loss loss
I
R
T
RW
T
r
1 max , max , (4)Loss rate shows all hidden external failure costs related to all product requirements weightened importance (Ii) (the probability that not meeting each customer
requirement will lead to an intangible loss (Moen, 1998)). Loss (Em) for the unsatisfied customers’ product
(product term covers goods, services, intellectual products, etc., reffering to ISO 9001:2005 Quality management system – fundamentals and vocabulary) requirements over the analyzed period is calculated:
n
i i loss
m
r
RW
E
1
(5)
Having calculated hidden external failure costs related to the loss of customers’ goodwill (e.g., per month) to one product, it is possible to calculate how many hidden external failure quality costs (further HEFQCc), related to
z
m m
c E
HEFQC
1
(6)
where m – number of product (service).
Hidden external failure quality costs related
to possible loss of lost brand value
Calculating hidden external failure costs related to the loss due to brand damage is problematic because of the complexity brand value evaluation methods. For brand valuation it is need to accomplish market research, gather data about competitors and perform forecasting of financial organization results.
According to Cerinkovaite (2011), in order to determine brand value the following brand value measurement models are used:
traditional economical brand value measurement models;
psycho-graphical models and brand value measurement models based on customers’ behaviour;
complex economical models and brand value measurement models based on customers’ behaviour.
In general brand value could be expresed as follow (Damodaran, 2001):
Brand value ={(V/S)b-(V/S)g } x Sales (7)
where: (V/S)b = organization’s market value /sales
value, related to brand;
(V/S)g = organization’s market value /value of main
products sales.
Brand valuation process cover the start and finishing points of the determination of historical costs. In a reference with historical costs tendency, historical costs are expressed as present currency units (Gudaciauskas, 2004). In this way, total brand value shows how much organization should invest today in order to restore the asset. In worst case, hidden external failure costs related to possible loss of lost brand value are equal to present brand value. In other cases, hidden external failure costs related to possible loss of lost brand value are related with loss due to unsatisfied customers lost evaluation method, where external failure costs related to possible loss of lost brand value are changing in proportion to the number of unsatisfied customers.
HEFQCBL = Brand value ={(V/S)b-(V/S)g } x Sales (8)
Having calculated visible external failure quality costs (VEFQC) and hidden external failure costs related to the loss of customers’ goodwill (HEFQCc), loss of brand loss
(HEFQCBL) it is calculated how many external failure
quality costs suffers the organization (EFQC):
BL
EFQC
VEFQC
HEFQC
cHEFQC
(9)Nowadays nobody is questioning that one of the most important factors determining society’s viewpoint towards particular organization, its economical success, is image of the organization. Warren Buffett has told: „It takes 20 years to build a reputation and five minutes to ruin it. If you think about that, you’ll do things differently“.
In their book Davies et al., (2003) state that organization’s image generates 3 to 7.5 percent of annual income every year.
In order to calculate the value of organization’s image and possible loss due to lost image, firstly it is needed to determine its structure that can be composed of image of product and customer, inner image of organization, organization’s culture, staff image and other elements. Every element of organization’s image is influenced by particular factors, influence of which depends on its importance for single individual or their group. Therefore model of value of organization’s image and possible loss related to loss of value should be more complex, covering both elements influencing image of organization and their factors and interrelations, and could become possibilities of further scientific studies.
Results
Using a pilot study, operationalization of the external failure cots was striving at a medical supply service company in Linthuania. For a pilot study, data were gathered from accounting department and customer survey. 114 customers of medical supply service company and 59 customers of competitive organization were participated in the survey. Each hidden external quality costs element was calculated and analyzed over the one reporting month.
Analysis of the organization’s information from accounting system was performed in order to calculate visible external failure costs and answer to the questions: what is average value of service? what is average profit of service? how many services were supplied? how many customers has the organization? what is periodicity of services supplied? etc. The loss related to the possible loss of organization’s image was not analyzed.
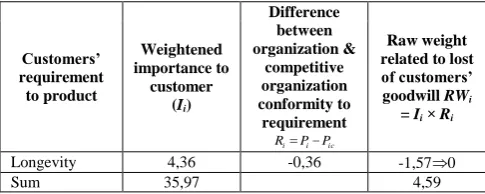
Table 3 gives summary of customers’ survey analysis due to calculate raw weigth related to customers goodwill. Customers were asked to weightened requirements to product using 5 dimensions Likert scale, where 1 – not important, 5 – very important.
Table 3
Calculation of raw weight related to medical supply service company lost of customers’ goodwill
Customers’ requirement to product
Weightened importance to
customer (Ii)
Difference between organization &
competitive organization conformity to requirement
ic i i P P
R
Raw weight related to lost of customers’ goodwill RWi
= Ii × Ri
Confortable
environment 2,89 -0,76 -2,20 0
Attentive staff 3,36 -0,40 -1,34 0 Qualified staff 4,06 -0,67 -2,72 0 A wide range
of services 3,26 -0,60 -1,96 0
Flexible payment system
3,14 0,69 2,17
Convenient
work schedule 3,86 0,03 0,12
Pre-registration 3,30 0,70 2,31 Safe methods
of treatment 4,08 -0,09 -0,37 0
Customers’ requirement to product Weightened importance to customer (Ii)
Difference between organization & competitive organization conformity to requirement ic i i P P
R
Raw weight related to lost of customers’ goodwill RWi
= Ii × Ri
Longevity 4,36 -0,36 -1,57 0
Sum 35,97 4,59
During the study there were calculated hidden external failure quality costs related to the loss of customers’ (Tloss
= 307,56 Lt.), and after determining of raw weight related to lost of customers’ goodwill (RWi = 4,59), there was calculated how many hidden external failure quality costs related to the loss of customers’ goodwill were suffered by the organization. 71 , 1 97 , 35 5 56 , 307 max , i loss loss RW T r Lt RW r E n i i loss
m 1,71 4,59 7,84
1 Lt E HEFQC z m m
c 7,84
1
, when m=1.
In order to calculate the value of the organization brand during the analyzed period there were used cost of capital, expected growth, costs of equity and other charakteristics.
Brand value = {4,39-4,04} x 10104,96= 3536,74 Lt.
During analyzed period 10% of sales were assidned to the brand name value.
Assuming, the worst case, hidden external failure costs related to possible loss of lost brand value were assimilated to calculated brand value.
HEFQCBL = Brand value =3536,74 Lt.
In order to calculate visible external failure costs (VEFQC) (222, 50 Lt.) there were used information from accounting system (table 4).
Visible external failure quality costs were determnined during the complaint analysis, bouncing service costs analysis, canceled orders and guarantee labour costs analysis.
Table 4
The sources of visible external failure costs of medical supply service organization
The elements
of costs The sources of costs
Complaints
Communication expencies
Receptionist‘s salary (hourly wages of complaints analysis × time (6,25 Lt. × 2 h.)).
Reject service costs
Dental hygienist salary (hourly wages of re-work of rejected services × time (12,50 Lt. × 2 h.)). Needed resources (tooth and gum sensivity reducing dental materials)
Canceled service costs
Salary of doctor dentist (hourly wages of production teeth whitening trays × time (19,40 Lt. × 2 h.)) Required resources
Guarantee labour costs
Salary of doctor dentist (hourly wages of re-provision of a service × time (19,40 Lt. × (1h.)) Salary of assistant of dentist (hourly wages × time (6,80 Lt. × 1 h.)).
Required resources (restoration, disinfection, sterilization materials).
Under the pilot study, there was calculated total amount of external failure quality costs elements, which were not directly indicated in the accounting system.
EFQC = VEFQC + HEFQCc + HEFQCBL =
= 222,50 + 7,84 + 3536,74 = 3767,08 Lt.
The reported data showed, that in the wors case scenario, organization could lost 3767,08 Lt. It is about 30 % of analyzed period sales.
Conclusions
This research provides some evidence about evaluation of failure quality costs from viewpoint of hidden costs.
There were analyzed failure quality costs elements: visible external failure quality costs, hidden external failure quality costs related to: the loss of customers’ goodwill, loss of organization’s lost image, loss of lost brand value.
Analyzing external failure costs there were used different quality costs sources. Hidden external failure quality costs related to the loss of customers were counted using matrix of customers’ needs and benefits. Raw weight related to loss of customers’ goodwill shows the impact to losses of organization due nonconformity to customers’ requirements comparing with competitive organizations.
Hidden external failure quality costs related to lost brand value evaluation methodology was based on Damodoran (2001) brand value calculating formula. However during this study there were found some obstacles related to brand value loss quality costs calculation. In this case Damodoran (2001) brand value calculating formula was used to show value of organization’s brand in the analyzed period of time. This case provided to realize that possible quality costs related with brand value loss could be found in a different periods of time. Total amount of brand value loss quality costs in short period of time is pervert total quality costs amount. In real life quality costs related with brand value loss become visible in a long period of time. That’s why organization top management should evaluate probability of the occurrence of such loss over period of time and for the calculation in short period of time for use probability exertion index.
Due to organization image loss quality costs complicated structure and of absence clear methodology how to calculate such loss, in this case there weren’t analyzed image loss quality costs.
Having determined where the biggest sum of quality costs is being formed, the organization undertakes to eliminate efficiently the failures having the biggest economical results.
Having improved the parts of the organization where the highest loss appear, organizations are able to satisfy even the present and predicted needs of the most fastidious customers with high level of quality and flexible price.
Practical application of accounting of hidden quality costs showed that while using methodology of accounting proposed by these costs the organizations have to spare a lot of time and work resources for it. On the other, the received benefit gives a possibility to managers of
organizations to distribute the resources committed to quality improvement rationally and observe tendencies of their change periodically.
References
Albright, T. L., & Roth, H. P. (1992). The Measurement of Quality costs: an Alternative Paradigm. Accounting Horizons, 6(2), 15-27.
Angel, L. C., & Chandra, M. J. (2001). Performance Implications of Investments in Continuous Quality Improvement. International Journal of Operations & Production Management, 21(1/2), 108-125. http://dx.doi.org/10.1108 /01443570110358486
AS 2561-1982 (1982). Guide to the Determination and Use of Quality Costs. Australian Standard. AS 2561-2010 (2010). Guide to the Determination and Use of Quality Costs. Australian Standard. ASQC (1971). Quality Costs, What and How? (2nd ed.). Milwaukee, WI: ASQC Quality Press.
Bamford, D. R., & Land, N. (2006). The Application and Use of the PAF Quality Costing Model Within a Footwear Company. International Journal of Quality & Reliability Management, 23(3), 265-278. http://dx.doi.org/10. 1108/02656710610648224
Bottorff, D. (1997). COQ Systems: the Right Stuff. Quality Progress, 30(3), 33-35.
BS 6143 Part 2 (1990). Guide to Determination and Use of Quality-Related Costs. London: BSI.
Burns, C. R. (1976). Quality Costing Used as a tool For Cost Reduction if the Machine-Tool Industry. Quality Assurance, 2(1), 25-32.
Campanella, J. (1999). Principles of Quality Costs: Principles, Implementation and Use. ASQ Quality Press. Carr, L. P. (1995). How Xerox Sustains the Cost of Quality. Management Accounting, 76 (2), 26-32.
Carr, L.P. (1992). Applying Cost of Quality to a Service Business. Sloan Management Review, Summer, 71-77. Cerinkovaite, M. E. (2011). Prekes zenklo vertes matavimo modeliai. Socialiniu mokslu studijos, 3(3), 967-981.
Chen, C. C., & Yang, C. C. (2002). Cost-Effectiveness Based Performance Evaluation for Suppliers and Operations. Quality Management Journal, 9(4), 59-73.
Chiadamrong, N. (2003). The Development of an Economic Quality Cost Model. Total Quality Management & Business Excellence, 14(9), 999-1014. http://dx.doi.org/10.1080/1478336032000090914
Cooper, R., & Kaplan, R. S. (1988). Measure Costs Right: Make the Right Decisions. Harvard Business Review, September-October, 96-103.
Cooper, R. (1988). The Rise of Activity-Based Costing – Part I: What is an Activity-Based Cost System? Journal of Cost Management, 2(2), 45-54.
Crosby, P. B. (1979). Quality is free. New York: McGraw-Hill.
Dahlgaard, J. J., Kristensen, K., & Kanji, G. K. (1992). Quality Costs and Total Quality Management. Total Quality Management, 3, 211-221.http://dx.doi.org/10.1080/09544129200000029
Dale, B. G., & Wan, G. M. (2002). Setting up a Quality Costing System: an Evaluation of the Key Issues. Business Process Management Journal, 8(2), 104-116. http://dx.doi.org/10.1108/14637150210425081
Damodaran, A. (2001). Corporate Finance: Theory and Practice. France: Wiley Series.
Davies, G., Chun, R., Da Silva, R. V., & Roper, S. (2003). Corporate Reputation and Competitiveness. Routledge, London, UK.
Deming, W. E. (1986). Out of crisis. Cambridge: MA, MIT, Centre of Advanced Engineering Study.
Evans, J., & Lindsay, W. (2005). The Management and Control of Quality. Mason: Thomson/South – Western. Feigenbaum, A. V. (1956). Total quality control. Harvard Business Review, 34, 93-101.
Feigenbaum, A. V. (1961). Total quality control. New York: McGraw-Hill.
Fine, C. H., & Charles, H. (1986). Quality Improvement and Learning in Productive Systems. Management Science, 32(10), 1301-1315. http://dx.doi.org/10.1287/mnsc.32.10.1301
Freiesleben, J. (2005). The Economic Effects of Quality Improvement. Total Quality Management, 16(7), 915-922. http://dx.doi.org/10.1080/14783360500077419
Goodstadt, P., & Marti, R. (1990). Quality Service at National Westminster Bank: the Continual Striving for Excellence. International Journal of Quality & Reliability Management, 7(4), 19-28. http://dx.doi.org/10.1108/02656719 010138812
Gudaciauskas, D. (2004). Prekes zenklo kaip nematerialaus turto vertinimas (Doctoral thesis).
Harry, M. J., & Schroeder, R. (2000). Six Sigma: The Breakthrough Management Strategy Revolutionizing the World’S top Corporations. New York: Doubleday, Random House.
Heagy, C. D. (1991). Determining Optional Quality Costs by Considering Costs of Lost Sales. Journal of Cost Management for the Manufacturing Industry, Fall, 64-72.
Hwang, G. H., & Aspinwall, E. M. (1996). Quality Cost Models and Their Application: a Review. Total Quality Management, 7(3), 267-281. http://dx.doi.org/10.1080/09544129650034837
ISO 9001:2005. Quality Management System – Fundamentals and Vocabulary. International Standardization Organization.
Jones, P., & Williams, T. (1995). Business Improvement Made Simple. Information Press.
Juran, J. M., & Gryna, F. M. (1988). Quality Control Handbook (4 ed.). New York: McGraw-Hill. Juran, J. M. (1951). Juran‘s Quality Control Handbook. New York: McGraw-Hill.
Kaynama, S. A., & Black, Ch. I. (2000). A Proposal to Assess the Service Quality of Online Travel Agencies: an Exploratory Study. Journal of Professional Services Marketing, 21(1), 63-88.
Kim, M. W., & Liao, W. M. (1994). Estimating Hidden Quality Costs with Quality Loss Functions. Accounting Horizons, 8(1), 8-18.
Krishnan, S. K. (2006). Increasing the Visibility of Hidden Failure Costs. Measuring Business Excellence, 10(4), 77-101. http://dx.doi.org/10.1108/13683040610719290
Krishnan, S. K., Agus, A., & Husain, N. (2000). Cost of Quality: the Hidden Costs. Total Quality Management, 11(4), 844-848. http://dx.doi.org/10.1080/09544120050008309
Love, P.E.D. & Irani, Z. (2003). A Project Management Quality Cost Information System for the Construction Industry. Information & Management, 40, 649-661. http://dx.doi.org/10.1016/S0378-7206(02)00094-0
Machowski, F., & Dale, B. G. (1998). Quality Costing: an Examination of Knowledge, Attitudes and Perceptions. Quality Management Journal, 5(3), 84-95.
Malchi, G., & McGurk, H. (2001). Increasing Value Through the Measurement of the Cost of Quality (CoQ) – a Practical Approach. Pharmaceutical Engineering, 21(3), 92.
Margavio, G. W., Fink, R. L., & Margavio, T. M. (1994). Quality Improvement Using Capital Budgeting and Taguchi’s Function. International Journal of Quality & Reliability Management, 11(6), 10-20. http://dx.doi.org/10.1108/02 656719410064612
Marsh, J. (1989). Process Modelling for Quality Improvement. Proceedings of the Second International Conference on Total Quality Management, 111.
Modarress, B., & Ansari, A. (1987). Two New Dimensions in the Cost of Ouality. International Journal of Quality & Reliability Management, 4(4), 9-19. http://dx.doi.org/10.1108/eb002886
Moen, M. (1998). New Quality Cost Model used as a Top Management Tool. The TQM Magazine, 5, 334-341. http://dx.doi.org/10.1108/09544789810231216
Mukhopadhyay, A. R. (2004). Estimation of Cost of Quality in an Indian Textile Industry for Reducing Cost of Non-Conformance. Total Quality Management & Business Excellence, 12(2), 229-234. http://dx.doi.org/10.1080/ 1478336032000149054
Plunkett, J. J., & Dale, B. B. (1986). Quality Costing: a Summary of Research Findings. Quality Assurance, 12(2), 40-43. Plunkett, J. J., & Dale, B. G. (1987). A Review of the Literature on Quality-Related Costs. International Journal of
Quality & Reliability Management, 4(1), 40-43. http://dx.doi.org/10.1108/eb002874
Porter, L. J., & Rayner, P. (1992). Quality Costing for Total Quality Management. Institutional Journal of Production Economics, 27(1), 69-81. http://dx.doi.org/10.1016/0925-5273(92)90127-S
Prickett, T. W., & Rapley, C. W. (2001). Quality Costing: A Study of Manufacturing Organizations. Part 2: Main Survey. Total Quality Management, 12(2),211-222. http://dx.doi.org/10.1080/09544120120011433
Ross, D. T. (1977). Structured Analysis (SA): a Language for Communicating Ideas. IEEE Transactions on Software Engineering, SE-3(10), 16. http://dx.doi.org/10.1109/TSE.1977.229900
Schiffauerova, A., & Thomson, V. (2006a). A Review of Research on Cost of Quality Models and Best Practices. International Journal of Quality & Reliability Management, 23(6), 647-669. http://dx.doi.org/10.1108/026567 10610672470
Schiffauerova, A., & Thomson, V. (2006b). Managing Cost of Quality: Insight Into Industry Practice. The TQM Magazine, 18(5), 542-550. http://dx.doi.org/10.1108/09544780610685502
Sharma, R., Kumar, D., & Kumar, P. (2007). A Framework to Implement QCS Through Process Cost Modelling. The TQM Magazine, 1, 18-36. http://dx.doi.org/10.1108/09544780710720817
Sower, V. E. (2004). Estimating External Failure Costs: a Key Difficulty in COQ Systems. Annual Quality Congress Proceedings. Toronto.
Sower, V. E., Quarles, R., & Broussard, E. (2007).Cost of Quality Usage and its Relationship to Quality System Maturity. International Journal of Quality & Reliability Management, 24(2), 121-140. http://dx.doi.org/10.1108/02656710 710722257
Srivastava, S. K. (2008). Towards Estimating Cost of Quality in Supply Chains. Total Quality Management & Business Excellence, 19(3),193–208. http://dx.doi.org/10.1080/14783360701600605
Summers, D. (2000). Quality. Columbus: Prentice Hall.
Superville, C. R., Jones, S. F., & Boyd, J. L. (2003). Quality Costing: Modelling with Suggestions for Managers. International Journal of Management, 20, 346-352.
Tannock, J., & Saelem, S. (2007). Manufacturing Disruption Costs due to Quality Loss. International Journal of Quality & Reliability Management, 24(3), 263 – 278. http://dx.doi.org/10.1108/02656710710730861
Tatikonda, L. U., & Tatikonda, R.J. (1996). Measuring and Reporting the Cost of Quality. Production & Inventory Management Journal, 37(2), 1-7.
Tsai, W. H., & Hsu, W. (2010). A Novel Hybrid Model Based on DEMATEL and ANP for Selecting Cost of Quality Model Development. Total Quality Management & Business Excellence, 21(4), 439-456. http://dx.doi.org/10. 1080/14783361003606852
Tsai, W. H. (1998). Quality Cost Measurement Under Activity-Based Costing. International Journal of Quality & Reliability Management, 15(7), 719-732. http://dx.doi.org/10.1108/02656719810218202
Viger, C., & Anandarajan, A. (1999). Cost Management and Pricing Decisions in the Presence of Quality cost Information: an Experimental study with marketing managers. Journal of Cost Management, (January/February), 21-27.
Wu, H. Y, Chien, F. L., Lin, Y. J., & Yang, S. F. (2011). Analysis of Critical Factors Affecting the Quality cost of Process Management of Six Sigma Project Based on BSC. International Research Journal of Finance and Economics, 71, 93-104.
Yang, Ch. Ch. (2008). Improving the Definition and Quantification of Quality Costs. Total Quality Management & Business Excellence, 19(3), 175-191. http://dx.doi.org/10.1080/14783360701600563
Vytautas Snieška, Asta Daunorienė, Alma Žekevičienė
Neatitikties kokybės kaštų vertinimas neišreikštų kaštų požiūriu
Santrauka
Organizacijos, norėdamos priimti tinkamiausius sprendimus, leidžiančius šiandieninėje rinkoje įgyti konkurencinį pranašumą, turi vertinti išorinius neatitikties kokybės kaštus. Kokybės vadybos specialistai nustatė, kad kokybės kaštai sudaro didelę dalį (apie 30 %) bendrų gamybos kaštų (Srivastava, 2008).
Daugelis autorių (Juran, 1951; Crosby, 1979; Heagy, 1991; Tsai, 1998; Moen, 1998; Malchi, McGurk, 2001; Tannock, Saelem, 2007; Sower, Quarles ir Broussard, 2007) teigia, kad apskaičiuoti, suprasti ir valdyti kokybės kaštus yra naudinga, nes organizacija gali matyti, kokios sritys yra tobulintinos ir kokią įtaką galutiniams organizacijos rezultatams turi prasta kokybė. Prickett ir Rapley (2001) pabrėžia šiuos kokybės kaštų apskaitos privalumus: identifikuojamos prastos kokybės sritys, kurias reikia tobulinti, stebimas tobulinimo veiklos procesas (monitoringas), planuojama kaip pagerinti kokybę, nes kontroliuojant kokybę kartu pagerėja komunikacija organizacijos viduje.
Šiuo metu, pasaulinėje praktikoje, kokybės kaštai dažniausiai skirstomi į tris svarbiausias kokybės kaštų kategorijas: prevencijos, įvertinimo ir neatitikties (išskiriant vidinius ir išorinius) kaštus (Sharma ir Kumar, 2007; Sower, Quarles ir Broussard, 2007; Schiffauerova ir Thomson, 2006a; Tannock ir Saelem, 2005; Angell ir Chandra, 2001). Kokybės kaštai vertinami remiantis keturiais pagrindiniais kokybės kaštų apskaitos modeliais: P-A-F arba „Crosby“ modeliu (Feigenbaum, 1956), galimybių kaštų modeliu (Sandoval-Chavez ir Beruvides, 1998); Modarress ir Ansari, 1987), proceso kaštų modeliu (Ross, 1977; Marsh, 1989) ir ABC (veikla pagrįstų kaštų) modelis (Cooper, 1988; Cooper ir Kaplan, 1988), kurių praktinis pasirinkimas priklauso nuo organizacijos esamos būklės, jos aplinkos, tikslų ir poreikių (Schiffauerova ir Thomson, 2006a; Schiffauerova ir Thomson, 2006b; Tsai ir Hsu, 2010).
Kaip teigia Yang (2008), viena iš svarbiausių efektyvios kokybės kaštų apskaitos sistemos sąlygų - nustatyti visus kokybės kaštų elementus. Bamford ir Land (2006) pabrėžia, kad kokybės kaštų apskaita gali būti sėkmingu vadybos įrankiu tik tuomet, kai surenkami visi kokybės kaštų duomenys.
Tatikonda ir Tatikonda, 1996), nes juos sunku nustatyti, išmatuoti ir įvertinti skaičiais (Moen, 1998). Tačiau šių kaštų negalima nepastebėti ar ignoruoti. Summers (2000) teigia, kad net jeigu neišreikšti neatitikties kokybės kaštai gali būti tik įvardinti, bet neįvertinti kiekybiškai, organizacijai apie juos žinoti taip pat yra svarbu ir naudinga.
Pasaulyje išoriniai neatitikties kokybės kaštai nagrinėti daugelio mokslininkų (Feigenbaum, 1956, 1961; Crosby, 1979, 1996; Juran, 1951; Malchi, McGurk ir kt., 2001) bei įvertinami daugelyje pasaulio organizacijų. Skirtingi autoriai prie neišreikštų išorinių kokybės kaštų priskiria skirtingus kaštus, kurie savo esme yra labai panašūs. Campanella (1999) bei Summers (2000), prie neišreikštų išorinių neatitikties kokybės kaštų priskiria vartotojų palankumo praradimą, organizacijos įvaizdžio praradimą, prarastus pardavimus. Modarress ir Ansari (1987) neišreikštais išoriniais neatitikties kokybės kaštais laiko vartotojų palankumo praradimo kaštus. Evans ir Lindsay (2005), Albright ir Roth (1992), nagrinėdami neišreikštus išorinius neatitikties kokybės kaštus akcentuoja reputacijos ir įvaizdžio svarbą, nes nuo jų priklauso ateities perspektyvos ir pardavimai. Neišreikšti išoriniai neatitikties kokybės kaštai yra susiejami su nematerialiomis vertėmis, kaip pavyzdžiui, organizacijos reputacija, vartotojų poreikiais. Tsai (1998) prie neišreikštų išorinių neatitikties kokybės kaštų priskiria kaštus dėl prarasto įvaizdžio ir prarastų pardavimų. Krishnan, Agus ir Husain (2000) paskaičiavo neproduktyvaus darbo laiko nuostolius. Kaynama ir Black (2000) nuomone neišreikštus išorinius neatitikties kokybės kaštus sudaro kaštai dėl prarasto organizacijos įvaizdžio, nepatenkintų, susierzinusių vartotojų, prarastų pardavimų ir nuostoliai dėl teismo ieškinių. Schiffauerova ir Thomson (2006a) mano, kad neišreikšti išoriniai neatitikties kokybės kaštai - tai kaštai, kurie gali būti apskaičiuojami kaip neuždirbtos pajamos. Srivastava (2008) neišreikštais kokybės kaštais laiko esamų pardavimų praradimus (plg. angl. lost current sales), būsimų pardavimų praradimus (plg. angl. lost future sales) ir visuomenės praradimus (plg. angl. loss of society).
Tačiau mokslinėje literatūroje nėra metodikos, leidžiančios apskaičiuoti visus išorinius neatitikties kokybės kaštus. Svarbu suformuoti metodiką, kuri leistų įvertinti visus išorinius neatitikties kokybės kaštus. Straipsnyje analizuojama mokslinė problema formuluojama klausimu: kaip integruotai įvertinti išorinius neatitikties kokybės kaštus, kuriuos sudaro akivaizdūs neatitikties kokybės kaštai ir neišreikšti neatitikties kokybės kaštai?
Tyrimo tikslas – sudaryti išorinių neatitikties kokybės kaštų vertinimo metodiką. Tyrimo objektas – išoriniai neatitikties kokybės kaštai.
Tyrimo metodologiją sudaro teorinis metodikos pagrindimas mokslinės literatūros analizės pagrindu ir empirinio tyrimo, atlikto Lietuvos organizacijoje, rezultatai. Lietuvos įmonėse nėra praktikos apskaičiuoti kokybės kaštus, todėl išorinių neatitikties kaštų testavimas itin aktualus šalies mastu.
Empiriniame tyrime visi išoriniai neatitikties kokybės kaštai suskirstyti į dvi dalis, t. y. į: 1) akivaizdžius išorinius neatitikties kokybės kaštus (plg. angl. tangible, visible);
2) neišreikštus išorinius neatitikties kokybės kaštus (plg. angl. hidden, intangible, invisible): susijusius su vartotojų palankumo praradimu; su galimais prekės ženklo vertės praradimo nuostoliais; su organizacijos įvaizdžio praradimo nuostoliais.
Apskaičiuojant akivaizdžius išorinius neatitikties kokybės kaštus, pirmiausia yra nustatyti kokybės kaštų šaltiniai ir jų vertės išraiška. Nustačius šių kaštų skaitinę vertę, toliau apskaičiuojami neišreikšti išoriniai kokybės kaštai. Neišreikštiems išoriniams neatitikties kokybės kaštams, susijusiems su vartotojo palankumu apskaičiuoti, panaudotos vartotojų poreikių ir naudos bei modifikuotos planavimo matricos (Moen, 1998). Vartotojų poreikių matricos sudarymas teikia organizacijai dvigubą naudą:
1) paskaičiuojamas kokybės kaštų indeksas kiekvienam vartotojų poreikiui; 2) paskaičiuojamas vartotojų pasitenkinimo lygis.
Neišreikšti išoriniai neatitikties kokybės kaštai, susiję su galimais prekės ženklo vertės praradimo nuostoliais, buvo matuojami pagal Damodaran (2001) prekės ženklo vertės apskaičiavimo formulę. Tačiau tyrimo metu išryškėjo, kad galimi nuostoliai, dėl žalos prekės ženklui, gali pasireikšti skirtingose organizacijose skirtingu laiku, pvz., gali nepasireikšti visą mėnesį, bet gali pasireikšti per pusę metų ar per metus).
Norint apskaičiuoti organizacijos įvaizdžio vertę ir galimus nuostolius dėl įvaizdžio praradimo, pirmiausia nustatoma jo struktūra, kurią gali sudaryti produkto ir vartotojo įvaizdžio, vidinio organizacijos įvaizdžio, organizacijos kultūros, personalo įvaizdžio ir kiti elementai. Dėl organizacijos įvaizdžio praradimo nuostolių struktūros sudėtingumo ir dėl tokių nuostolių aiškios skaičiavimo metodikos nebuvimo, įvaizdžio praradimo, nuostoliai šiame straipsnyje neanalizuojami.
Neišreikštų kokybės kaštų apskaitos praktinis pritaikymas parodė, kad taikant šių kaštų pasiūlytą apskaitos metodiką, organizacijos turi tam skirti nemažai laiko ir darbo sąnaudų. Kita vertus, gaunama nauda suteikia galimybę organizacijos vadovams racionaliai paskirstyti kokybei gerinti skirtas lėšas ir periodiškai stebėti jų kaitos tendencijas.
Aktualus klausimas išlieka sprendžiant kokybės kaštų apskaitos periodiškumą. Todėl racionaliai planuojant kokybės kaštų apskaitą, organizacijoms tektų nustatyti tam tikrus matus, kuriais būtų galima pateikti apytikslią tam tikrų kokybės kaštų elementų vertę.
Dar lieka nenagrinėtas klausimas, susijęs su darbuotojų galimybėmis manipuliuoti kokybės kaštų vertės išraiška. Jis galėtų tapti kokybės kaštų tyrimų diskursu.
Raktažodžiai: išoriniai neatitikties kokybės kaštai, neišreikštų neatitikties kokybės kaštų vertinimas, vartotojų palankumo praradimo kaštai, įvaizdžio praradimo kaštai, kokybės kaštų apskaitos modeliai.
The article has been reviewed.