PERCEPTION OF COMMUNICATION NETWORK
FRAUD DYNAMICS BY NETWORK
ADMINISTRATORS AND STAKEHOLDERS
I.F.C. Onaha,H.C. Inyiamab
Department of Computer Engineering, Enugu State University of Science & Technology, Enugu, Nigeria.
a
(Email: [email protected]) b
Present address: Department of Electronics and Computer Engineering, Nnamdi Azikiwe University, Awka, Anambra State.
Abstract
The massive growth of electronic commerce represent a new set of vulnerabilities aimed at the distortion, disruption, and destruction of the global and national information infrastructures, and are indeed significant threats to the integrity of networked systems. This paper investigates the perception of communication net-work fraud dynamics by netnet-work administrators and stakeholders. In considering the implications of the varied nature of the potential targets, the paper identifies the view to develop effective intelligence analysis methodologies for network fraud detection and prevention by network administrators and stakeholders. The paper further notes that organizations are fighting an increasingly complex battle for higher stakeholders, and thus require a greater, enterprise-wide understanding of the threats they face, across all operations and in all territories. In order to es-tablish the appropriateness of the audience, this paper presents an analysis of the interview randomly administered. Informed opinion about the perception index of network administrators and stakeholders is analyzed.
Keywords: fraud dynamics, perception index, quantitative analysis
1. Introduction
As societies become more dependent upon linked communication and information sys-tems the possibility that these syssys-tems will be compromised or disrupted becomes more salient, and the resulting consequences more serious. In spite of some well-publicized and extremely costly incidents of vulnerabilities, there remains a remarkable level of compla-cency on the part of administrators and stake-holders [1]. Results from the annual Com-puter Security Institute and United States
parts of Africa might have been the victims of cyber crime within the last two years. How-ever, two-thirds of the companies interviewed noted that nothing had changed since the in-trusions, while 30 percent did not see protec-tion of business informaprotec-tion to be a priority.
The risks inherent in information systems is changing as fast as new technologies are brought online. The multitude of systems and methodologies in place duplicate effort, rein-force divisional structures and are unable to share and cross-reference information. These create barriers to financial crime management and hinder the successful detection of todays organized criminal. They drive up operational costs and total cost of ownership through du-plication of effort, inefficient processes and multiple support and maintenance costs.
It is worthy of note that this “democrati-zation of high technology” has been accom-panied by a new form of individual empower-ment. The positive side of this is the growth of computer literacy; the negative is the emergence of the hacker/cracker sub-culture. Hackers/crackers are occasionally vulnerable to recruitment by criminal or terrorist orga-nizations and “there is a real danger that a Global Dictator could emerge and begin to make a deadly and perverted use of” the na-tional and global information infrastructures [4]. But rather than exploding a bomb in front of a government office or corporate headquar-ters, however, the weapon of choice will be a computer program that will do far more dam-age and affect far more lives.
In this dispensation, skilled individuals or groups residing anywhere within the Global Information Infrastructures (GII) can develop new potential information warfare weapons. This advent of computer warfare has the po-tential to significantly change the balance of power in a world increasingly dependent on sophisticated technologies. This will give na-tions that would never consider themselves players in the arena of global power strate-gies a new place in a different kind of world. In such a world of Information Warfare,
tech-nological capability, rather than the size of ki-netic weapons arsenals or standing armies, is the primary factor in determining the balance of power. Any sort of malicious operation against a network may lead to wide-ranging unintended effects [1].
2. 1.0 Review of related Works
One person with a computer, a modem and the requisite knowledge and skills has the ca-pacity to wreak considerable havoc. The “I love you” virus, for example, caused an esti-mated 6.7 billion in damages in the first 5 days [5]. The costs were so diffused among business, government, and educational insti-tutions as well as individual computer users. The potential targets are so diverse, cover-ing local, regional, national or transnational boundaries. Among the dimensions that could all too easily be compromised are:
! Public disclosures about classified infor-mation that could compromise national security.
! Denial of service attacks which cause enormous backlogs in communications and interfere with transactions in both business and government.
! Attacks on information, called informa-tion tampering, which can affect the im-plementation of missions of government agencies and departments or businesses.
! Breaches of security in financial trans-actions (e-commerce) by criminals, ter-rorists, unhappy customers or bored teenagers.
! Damage or disruption to National Infras-tructures - communications, transporta-tion, power grids, etc. which could have enormous cultural and economical conse-quences.
Cyber-space is a wonderful domain for the propagation of ”memetic viruses” [1]. The nature of fraud is changing dynamically because todays criminals:
attack globally, not locally
are organized and systematic, not ran-dom and opportunistic
infiltrate systems rather than people or places
erode profits through persistent high vol-ume attacks
Today, the multitude of systems and methodologies in place create barriers that put the business at risk in several key areas:
increased exposure to unpredictable fi-nancial losses
increased risk of exposure to sanctions
escalating operational costs
reduced productivity of investigative re-sources
The problem of fraud detection is to dis-cover dishonest intention of the customer, which clearly cannot be directly observed. The intentions of the customers are reflected in the transaction behaviour and thus in the observed transaction data. Gathering nor-mal transaction data is relatively easy as this mode dominates the population. But collect-ing fraudulent transaction data is more prob-lematic because it is relatively rare. Data col-lection involving human labour is expensive. The processing and storing of data is also sub-ject to restrictions due to legislation on pri-vacy of data.
3. Methodology
The study was conducted in Enugu metropolis, capital of Enugu State of Nige-ria. The selection of the study area was influ-enced by the sufficient availability of network
resources, and vibrant individuals knowledge-able on the concept, universality and poten-tial danger of network related frauds. Opin-ions of stakeholders and data communication operators were gathered from both Primary and Secondary sources. Primary data were gathered from the field through the use of questionnaires, observations, discussions and interviews while secondary data were gath-ered from secondary sources such as books, journals and internet sources; among others. The types of primary data collected include characteristics of stakeholders and operators in Enugu, network fraud dynamics, fraud de-tection techniques in place, changing patterns of fraudsters, in the study area, among oth-ers. Examples of secondary data collected in-clude age distribution, educational qualifica-tions, and assessment of levels of respondents, among others.
Please tick (√) to one which is applicable to you.
1. Sex: (a) Male ( ) (b) Female ( )
2. Age: (a) 25 - 30 ( ) (b) 31 - 35 ( ) (c) 36 - 40 ( ) (d) Above 40 ( ) 3. Religion: (a) Christian ( ) (b) Moslem ( ) (c) Traditional ( )
4. Marital Status: (a) Single ( ) (b) Married ( )
5. Qualification: (a) WASC/GCE ( ) (b) NCE/OND ( ) (c) HND/B.Sc ( ) (d) M.Sc/MBA/PhD ( ) (e) Professional Cert. ( )
Table 1: Sample Questionnaire.
S/N Test Questions Strongly Agree Agree Neutral Disagree Strongly Disagree
6. The existence of computer network re-lated frauds is real.
7. Fraudsters in networked systems are constantly changing their tactics to avoid detection.
8. Every subscriber of an online service is a potential fraudster.
9. Security and privacy of network systems should be the concern of government at all levels.
10. Adoption and implementation of effi-cient fraud detection and analysis sys-tems will curb the nefarious attitude of fraudsters.
11. Do you browse the Internet? Yes ( ) or No ( )
12. Have you ever engaged in any form of online business transactions? Yes ( ) or No ( )
13. Are you aware that information resources maintained in computer network infrastructures are plagued by various network frauds? Yes ( ) or No ( )
14. Have you ever participated in any seminar, training or workshop on online commerce? Yes ( ) or No ( ) 15. Any other comments please state below.
. . . . . . . . . . . .
3.1. Screening Questions
4. Analysis of the Perception Index
Quantitative method was used to process and analyze raw data for the purpose of gath-ering informed opinion about communication network fraud.
4.1. Questionnaire analysis
In our research problem, answer options are classified into five mutually-exclusive cat-egories namely: Strongly Agree, Agree, Neu-tral, Disagree, and Strongly Disagree. The de-pendent variable – Quest/Rank – is classified into the various research questions. With this information, the frequency distribution of an-swer options for 90 questionnaire respondents was designed.
4.1.1. Collating respondents returns
Respondents returns are arranged in a fre-quency distribution to present the data in a more manageable and comprehensible form.
Table 2: Age distribution of respondents.
Age of Respon-dents
No. of Respon-dents
Percentages
25-30 10 11.11%
31-35 26 28.89%
36-40 34 37.78%
Above 40 20 22.22%
Total 90 100
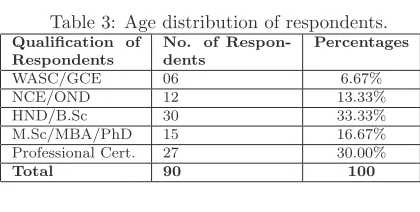
Table 3: Age distribution of respondents.
Qualification of Respondents
No. of Respon-dents
Percentages
WASC/GCE 06 6.67%
NCE/OND 12 13.33%
HND/B.Sc 30 33.33%
M.Sc/MBA/PhD 15 16.67% Professional Cert. 27 30.00%
Total 90 100
The ages of the respondents are shown in Table 2.
The analysis in the table above indicates that the respondents are vibrant, matured in-dividuals who understand the impact of fraud in organizations and businesses.
The above analysis indicates that the re-spondents have adequate and relevant educa-tional qualification to understand the concept and universality of the research topic.
4.1.2. Evaluation Procedures
Statistical inference is drawn from data pre-sented by the frequency distributions (Tables 4, 6 and 8) so that one can use the findings from this sample population to generalize on perception of operators and stakeholders.
STEP 1: Set up the Hypothesis - some
testable belief or opinion which aims to test statistically the more likely of two possibili-ties. Two hypotheses for the statistical testing are:
a) Null Hypothesis, designated as H0, in which there is no assumption of contradic-tion between the supposed mean and the sample mean and any difference can be as-cribed solely to random factors.
b) Alternative Hypothesis, designated as H1, in which there are differences between two or more measures, for example, the sample mean and the population mean.
It is likely that the information gleaned from a sample data taken to test some Hypoth-esis (e.g., the sample (population) mean or standard deviation) does not completely sup-port the Hypothesis due to either the original Hypothesis being wrong or the sample being slightly unrepresentative (which virtually all samples will be to a greater or lesser extent). The process of testing the probability that observed differences are due to chance in or-der to accept or reject the Hypothesis is re-ferred to as a test of significance. The differ-ence “not due to chance” values are termed statistically significant values. The difference “due to chance” values are known as statisti-cally nonsignificant values [8].
When the value of a given difference be-tween two or more measures falls into the non-significant difference region, the null Hypoth-esis is said to have been retained. But when the difference falls into the significant differ-ence region, the null Hypothesis is said to have
been rejected.
Both tails of the distribution of sample means (H0and H1) shall be used and this is thus called a two tail test of significance. The null Hypothesis is symbolized by H0 and the alternative hypotheses are symbolized by H1,H2,H3, etc. The null Hypothesis is the one which is tested. If H0 is accepted, H1 is rejected whilst if H0 is found to be false, H1is accepted.
Our two tail test is stated as follows: H0: f0= fe - Mean of A = Mean of B H1: f0>fe - Mean of A 6= Mean of B The null Hypothesis is seen as the logi-cal opposite of the alternate Hypothesis. So, where the null is rejected the alternative is automatically accepted through logical impli-cation.
The following three hypotheses are formu-lated for the purpose of the test:
Test of Hypothesis 1
H0: The existence of computer network frauds is real.
H1: The existence of computer network frauds is not real.
Test of Hypothesis 2
H0: Adoption and implementation of efficient fraud detection and analysis systems will curb the nefarious attitude of fraudsters. H1: Adoption and implementation of efficient fraud detection and analysis systems will not curb the nefarious attitude of fraudsters.
Test of Hypothesis 3
H0: Efficient, dynamic and adaptive fraud detection techniques will give service opera-tors a competitive edge in terms of customer care and retention, marketing and revenue assurance.
H1: Efficient, dynamic and adaptive fraud detection techniques will not give service operators a competitive edge in terms of customer care and retention, marketing and revenue assurance.
STEP 2: Sampling Statistic
research parameters. Some of them include the regression analysis, the Chi-square, Cor-relation analysis, the students t-test and z-test, the f-z-test, the significance of percentages, the standard error of percentages, the stan-dard deviation, the probability test, and the Wilcoxon [8] two-sample test, etc.
Being quantitative data, the Chi-Square test of independence will be used in this anal-ysis. The reason for the choice of Chi-Square, symbolized by X2, as the statistical measure is that X2 has a theoretical sampling distri-bution which permits us to address research problems involving frequencies where the vari-ables have been classified into two or more mu-tually exclusive categories. TheX2is most of-ten used in evaluating research data reported in frequencies, such as proportions and per-centages. It is one of the best statistical meth-ods available for us for comparing observed frequencies against expected frequencies [8].
This is quite unlike proportion statistics where there are only two categories, for clas-sifying observations such as yes – no, agree – disagree, etc. The sampling statistic for test-ing the feasibility of the null Hypothesis under the Chi-Square is defined by the formula:
X2 =X(fo−fe)2/fe (1)
wherefo= Observed frequencies in a category (Generated from sample data);fe= Expected frequencies in the same category (provided by population parameters); P = Sum this ratio over all columns and rows.
The sampling distribution of the Chi-square is a function of the associated degrees of free-dom (df). In Chi-square, the df is based on the number of categories symbolized by K. For example, to rate five colours of a sam-ple textile, the variable is Colour and it is di-vided into five categories of different colours (K = 5). Thus the df under this condition is K−1 = 5−1 = 4. The Critical values for Chi-Square for various significance levels are presented in a Chi-Square table.
STEP 3: State the significance level and
define the rejection region(s) as appropriate.
Significance level must be chosen before the test is carried out, and it is a critical fac-tor in deciding whether to accept or reject a Hypothesis. This is why the term ’Signif-icance testing’ is commonly used instead of Hypothesis testing. It cannot be said with 100% certainty that a difference is significant since samples and random factors are being handled. Accordingly, various levels of signif-icance are chosen, most commonly 5% or 1%, and thus the result of a particular test might be expressed as follows:
’The difference between the sample mean and the hypothetical population mean is sig-nificant at the 5% level’.
Or,
’There is a 95% confidence that the differ-ence between the sample mean and the popu-lation mean is not due to chance factors.’
The score for a two tailed test at the 5% level is 1.96.
The significance level is set at .05, two tailed. The above three hypotheses will be tested at 5% level of significance with (r − 1)(c−1) degree of freedom. If x2 calculated is greater thanx2 tabulated, the null Hypoth-esis (H0) is rejected; else the null Hypothesis is accepted.
A total of 100 questionnaires were randomly distributed to the respondents out of which 90 were returned with responses.
STEP 4: Compute sample statistics and
draw conclusions based on your findings. The expected frequencies for each cell were determined and the general X2 formula was then applied.
4.1.3. Test of Hypothesis 1
H0: The existence of computer network frauds is real.
H1: The existence of computer network frauds is not real.
Table 4: The Existence of data communication frauds is real and constitutes a major problem to the data communications industry.
Quest/ Rank
Strongly agree
Agree Neutral Disagree Strongly Dis-agree
Row total (Ri)
1 40(40) 35(40) 15(10) 0(0) 0(0) 90 2 40(40) 45(40) 5(10) 0(0) 0(0) 90
Column Total (Cj)
80 80 20 0 0 180
Table 5: Contingency table for Test of Hypothesis 1.
CELL F0 FE F0−FE F0−FE2 F0−F2E/FE
A: r1c1 40 40 0 0 0 B: r1c2 35 40 -5 25 0.625 C: r1c3 15 10 5 25 2.5
D: r1c4 0 0 0 0 0
E: r1c5 0 0 0 0 0
F: r2c1 40 40 0 0 0 G: r2c2 45 40 5 25 0.625 H: r2c3 5 10 -5 25 2.5
I: r2c4 0 0 0 0 0
J: r2c5 0 0 0 0 0P
X2= 6.250
Expected frequencies are obtained thus:
e11 = (90∗80)/180 = 40 e12 = (90∗80)/180 = 35 e13 = (90∗20)/180 = 10 e14 = (90∗0)/180 = 0 e15 = (90∗0)/180 = 0, etc
Designing a 10-cell contingency table: Where r = number of rows, c= number of columns
X2cal = 0 + 0.6250 + 2.5 + 0 + 0 + 0 + 0.6250 + 2.5 + 0 + 0 = 6.250
df = (r−1)(r−2) = (2−1)(5−1) = 1∗4
= 4
With 4 df, the critical X2 value required for significance at .05 significance level is 9.488 (from table).
That is, X2 (tabulated) = X2(r−1)(c.1); 0.05 =X2 df,0.05 = 9.488
Conclusion: If the computed Chi-Square
value exceeds the tabled critical Chi-Square value at a specified level of significance, then the null Hypothesis is rejected. In other words, there is justification for the claim that
Table 6: The adoption and implementation of good strategies will curb the activities of fraudsters.
Quest/ Rank
Strongly agree
Agree Neutral Disagree Strongly Dis-agree
Row total (Ri)
3 38(39) 44(40) 5 (6) 3 (3) 0 (2) 90 4 40(39) 36(40) 7 (6) 3 (3) 4 (2) 90
Column Total (Cj)
78 80 12 6 4 180
Table 7: Contingency table for Test of Hypothesis 1.
CELL F0 FE F0−FE F0−FE2 F0−F2E/FE
A: r1c1 38 39 -1 1 0.02564 B: r1c2 44 40 4 16 0.4 C: r1c3 5 6 -1 1 0.16667
D: r1c4 3 3 0 0 0
E: r1c5 0 2 -2 4 2
F: r2c1 40 39 1 1 0.02564 G: r2c2 36 40 -4 16 0.4 H: r2c3 7 6 1 1 0.16667
I: r2c4 3 3 0 0 0
J: r2c5 4 2 2 4 2P
X2= 5.185
computer network frauds exists. SinceX2 cal-culated (i.e. 6.250) is less than X2 tabulated (i.e. 9.488), H0is accepted and it is concluded that the existence of computer network frauds is real.
4.1.4. Test of Hypothesis 2
H0: Adoption and implementation of effi-cient fraud detection and analysis systems will curb the nefarious attitude of fraudsters.
H1: Adoption and implementation of effi-cient fraud detection and analysis systems will not curb the nefarious attitude of fraudsters.
The data collected based on these hypothe-ses are presented in table 6:
Expected frequencies are obtained thus:
e11 = (90∗78)/180 = 39 e12 = (90∗80)/180 = 40 e13 = (90∗12)/180 = 6 e14 = (90∗6)/180 = 3 e15 = (90∗4)/180 = 2,etc
Designing a 10-cell contingency table: Where r = number of rows,c = number of columns
Table 8: Fraud detection and prevention will reduce revenue leakages.
Quest/ Rank
Strongly agree
Agree Neutral Disagree Strongly Dis-agree
Row total (Ri)
5 43(41) 35(37) 7 (8) 3 (2) 2 (2) 90 6 40(41) 38(37) 9 (8) 1 (2) 2 (2) 90 7 40(41) 38(37) 8(8) 2 (2) 2 (2) 90
Column Total (Cj)
123 111 24 6 6 270
0.02564 + 0.4 + 0.16667 + 0 + 2 = 5.185
df = (r−1)(r−2) = (2−1)(5−1) = 1∗4
= 4
With 4 df, the critical X2 value required for significance at .05 significance level is 9.488 (from table).
Conclusion: SinceX2calculated (i.e. 5.185) is less thanX2tabulated (i.e. 9.488), H
0is ac-cepted and it is then concluded that the adop-tion and implementaadop-tion of efficient fraud de-tection and analysis systems will curb the ne-farious attitude of fraudsters.
4.1.5. Test of Hypothesis 3
H0: Efficient, dynamic and adaptive fraud detection techniques will give service opera-tors a competitive edge in terms of customer care and retention, marketing and revenue as-surance.
H1: Efficient, dynamic and adaptive fraud detection techniques will not give service oper-ators a competitive edge in terms of customer care and retention, marketing and revenue as-surance.
The data collected based on these hypothe-ses are presented in table 8:
Table 9: Contingency table for Test of Hypothesis 2.
CELL F0 FE F0−FE F0−FE2 F0−F2E/FE
A: r1c1 43 41 2 4 0.09756 B: r1c2 35 37 -2 4 0.108108 C: r1c3 7 8 -1 1 0.125
D: r1c4 3 2 1 1 0.5
E: r1c5 2 2 0 0 0
F: r2c1 40 41 -1 1 0.02439 G: r2c2 38 37 1 1 0.027027 H: r2c3 9 8 1 1 0.125 I: r2c4 1 2 -1 1 0.5
J: r2c5 2 2 0 0 0
K: r3c1 40 41 -1 1 0.02439 L: r3c2 38 37 1 1 0.027027
M: r3c3 8 8 0 0 0
N: r3c4 2 2 0 0 0
O: r3c5 2 2 0 0 0P
X2= 1.559
Expected frequencies are obtained thus:
e11 = (90∗123)/270 = 41 e12 = (90∗111)/270 = 37 e13 = (90∗24)/270 = 8 e14 = (90∗6)/270 = 2 e15 = (90∗6)/270 = 2 e21 = (90∗123)/270 = 41 e22 = (90∗111)/270 = 37 e23 = (90∗24)/270 = 8 e24 = (90∗6)/270 = 2 e25 = (90∗6)/270 = 2
And so on.
Designing the 15-cell contingency table: Where r = number of rows,c = number of columns
X2cal = 0.09756 + 0.108108 + 0.125 + 0.5 + 0 + 0.02439 + 0.027027 + 0.125 + 0.5 + 0 + 0.02439 + 0.027027 + 0 + 0 + 0 + 0 = 1.559
df = (r−1)(r−2) = (3−1)(5−1) = 2∗4
= 8
With 8 df, the criticalX2value required for significance at .05 significance level is 15.507 (from table).
Conclusion: SinceX2 calculated (i.e. 1.559) is less than X2 tabulated (i.e. 15.507), H
competi-tive edge in terms of customer care and reten-tion, marketing and revenue assurance.
5. Concluding Remarks
The message is simple – as organized crime continues to grow, organizations must get smarter and more efficient at stopping crimi-nals in their tracks. Firstly, significantly im-proved positive detection of organized money laundering and financial crime attacks deliv-ers:
reduced financial losses
reduced risk of exposure to sanctions
increased reputation protection
Secondly, reduced operational costs of both human and technological resources can be maximized, as duplication of effort is eradi-cated. Institutions who have already started on the journey of an enterprise approach re-port substantial improvements, including:
98% improvements in the speed of com-pletion for first level investigations
200% increases in the accuracy of detec-tion rates
The adoption and implementation of effi-cient fraud detection and analysis systems will curb the nefarious attitude of fraudsters, and delivers the information and intelligence for you to take command and control of your de-fenses across all products, channels and re-gions. It will also help deliver an early warn-ing system to help you quickly understand the magnitude of an attack and the crucial infor-mation needed to make informed operational decisions that protect your business.
References
1. Robert, C. Seacord and Allen, D. Householder. A Structured Approach to Classifying Security
Vulnerabil-ities, Technical Note,
CMU/SEI-2005-TN-003, January 2005, URL:
http://www.sei.cmu.edu/reports/pdf/05tn-003.pdf.
2. Jerry Scott. 2004 CSI/FBI Annual Sur-vey, URL: tjscott.net/policy/csifbi2004.pdf, 2004
3. John Doody, David Hodges. Information Security Breaches 2000 Survey. Presenta-tion to theFirst International Common Cri-teria Conference, Baltimore, UK IT Secu-rity, Evaluation and Certification Scheme, 23 May 2000.
4. Inyiama, H. C. Computer Applications and Information Technology, The Dynamic In-former, Enugu, 2000, pp 108.
5. Michael Erbschloe. Love Bug Damage Costs Rise to 6.7 Billion. May 9, 2000, URL: http://www.businesseconomic.com/cei/-press.index.html
6. Michael Erbschloe. Guide To
Disaster Recovery. 2003, URL:
www.cert.org/archive/html/Analysis10a.html
7. Oppenheim, A. N. Questionnaire Design, Interviewing and Attitude Measurement, Wellington House, London, 1992.