Quantification of Argyrophilic Nucleolar Organizer
Regions in Different Histopathological Grades of
Oral Epithelial Dysplasia
1Girish K Lingegowda, 2Pradeesh Sathyan
ABSTRACT
Context: Although most oral cancers probably arise in clinically normal mucosa, some are preceded by a precancerous lesion, which indicates an increased risk of cancer development at a particular site. The degree of epithelial dysplasia is a useful guide in the diagnosis and management of such lesions. Many recent reports have suggested that the number of nucleolar organizer regions (NORs) per nucleus is related to cellular
proliferation and differentiation. The NORs can be identified
indirectly by means of argyrophilia of their associated proteins.
Aim: To evaluate the argyrophilic NORs (AgNORs) in different histopathological grades of oral epithelial dysplasia.
Materials and methods: This is an interobservational study including a total of 40 samples of which 10 cases each of mild, moderate, and severe grades of oral epithelial dysplasia con-stituted the study group, whereas 10 cases of normal mucosa formed the control group. The AgNORs were analyzed in
formalin-fixed paraffin-embedded blocks of histopathologically confirmed cases using silver staining technique. Counting of
AgNORs was done and the mean AgNOR count was obtained and statistically analyzed using analysis of variance (ANOVA)
post hoc test.
Results: There was a significant rise in mean AgNOR count
of oral epithelial dysplasia in the order of mild (3.15 ± 0.11), moderate (3.43 ± 0.28), and severe (4.82 ± 0.18) compared with that of normal mucosa (2.49 ± 0.30).
Conclusion: A high positive correlation was observed between NORs of mild, moderate, and severe grades of oral epithelial dysplasia. The mean values of NORs increased as severity of dysplasia increased.
Keywords: Argyrophilic nucleolar organizer regions, Epithelial dysplasia, Silver staining.
How to cite this article: Lingegowda GK, Sathyan P.
Quantification of Argyrophilic Nucleolar Organizer Regions in
Different Histopathological Grades of Oral Epithelial Dysplasia.
Oral Maxillofac Pathol J 2018;9(2):58-62.
Source of support: Nil
Conflict of interest: None
ORIGINAL RESEARCH
1Professor, 2Reader
1,2Department of Oral Pathology, Sree Mookambika Institute of Dental Sciences, Kanyakumari, Tamil Nadu, India
Corresponding Author: Girish K Lingegowda, Professor Department of Oral Pathology, Sree Mookambika Institute of Dental Sciences, Kanyakumari, Tamil Nadu, India, Phone: +919611835503, e-mail: klgowda@yahoo.com
INTRODUCTION
The occurrence of cancer has occupied a position of special significance, as a much feared disease and as an object of intensive biomedical investigation. Dysplasia is an important feature of oral leukoplakia and the malignant transformation rate of oral leukoplakia with epithelial dysplasia is higher than that of leukoplakia without epithelial dysplasia. Kwabe et al have reported a nonhomogeneous clinical subtype and the presence of epithelial dysplasia to be associated with an increased risk of malignant transformation.1
Leukoplakia as a clinical diagnosis may have varied histological presentation ranging from mildly hyper-keratotic lesions to those exhibiting severe dysplasia. It is important to distinguish between these lesions, as their clinical management may differ. Mildly hyper-keratotic/hyperplastic lesions may be kept under observation and may resolve spontaneously, whereas dysplastic lesions need to be excised. To date, no clear markers for epithelial dysplasia have evolved and his-tological criteria for diagnosing a “dysplastic” lesion are still subjective. In the absence of objective criteria, there is wide variation between oral pathologists in diagnosing such lesions. Several investigations suggest that quantification of NORs as a valuable parameter in tumor pathology.2
The nucleus plays an important role in the control of proliferation and protein synthesis. Nuclear orga-nizer regions are loops of ribosomal deoxyribonucleic acid (DNA) that occurs in the nucleoli. The NOR DNA possesses ribosomal DNA genes which are transcribed by ribonucleic acid polymerase I and ultimately direct ribosome formation and protein synthesis. The number of NORs in each cell nucleus reflects the cellular activity. The NORs can be identified with the help of silver stain-ing technique by which they are visualized in the nuclei of cells as brown or black dots by virtue of argyrophilia of NOR-associated proteins.3,4
Quantification of AgNORs in Different Histopathological Grades OMPJ
before the histological hallmarks appear. This method has been considered to represent a new additional diagnostic tool in tumor pathology. It has been employed to study the proliferative activity of various lesions. It was also stated that AgNOR count may provide information on cancer prognosis supplementary to that obtained from DNA flow cytometric analysis.2
The specificity and simplicity of the AgNOR stain-ing procedure have led to widespread application of this technique in human pathology. Many recent reports have suggested that the number of AgNORs per nucleus is related to cellular proliferation and differentiation. Thus, AgNORs have been widely used as a diagnostic aid in histopathological grading as well as a prognostic indicator in various oral lesions.5
MATERIALS AND METHODS
The present study was carried out in the Department of Oral Pathology and Microbiology. Archival tissues from paraffin-embedded blocks from the Department and also recent cases in the dental outpatient department were considered. The study group consisted 10 tissue blocks each of histopathologically confirmed cases of mild, moderate, and severe grades of oral epithelial dyspla-sia. Ten cases of normal mucosa constituted the control group. From each tissue block, two sections each of 3 to 4 μm thickness were obtained. One set of sections were stained with hematoxylin and eosin to histopathologi-cally confirm the diagnosis and the other set of sections were stained with silver staining technique for AgNOR count. The histological grading of epithelial dysplasia was done using the World Health Organization 2005 classification.
Staining Technique
The improved method of silver staining technique for nucleolar organizing regions was done according to the standard protocol recommended by Ploton et al.6 The sections were dewaxed in xylene for about 3 to 5 minutes and then rehydrated through decreasing grades of ethanol followed by thorough washing in running deionized water for 8 to 10 minutes. Ten slides were stained in each batch by incubating them at 40°C in dark for 20 minutes. Post-stained sections were washed in running deionized water for 5 to 8 minutes, dehydrated through ascending grades of ethanol concentrations, finally cleared in xylene, and mounted in DPX. Lymphocytes present in the con-nective tissue showing one or two AgNORs were used as the internal control for the staining technique. No counter stains were used to eliminate the risk of over shadowing the AgNORs.
Counting of AgNORs
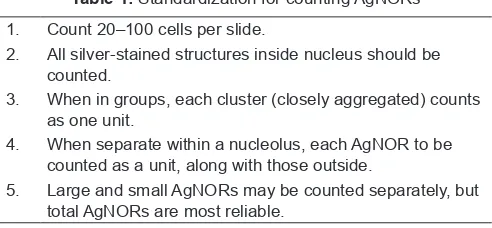
The AgNORs were counted as per the standardized pro-cedure recommended by Crocker et al7 (Table 1). In each of the sections, 100 individual cells were examined from the representative areas of the epithelium. The methodical and systematic quantification of AgNORs was carried out using an oil immersion objective (100×). The NORs were distinctly visible as black “dots” or “blebs” of varying sizes, in the brown stained nucleus on a pale yellow back ground of the cells. By careful focusing, AgNOR dots were counted; both intra-nucleolar and extra-nucleolar dots were included in the counting regime. However, nuclei that are over lapped or those with indiscernible AgNORs were excluded. The photomicrographs were obtained using a research microscope.
Evaluation of AgNORs
The AgNORs were counted in each nucleus and all the values were expressed in terms of mean ± standard deviation. Data obtained were analyzed using Statistical Package for the Social Sciences version 16 for Windows operating system. The ANOVA test was applied and statistical significance between the groups at 95% confi-dence interval, and p-value less than 0.05 was considered statistically significant.
RESULTS
Based on the clinical and histopathological correlation, the 30 cases of epithelial dysplasia were divided into three groups of 10 each representing mild, moderate, and severe grades. The patients with epithelial dysplasia in our study were in the age group of the 31 to 65 years with the mean age of 47 years and there was male predominance with the male-to-female ratio of 4:1. Documentation of the associated habits and common site of the lesion showed smoking as the most prevalent cause and buccal mucosa as the most favorable site.
In the present study, the mean value of AgNORs was 2.49 ± 0.30 in normal mucosa, whereas mean AgNOR counts were 3.15 ± 0.11, 3.43 ± 0.28, and 4.82 ± 0.18 in mild, moderate, and severe grades of epithelial dysplasia
Table 1: Standardization for counting AgNORs 1. Count 20–100 cells per slide.
2. All silver-stained structures inside nucleus should be counted.
3. When in groups, each cluster (closely aggregated) counts as one unit.
4. When separate within a nucleolus, each AgNOR to be counted as a unit, along with those outside.
respectively (Table 2 and Graph 1). A high positive cor-relation was observed between NORs of mild, moderate, and severe dysplasia. The mean values of NORs increased as severity of dysplasia increased. The increase in the mean value of AgNOR count in various grades of epithe-lial dysplasia was statistically significant when compared with the normal mucosa (p < 0.05). The increase in the mean values of NORs in severe dysplasia was very sig-nificant when compared with the other groups (p < 0.05). Though moderate dysplasia showed an increase of NOR count, it was statistically not significant when compared with mild dysplasia (p > 0.05).
DISCUSSION
Oral cancer is one of the tenth most common cancers worldwide and is a major problem in India and account for 50 to 70% of all cancers diagnosed compared with 2 to 3% in the U.K. and U.S. Although most oral cancers probably arise in clinically normal mucosa, some are preceded by a precancerous lesion which indicates an increased risk of cancer development at a particular site. The histopathologist’s role is to recognize pathological features which indicate high risk and to provide diag-nostic and progdiag-nostic information from examination of excised tumors.8
The most common precancerous lesion is a white patch on the oral mucosa referred to as leukoplakia. These lesions show variable clinical features ranging from relatively innocuous flat white plaques to verruciform or
atypia which are usually graded as mild, moderate, or severe. The degree of epithelial dysplasia is a useful guide for the management of such lesions.
The assessment of cellular proliferation in histological material is a valuable component of conventional histo-pathological analysis, and a variety of methods can be used to quantify this. Ideally, such methods should be simple, reproducible, and applicable to conventionally processed histological and cytological preparations. The method should be relatively inexpensive and interpreta-tion of the results should be straightforward. In general, a high proliferative activity is associated with poor progno-sis. The AgNOR quantity is strictly related to the rapidity of cell proliferation; the higher the AgNOR quantity, the shorter the cell doubling time.9
In the present study, the control group consisted of normal mucosa and the mean value of NORs was 2.49 ± 0.30. This finding is in agreement with various investiga-tors like Cabrini et al10 (2.95 ± 1.42), Rajendran and Nair11 (2.50 ± 0.52), and Xie et al12 (2.3 ± 0.4). Similarly, there was a significant rise in mean AgNOR count of dysplasia in the order of mild (3.15 ± 0.11), moderate (3.43 ± 0.28), and severe epithelial dysplasia (4.82 ± 0.18) as compared with normal epithelium. This finding of the present study was similar to that of the previous studies on leukoplakia by Chattopadhyay et al13 and Sano et al.14 They opined that this increase in AgNOR count is related to the prognosis of the lesion which indicates the poor prognosis rate of different grades of epithelial dysplasia as the mean count increases. It suggests that the lesions became more aggres-sive or more dysplastic and ultimately malignant as the AgNOR count tends to increase (Figs 1 to 3).
Mehkri et al15 did a study to assess the cell prolifera-tion rate in precancers. In their study, the mean AgNOR
Normal mucosa 2.49 ± 0.30
Mild dysplasia 3.15 ± 0.11
Moderate dysplasia 3.43 ± 0.28
Severe dysplasia 4.82 ± 0.18
Graph 1: Mean values of AgNORs according to severity of dysplasia
Quantification of AgNORs in Different Histopathological Grades OMPJ
count in cases of mild dysplasia was 2.59 ± 0.66, in moder-ate dysplasia, it was 2.92 ± 0.43, and in severe dysplasia, it was 2.79. They concluded that the mean AgNOR counts increased with the increase in the grades of dysplasia, indicating a higher proliferative rate with increase in dysplasia.
It is said that immediately before and after mitotic division, the NORs disperse and then re-aggregate, thus leading to an increase in the number of countable AgNORs in the nuclear profiles. The number of count-able AgNORs in interphase nuclei is probably related more to their dispersion through the nucleoplasm than to the actual number present. The AgNOR counts may therefore be an index of AgNOR dispersion rather than the actual number present in the karyotype. Dispersion may in itself reflect the proliferative state of the cells. Before mitosis, the AgNORs re-aggregate and the nucleoli reform. Thus, the AgNOR count rises before and after mitosis.16
Kahn et al17 and Chattopadhyay et al13 have suggested that in oral premalignant lesions, the number of AgNORs cannot be used as a diagnostic aid for the degree of dys-plasia in oral mucosa. In their study, the cases of nondys-plastic leukoplakia, reactive hyperplasia and epithelial hyperplasia also exhibited higher number of AgNOR count than mild and moderate epithelial dysplasia. The probable reason behind this correlation may be the high turnover rate of oral epithelium in these lesions.
Despite the strong association between AgNOR values and degrees of dysplasia, the variability within pathological grades may preclude the adaptation of this technique on its own as a prognostic indicator. Since the proliferation changes during the cell cycle reflect the net effect of genetic damage and therefore include the accumulated changes in genes, they may be regarded as more useful prognostic indicators than individual
oncogene alterations. Our own results indicate that the silver nitrate staining for NORs is a useful method for aiding the diagnosis of dysplastic mucosal lesions with malignant potential and act as a diagnostic tool for the early detection of such lesions. This method should be routinely used along with other laboratory techniques and is helpful as a prognostic marker.
CONCLUSION
The field of AgNORs as potential tools for diagnosis, prognosis, comparisons, and grading of oral lesions is ripe and vast. A large group of oral lesions still remains to be assessed as to the value of AgNOR significance. While it cannot be said with certainty and conviction that AgNORs are definitively diagnostic or prognostic, it is surely observed that they can serve as a reliable tool adjunct to histopathological diagnosis. Their ease of demonstration and high specificity to cellular proliferation make them the best available histopathological marker in the arsenal of an oral histopathologist.
REFERENCES
1. Pich A, Chiusa L, Margaria E. Prognostic relevance of AgNORs in tumor pathology. Micron 2000 Apr;31(2):133-141.
2. Chattopadhyay A, Chawda JG, Doshi JJ. Silver binding nucleolar organizer regions: a study of oral leukoplakia and squamous cell carcinoma. Int J Oral Maxillofac Surg 1994 Dec;23(6 Pt 1):374-377.
3. Gulia SP, Sitaramam E, Reddy KP. The role of silver staining nucleolar organiser regions (AgNORs) in lesions of the oral cavity. J Clin Diagn Res 2011 Oct;5(5):1011-1015.
4. Chowdhry A, Deshmukh RS, Shukla D, Bablani D, Mishra S. Quantitative estimation of AgNORs in normal, dysplastic and malignant oral mucosa. Biomed Pap Med Fac Univ Palacky Olomouc Czech Repub 2013 Jun;158(2):282-287.
5. Rajput DV, Tupkari JV. Early detection of oral cancer: PAP and AgNOR staining in brush biopsies. J Oral Maxillofac Pathol 2010 Jul;14(2):52-58.
Fig. 2: Histopathology showing AgNORs in moderate dysplasia
at the optical level. Histochem J 1986 Jan;18(1):5-14.
7. Crocker J, Boldy DA, Egan MJ. How should we count AgNORs? Proposals for a standardised approach. J Pathol 1989 Jul; 158(3):185-188.
8. Bukhari MH, Niazi S, Khan SA, Hashmi I, Perveen S, Qureshi SS, Chaudhry NA, Quershi GR, Hasan M. Modified method of AgNOR staining for tissue and interpretation in histopathol-ogy. Int J Exp Pathol 2007 Feb;88(1):47-53.
9. Migaldi M, Criscuolo M, Zunarelli E, Bianco LL, Martinelli AM, Barbolini G. p120 and AgNOR nucleolar protein expression: a comparison with nuclear proliferation markers in oral pathol-ogy. Oral Surg Oral Med Oral Pathol Oral Radiol Endod 1998 Feb;85(2):189-196.
10. Cabrini RL, Schwint AE, Mendez A, Femopase F, Lanfranchi H, Ifoiz ME. Morphometric study of nucleolar organizer regions in human oral normal mucosa, papilloma and squamous cell carcinoma. J Oral Pathol Med 1992 Jul;21(6):275-279. 11. Rajendran R, Nair SM. Silver binding nucleolar organizer
region proteins as a possible prognostic indicator in oral
nostic value of nucleolar organizer regions (AgNORs) in normal epithelium, dysplasia, and squamous cell carcinoma of oral cavity. Cancer 1997 Jun;79(11):2200-2208.
13. Chattopadhyay A, Ray JG, Caplan DJ. AgNOR count as objec-tive marker for dysplastic features in oral leukoplakia. J Oral Pathol Med 2002 Oct;31(9):512-517.
14. Sano K, Takahashi H, Fujita S, Inokuchi T, Pe MB, Okabe H, Tsuda N. Prognostic implication of silver binging nucleolar organizer regions (AgNORs) in oral squamous cell carcino-mas. J Oral Pathol Med 1991 Feb;20(2):53-56.
15. Mehkri S, Iyengar AR, Nagesh KS, Bharati MB. Analysis of cell proliferation rate in Oral Leukoplakia and Oral Squamous Cell Carcinoma. J Clin Exp Dent 2010;2(4):e173-e177. 16. Umelerwood JC. Prognostic indices in epithelial neoplasms.
Recent Adv Histopathol 1991;14:17-33.