False Data Filtering Strategy in Wireless Sensor Network
Based on Neighbor Node Monitoring
https://doi.org/10.3991/ijoe.v13i03.6869
Haishan Zhang*
North China University of Science and Technology, Tangshan, China 38775617@qq.com
Xinchun Wang
North China University of Science and Technology, Tangshan, China 10759697@qq.com
Chenghui Jia
North China University of Science and Technology, Tangshan, China 38775617@qq.com
Abstract—The injection attack of false data is a common attack form in wireless sensor network. This attack form achieves the purpose of consuming limited network resources and severely threatens the safety of wireless sensor network through consistent sending false data. This paper proposes a type of false data filtering strategy based on neighbor node monitoring. The idea of this strategy is to enable each node to store the neighbor node's information within the two-hop range. In the meantime, the data package determines whether the upstream node is original node or data forwarding intermediate node through whether ACK package is remitted by the upstream node to avoid the imper-sonation of wireless sensor network node by malicious node. The false data package of malicious node will be filtered within one hop. The simulation ex-periment verifies the filtering performance and anti-capture performance of this strategy, thus guaranteeing the safety of wireless sensor network.
Keywords—wireless sensor network; wastewater monitoring system; ZigBee network; PH parameters
1
Introduction
acquisition and processing and is widely applied in national defense and military, environmental monitoring, medical and health care, intelligent buildings and space exploration [4].
The structure of wireless sensor network is shown in Figure 1. We can see from Figure 1 that sensors and nodes are densely arranged in the monitoring area and the sensing data is aggregated to the sink node. The interaction with data of task manage node is achieved through the external network (Internet, satellite-net).
Monitoring area
Sensor node
Sink node Satellite-netInternet,
Task Manage Node (user)
Fig. 1. Structure Diagram of Wireless Sensor Network
We can see from the structure diagram that wireless sensor network nodes and the route in the transmission process are exposed to the outside and thus it is very easy for malicious attackers to capture or forge sensor nodes. Once capturing the node, the confidential information will be stolen and this node will be reformed to malicious node [5]. To attack wireless sensor network, attacks will constantly inject false data through the malicious node, thus occupying network bandwidth and increasing com-munication overhead. On the one hand, the request by normal nodes will not be re-sponded; on the other hand, the limited power of nodes will be wasted by false data, resulting in the paralysis of wireless sensor network. Therefore, the filtering technolo-gy of false data has attracted more and more attention [6].
data package. That is to say, the node cannot identify whether upstream nodes are generated or forwarded. Applying false data filtering strategy based on neighbor node monitoring, this paper can identify the source of this data package through ACK package. Thus, it can guarantee that the captured nodes cannot forge the false infor-mation in other regions and the false data package will be filtered within one hop in most cases.
2
False Data Filtering Strategy in WSN Based on Neighbor
Node Monitoring
2.1 Basic Idea of this Strategy
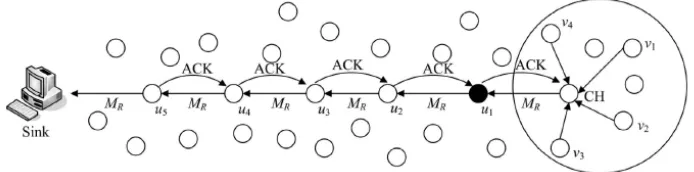
In traditional filtering solutions, if attackers capture T nodes in different regions in the network, they will forge false data package in any region through storage keys in captured nodes. The downstream nodes cannot distinguish this data package is gener-ated or forwarded by upstream nodes, so they can only verify or forward passively [11]. Therefore, if we can identify that the data package is generated by upstream nodes, and then downstream nodes can know whether the node at further distance is the neighbor of this node or not, thus identifying this data package is forged.
Fig. 2. Schematic Diagram of System Model
we can identify that the node u1 is the forwarding node. In this case, u1 and u0 also monitor ACK package and check in the Packet_ID in the data package stored buffer-ing area to judge whether there is Packet_ID which is the same as that in ACK pack-age. If there exist, then we can identify the ACK message as legitimate. Or else, we identify the ACK message as abnormal and send abnormal results to node u2 in the form of alarm package. When the number of alarm packages in the data package re-ceived by node u2 exceeds the threshold value w, then we can identify the data pack-age received is false data packpack-age. In the transmitting process of alarm packpack-age, the real identity of nodes can be guaranteed by one-way chain technology. Sink nodes possess relevant keys of all nodes and small number of escaped false data packages will be detected by nodes after reaching the sink node [13-14].
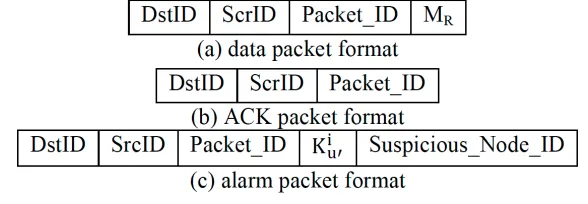
The format of data package MR, ACK package and alarm package is shown in Fig-ure 3. Information like Packet_ID of false data package, its newest one-way chain key and ID of suspicious nodes is contained in the alarm package. Assume u1 transmits the false data package to node u2 of next hop and their common neighbor u’ judges that it is a false data package applying ACK package. The neighbor node will transmit the data package stored within the two-hop range to u2. If u2 and u’ are direct neighbors, the alarm package will be directly transmitted to node u2; if u2 and u’ are neighbors of two-hop range, then it needs other nodes to forward the alarm package to u2 or it will not transmit any data package. After receiving alarm package, u2 will use the stored one-way chain key !!!! of node u’ to verify the validity of keys in alarm package. If it
passes the verification, then u2 will count the number of different nodes in alarm package and update the one-way chain keys corresponded to node u’.
Fig. 3. Various Data Packet Formats
2.2 Mode of Key Distribution and Initializing Network
Similar to SEF strategy, we set a public key pool with N space as G and
! ! !!! ! ! ! ! ! !! . i is key index and the key pool is divided into n
nonover-lapping key partitions !!! ! ! ! !! ! !}. Each partition contains m keys and thus N=n*m. Each key partition can be divided according to
!!! !! !" ! ! ! ! ! ! !! ! !
threshold of nodes; w represents the quantity threshold of alarm packages needed in the authentication of certain node; Twait represents the time u1 needed to wait for mes-sage monitoring after receiving the data package.
After the deployment of nodes in the monitoring area, each node uses random number Ru and node ID to generate keys !!!! !!!!! !"!! and then uses function !!!! !!!!!!!! to generate m+1 one-way chain keys ! !!!! !!!! ! ! !!!! ! correspond-ed to each node. Each node stores [m/d1]+d2 one-way chain keys calculated through its own ID. [m/d1] represents several keys !!!!! !!!!!! ! ! !!!"!! ! ! !
!!!with the inter-val of d1 and d2 one-way chain keys to be used are stored, which are initialized as
!!!! !!!! ! ! !
!!!!!! ! ! !!!!!!. After the usage of first group of keys, the second group of keys are generated and stored into d2 unit by applying neighboring one-way chain keys. Similarly, each node contains its own !"! and the data package of !!! message. After receiving, the neighboring node will record the !"! and !!! of its neighboring node and set the credibility of each neighboring node as 1. And then, it will send the
!"! and !!! of its neighboring node to other neighboring nodes for storage. In this
way, each node in the network not only records the !"!, !!! and credibility of its neighboring node, but records the !"! and !!! of its neighboring node within two-hop range.
2.3 Generation of Data Package
When the data information needed by users is generated, several sensor nodes around the information will sense this information and transmit this data information to neighboring nodes. When a node receives the data transmitted by more than T different key group nodes, this node informs its neighboring nodes that it is a cluster header node and forms fusion data package M according to corresponding fusion policies. The data package M is transmitted to each node in the cluster and they judge the conformity between this data and the data detected based on the application re-quirement of users and the precision of sensors. If the conformity is good, then ran-domly select a key !! to generate !! and send it to cluster head node. !!=MAC(!!,
M||!"!!!!), || represents the successful connection of data and MAC represents the
authentication code of data generated by applying key !!. The detailed process is as follow:
! ! !"! !"!! !! !"# !!! ! !"! ! !!!!!!!!!!!!!!!!!!!!!!!!!!!!!!!!!!!!!!!!!!!!!!!!!!!(1)
When cluster head nodes receive the data fed back by nodes, they will firstly refer to list of neighbor nodes to judge whether this ID is its neighbor node. If it is not, discard this data package and then select T data packages !! generated by data from different key partitions. After that, transmit the data package to sink node. Then for-mat of data package !! is:
!"!
!!!!!!!!!!!!!!!!!!
2.4 Sink Node Verification
After the halfway filtering algorithm, the data complete halfway screening and then the data will be transmitted to sink nodes. After receibving the data package, sink nodes will first check whether the number of keys, ID and MAC in the data package equals to T. If not, then discard this data package; if there exist two key indexes orginated from the same key partition, then discard this data package; finally, because sink node has the ID and corrresponding keys of all nodes, small number of false data escaping the filtering of halfway nodes will be regognized and filtered.
2.5 Analysis of Specific Attacking Identity Strategy of malicious nodes Malicious cluster head nodes applying non-neighboring nodes in the network to forge false data package: When malicious nodes apply non-neighboring nodes to transmit false data to downstream nodes, through ACK package, downstream nodes can judge whether it is false data and discards it by the node ID with the two-hop range; if malicious nodes transmit ACK package to neighboring nodes, the neighbor-ing nodes can identify it is illegal data package if the by comparison of Pcaket_ID shows inconsistent results. Moreover, it will transmit alarm package to downstream nodes. When the number of alarm packages from different nodes reach w, this data package will be identified as false data package.
Malicious cluster head nodes applying neighboring nodes to forge false data package: If malicious nodes are captured by neighboring nodes, there will be two identical ID originated from the node from the same partition when transmitting the data package, which is contradictory. This data package will be filtered by down-stream nodes and downdown-stream nodes and downdown-stream nodes will receive the alarm package.
Conspiracy attack by malicious cluster head nodes and captured downstream nodes: Many alarm packages will be forwarded when cluster head nodes and cap-tured nodes transmit false data package to each other. During this time, the neighbor-ing area will receive certain number of alarm packages. In this way, false data pack-ages will be filtered.
3
Strategy Performance and Analysis of Simulation Experiment
3.1 Monitoring Capacity of Neighboring Nodes
c
u2 r
u1
c
u2 r
u1
(a)
(b)
C1
u2 r
u1
(c)
C2C3
C4
Fig. 4. Public Neighboring Area of Nodes
Analysis of the number of public monitoring nodes: In terms of nodes that can directly communicate with each other, the number of public neighboring nodes is assocated with distance. The larger the distance, the fewer the public neighboring nodes, as is shown in (a) and (b) in Figure 4. When the interval between u1 and u2 is the largest communication distance of nodes, the number of public neighboring nodes is the fewest. Assume that the largest communication distance of nodes is r and C area is the public area of nodes u1 and u2, so the minimal area of C is:
! !!!!!!! !
! !!!!!!!!!!!!!!!!!!!!!!!!!!!!!!!!!!!!!!!!!!!!!!!!!!!!!!!!!!!!!!!!!!
In Figure (b), the proportion of C area in node communcation area is 40%. Assume the number of neighboring nodes is 20 and these nodes are distributed evenly, and there will be 7 public neighboring nodes for two nodes. Therefore, the number of public monitoring nodes can be guaranteed even under the premise of minimal public area.
overlapping area is divided into C1, C2, C3 and C4 shown in Figure (c). when node u2 receives the alarm package transmitted by upstream monitoring nodes, this data package must be transmitted or forwarded by certain node in these 4 areas. When u2 receives the alarm package, certain node in C2 at least receives the alarm package of u2 transmitted or forwarded by other 3 areas. This area occupies 83% in C area. Certain node in C1 at least receives the alarm package of C1 and C2, occupying 50% of the node communication area. When u2 receives m alarm packages transmitted by upstream monitoring nodes, it can be deduced that C2 and C3 at least receives 0.83m alarm packages and C1 and C4 at least receives 0.5m alarm packages.
The transmission delay of data package in this startegy is low, which exerts little impact on the decision-making of sink nodes. Meanwhile, there will not be great communication overhead and storage overhead, thus satisfying the requiremnet of users.
3.2 Simulation Experiment
The parameter configuration is shown in Table 1. We identify that the attack mode is random and take the mean value of 1000 data as the final result. We obtain the filtering capacity, anti-capture performance and algorithm performance by the com-parison between SEF and NWFFS through simulation experiment.
Table 1. Parameter Configuration Table
Parameter Parameter Value
Simulation area 500*500m2
Number of nodes 2000
Communication radius 29.8m
Sensing radius 29.8m
Global key pool size 400
Number of key partitions 20 The number of keys node stored 10 Node trust upper threshold ub 0.8 Node trust Lower threshold lb 0.1 Alarm package threshold w 5 Number of key partitions in data package T 5
! " # $ % & ' ( ) # % ' ) "! "# "% "' * * + ,-./ 0-*1. /23 4 51* 67 83
9 :4;-.*7<*/ 11/ =>*27?-3
*@ A B *9 C B B @
Fig. 5. Average Number of Transmission Hops Before False Data Filtering
! " # $ % &!
! &! "! '! #! (! $! )! %! *! &!! + + , -./ 01 -2 3+ 41 56 76 -.-/ 89 : ;
< =>601+5?+7 //7 @A+25B0C
+D E , +< F , , D
Fig. 6. Filtering Probability of False Data Package
8, SEF almost loses its filtering capability. Compared with SEF, NWFFS strategy has almost maintained a good filtering capability of false data package.
Analysis of anti-capture performance: The number of captured nodes is directly proportional to the forgery area of malicious nodes. Therefore, we can use the propor-tion of area of false data package successfully forged by malicious nodes in total deployement area to measure the anti-capture performance of nodes in this strategy. we can see from Figure 7 that when the number of captured nodes is 5, malicious nodes in SEF strategy can forge 61.3 area events. In NWFFS strategy, malicious nodes can barely forge any area event. When the number of malicious nodes is 49, malicious nodes in SEF strategy can almost forge any area event while malicious nodes in NWFFS strategy can only forge 3.4% of area events.
! " #$ #% #& $# $' $( )* )) )! )" '$ '% '& *
#* $* )* '* %* !* (* &* "* #**
+
+
,
-./
0.1
+2
.0
2+
.2
34-56
7
8 9:;0.+-<+2 332 =>+?-@0A
+B C , +8 D , , B
Fig. 7. Proportion of Forgery Area in Total Deployment Area
4
Conclusion
5
References
[1]Perrig, A., Stankovic, J., Wagner, D. (2004). Security in wireless sensor networks. Com-munications of the Acm, 47(6), 53-57. https://doi.org/10.1145/990680.990707
[2]Sandhya, M. K., Murugan, K., Devaraj, P. (2015). Selection of aggregator nodes and elim-ination of false data in wireless sensor networks. Wireless Networks, 21(4), 1327-1341. https://doi.org/10.1007/s11276-014-0859-y
[3]Lee, H. Y., Cho, T. H. (2009). Detection of false data injection attacks in wireless sensor networks. Nature, 458(7238), 83-91.
[4]Wang, H., Li, Q. (2010). Achieving robust message authentication in sensor networks: a public-key based approach. Wireless Networks, 16(4), 999-1009. https://doi.org/10.1007/ s11276-009-0184-z
[5]Banerjee, T., Veeravalli, V. V. (2015). Data-efficient quickest change detection in sensor networks. IEEE Transactions on Signal Processing, 63(14), 3727-3735. https://doi.org/10.1109/TSP.2015.2432737
[6]Yu, Z., Guan, Y. (2010). A dynamic en-route filtering scheme for data reporting in wire-less sensor networks. IEEE/ACM Transactions on Networking, 18(1), 150-163. https://doi.org/10.1109/TNET.2009.2026901
[7]Wang, J., Liu, Z., Zhang, S., Zhang, X. (2014). Defending collaborative false data injec-tion attacks in wireless sensor networks. Information Sciences, 254(1), 39-53. https://doi.org/10.1016/j.ins.2013.08.019
[8]Lin, C., Wu, G., Yu, C. W., Yao, L. (2015). Maximizing destructiveness of node capture attack in wireless sensor networks. The Journal of Supercomputing, 71(8), 3181-3212. https://doi.org/10.1007/s11227-015-1435-7
[9]Chen, Y., Yang, J., Trappe, W., Martin, R. P. (2010). Detecting and localizing identity-based attacks in wireless and sensor networks. IEEE Transactions on Vehicular Technolo-gy, 59(5), 2418-2434. https://doi.org/10.1109/TVT.2010.2044904
[10]SUNDAY. (2012). Data dissemination and filtering in wireless sensor network. Journal of the Acoustical Society of America, 113(4), 2217-2217.
[11]Jia, Q. S., Shi, L., Mo, Y., Sinopoli, B. (2012). On optimal partial broadcasting of wireless sensor networks for kalman filtering. IEEE Transactions on Automatic Control, 57(3), 715-721. https://doi.org/10.1109/TAC.2011.2164739
[12]Cheng, P., Qi, Y., Xin, K., Chen, J. (2015). Energy-efficient data forwarding for state es-timation in multi-hop wireless sensor networks. IEEE Transactions on Automatic Control, 61(5), 1-1.
[13]Jie, C., Li, J., Yang, S., Fang, D. (2016). Weighted optimization-based distributed kalman filter for nonlinear target tracking in collaborative sensor networks. IEEE Transactions on Cybernetics, 1-14.
[14]Oka, A., Lampe, L. (2008). Energy efficient distributed filtering with wireless sensor net-works. IEEE Transactions on Signal Processing, 56(5), 2062-2075. https://doi.org/10.1109/TSP.2007.911496
6
Authors
China University of Science and Technology. His interesting filed is wireless sensor networks, image processing (38775617@qq.com).
Xinchun Wang was born in Hebei, China, in 1977. She works at College of Sci-ence, North China University of Science and Technology, Tangshan 063009, China, and received the Master's degree in 2010 from North China University of Science and Technology. Her interesting filed is operation and optimization (10759697@qq.com).
Chenghui Jia was born in Hebei, China, in 1980. He works in the Modern Tech-nology and Education Centre, North China University of Science and TechTech-nology, Tangshan 063009, China, and received the Master's degree in 2013 from Nanyang Technological University. His interesting filed is false data filtering,node detection algorithm (38775617@qq.com).