Response of groundwater to the process of reservoirs group regulation and
storage in Manas River Basin in Xinjiang
Bing Liu
1,2,
Guang Yang
1,2,3,
Xinlin He
1,2*(1.College of Water Conservancy and Construction Engineering, Shihezi University, Shihezi 823003, China; 2. Key Laboratory of Modern Water Saving Irrigation.of Xinjiang production and Construction Corps, Shihezi University, Shihezi 823003, China; 3. Department of Geological Sciences, Center for Water Research, University of Texas at San Antonio, TX 78249, United States)
Abstract: Reservoir regulation and storage is the main approach to alleviate the water pressure caused by the uneven spatial and temporal distribution of surface water resources in arid areas of northwest China. While the regulation and storage of the reservoir affect the conditions of recharge and discharge of groundwater, the process of regional surface-groundwater transformation tends to be complicated. The Manas River basin that lies on the northern slope of Tianshan Mountain in Northwest China was taken in this study as a case. A numerical model of groundwater in basin plain area was established, and the influence of reservoir regulation on groundwater level was studied. The results showed that the total recharge of groundwater in the study area was 75.539 million m3, the total discharge of groundwater was 82.66 million m3, and the groundwater in the study area was in a negative equilibrium state, with a difference of – 69.27 million m3. The water balance method was used to verify the comparison. The total recharge of groundwater was 74.34 million m3, the total discharge of groundwater was 80.726 million m3,and the calculation result of the numerical simulation of the supplementary displacement was 63.82 million m3, basically consistent with the calculation result of the water balance method. The reservoir storage method has obvious changes to the groundwater level around the reservoir. The simulation results of groundwater numerical model showed that when the reservoir was in normal operation, the leakage of the reservoir was 27.35 million m3; when the reservoir was operated at low water level, the leakage of the reservoir was the smallest, 13.47 million m3. The reservoir has the largest amount of leakage of 41.85 million m3 when operated at water storage level. When the reservoir was operated at the lowest water level, the groundwater level around the reservoir was declining compare to the normal operating water level. The maximum drop of the groundwater observation well was 2.1 m, and the maximum monthly average was 0.99 m. When the reservoir was operating at the normal water storage level, the water level of the groundwater around the reservoir has increased compare to the normal operating water level. The maximum increase of the groundwater observation well was 1.5 m, and the maximum monthly average increase was 0.78 m. The influence of the reservoir on the groundwater level was 2000 m upstream and 12000 m downstream. The research conclusions can provide a scientific reference for the development, utilization and management of regional groundwater.
Keywords: Manas River Basin, water balance, numerical simulation; reservoir regulating, groundwater
DOI: 10.25165/j.ijabe.20201301.4866
Citation: Liu B, He X L. Response of groundwater to the process of reservoirs group regulation and storage in Manas River Basin in Xinjiang. Int J Agric & Biol Eng, 2020; 13(1): 224–233.
1 Introduction
The Manas River Basin, which lies in the northern foothills of the Tianshan Mountains in Xinjiang, is a typical arid inland river basin. The evaporation is large and the precipitation is scarce[1-3], and the distribution of surface water resources is severely uneven. The reservoirs in the basin are alleviating the contradiction between water supply and demand. They also changed the natural water circulation path of the basin and the supply and discharge conditions of groundwater, made the water cycle of the basin more complicated[4-7]. As the main source of water in the Manas River Basin, groundwater was impacted by reservoir regulation on the dynamic changes of groundwater level. It is of great significance
Received date: 2019-03-25 Accepted date: 2020-01-10
Biographies: Bing Liu, PhD candidate, Associate Professor, research interests:
hydrology and water resources, Email: 515441180@qq.com; Guang Yang, PhD, Professor, research interest: ecological hydrological process simulation. Email: mikeyork@163.com.
*Corresponding author: Xinlin He, PhD, Professor, research interests:
hydrology and water resources. College of Water Conservancy and Construction Engineering, Shihezi University, Shihezi 823003, China. Tel: +86-15309934677, Email: hexinlin2002@163.com.
research focused on the interaction between reservoir and groundwater, especially on the influence of reservoir regulation and storage process on groundwater level[21-23].
Numerical simulation is an important method to study the transformation relationship between surface water and groundwater, and has been widely used in the study of the relationship between surface water and groundwater. The effect and accuracy of numerical simulation have also been widely recognized[24-26]. In this study, the plain area of Manas River Basin was taken as the study area. Combined with topographic, geomorphological, hydrogeological, meteorological, hydrological and groundwater dynamic monitoring data in the study area, the recharge, discharge and storage variables of groundwater were analyzed by water balance method, which provided the calculation basis for the numerical simulation of groundwater. A conceptual model and the corresponding mathematical model of groundwater movement in the study area were established, and the mathematical model was solved by Visual MODFLOW. Based on the detection data of groundwater observation wells and the results of groundwater equilibrium calculation as the basis of parameter calibration and verification of the model, the numerical simulation of groundwater in the study area was carried out, and the variation law of groundwater level in the natural state of the basin was studied. The variation law of groundwater level under different operation
schemes of reservoir was simulated, and the influence of reservoir regulation and storage process on groundwater level was analyzed.
2 Materials and methods
2.1 Research area
Manas River Basin is located in the hinterland of Eurasia, the southern margin of Junggar Basin in the northern foot of Tianshan Mountain, Xinjiang. The geographical position is 43°24'-45°12'N and 84°41'-86°32'E. There are mainly four large and medium-sized plain reservoirs in the area. They are Yuejin Reservoir (Y), Jiahezi Reservoir (J), Daquangou Reservoir (D) and Mushroom Lake Reservoir (M). The research scope is the plain area of Manas River Basin, the southern boundary was the dividing line between the plain area of Manas River Basin and the mountain area, and the northern boundary was bounded by the desert edge of Mosuowan irrigation area, Manas River and the 136 regiment of Xiaoguai Irrigation District. The upper reaches of the eastern boundary were bounded by the Manas River, the middle reaches by the Jiahezi Reservoir and the main canal of Mosuowan, and the lower reaches were the main canal of the 148th regiment of the Mosuowan irrigation area. The western border was bounded by the administrative boundary of Kuitun City and Karamay City. Taking the aquifer within 300 m in depth as the calculation object, the equilibrium calculated area was 7698 km2.
Figure 1 Location of study area
2.2 Data source
In the process of the study, hydrogeological data, runoff data, reservoir operation data and irrigation data were mainly used. Hydrogeological data (hydrogeological profiles, hydrogeological parameters and drilling data) were provided by Bingtuan Geological Prospecting Institute. Runoff data (1955-2018) were provided by Shihezi Hydrological and Water Resources Survey Bureau. Reservoir data of operation information (1988-2018) were provided by Shihezi Manas River Basin Management Office. The long-term observation data of groundwater (1988-2018) were provided by Shihezi Water Conservancy Burweau and Zezhong Water supply Company. The exploitation of groundwater (production wells) were provided by Manas River Basin
Management Office.
The version of the software used in this study was Visual MODFLOW 2010.1. The main software modules include MODFLOW module for groundwater flow simulation, MODPATH module for particle trajectory and propagation time simulation, and MT3D module for simulating the transport process of pollutants in groundwater, and the PEST module for parameter and well group optimization.
The verification of simulation accuracy was mainly verified by Ri, ARM, RMS, and NRMS.
Ri = Xical–Xiobs (1)
1
1 n
i i
ARM R
n
2 1 1 n i i RMS R n
(3)max min
( obs) ( obs) RMS NRMS
X X
(4)
where, Ri is residual, Xcal is calculated value, m; Xobs is observed value, m; ARM is average absolute error, m; RMS is root mean square error, m; NRMS is standard root mean square error ratio, %. ARM shows the magnitude of error, and NRMS indicates the amount of error in water level difference.
2.3 Numerical simulation of groundwater
A hydrogeological conceptual model and groundwater mathematical model in the plain area of Manas River Basin were established to accurately reflect the flow process of groundwater at each location, which was solved by numerical method. The results of water equilibrium calculation were compared with those of water equilibrium calculation to calibrate the parameters of the model and verify the accuracy[25,27].
(k H) (k H) (k H) W H
x x y y z z t
( ,x y z, ) D (5)
0 0
( , , )t ( , , )
H x y z H x y z ( ,x y z, ) D (6)
1 1( , , , )
B
H H x y z t ( ,x y z, ) 1B , t (7) 0
2) ( , , , )
B
H
q x y z t x
( , , )x y z B2, t0 (8)
where, D is the seepage area, km2; k is the aquifer permeability coefficient; H is the groundwater head value, m; W is the source confluence, m; μ is the pore medium water storage rate; H0 is the water head distribution value of the initial flow field, m; H1 is the first kind of boundary head distribution value, m; B1 is the first kind of boundary; Q is the second kind of boundary single width flow, m/d; n is the normal direction of the second kind of boundary; and B2 is the second kind of boundary.
The effect of reservoir group regulation and storage on the change of groundwater level in the study area was analyzed using an established and validated model. The centralized distribution and unified dispatching of four large and medium-sized reservoirs, such as the Moguhu reservoir (M), the Daquangou reservoir (D), the Jiahezi reservoir (J) and the Yuejin reservoir (Y) in the plain region of the selected basin, were based on the joint operation schedule of the reservoir and the reservoir operation data of the reservoir in the period of 1998-2016. Three reservoir regulation and storage schemes were selected to simulate the groundwater movement in the research area. Scheme I (operation water level scheme): the reservoir operates according to the normal regulation and storage mode, and the water level of each reservoir was the monthly average water level of the actual operation of the reservoir from 1998 to 2016; Scheme II (low water level scheme): the reservoir operates according to the minimum water level and was always maintained as the water level; Scheme III (high water level scheme): the reservoir operates according to the normal water level and was maintained as the water level.
The simulation time was from January 1, 2015 to December 31, 2015. It was assumed that the other initial conditions, source confluence, parameter values and boundary conditions were consistent except that the water level of the reservoir changes among different schemes.
(1)Generalization of aquifers
According to the three intersecting hydrogeological profiles of the study area, the aquifers in the study area are not complete.
The water exchange of each aquifer in the longitudinal direction makes the aquifers connected with each other, and the aquifers are simply in accordance with the traditional submersible aquifers. The division of weak permeable layer and confined aquifer cannot accurately reflect the hydrogeological characteristics of the study area. The longitudinal depth of 300 m was selected as the simulation range, and according to the actual situation of each hole in the hydrogeological profile, it was divided into 10 aquifers from top to bottom, 17 hydrogeological zones are in each layer.
(2)Spatial discretization processing
The horizontal X direction of the model was 10 946 m, the Y direction was 130 696 m, horizontal direction was divided into 3277 rows, 275 rows, the grid size was 400 m×400 m, the total number of effective elements was 48113, and the area was 7698 km2. The surface elevation of the model was assigned by ARCGIS10.2 after downloading the DEM data from the geo-spatial data cloud website, and the thickness of each aquifer was consistent with the hydro-geological division.
(3)Selection of initial conditions.
The groundwater level of January 1, 2016 was taken as the initial water level of the model, the measured water level of the observation wells in the study area was interpolation by the natural approach interpolation method of Visual MODFOW software.
(4)Calibration and Verification of parameters
There were 12 stress periods in the model. The time step was 1 day, and the solver was WHS solver. The parameters that needed to be calibrated were permeability coefficient k and water supply μ. The best combination of parameters was found out in the range of parameters by combining automatic parameter adjustment and manual parameter adjustment of the model. The aquifer parameter values of the model were shown in Table 1.
3 Results and discussions
3.1 Water level fitting
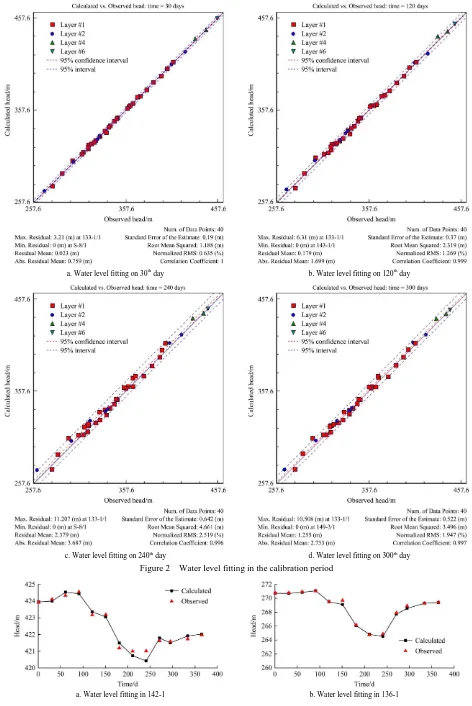
The rate of the model was from January 1 to December 31, 2016. After the parameters were calibrated, the water level fitting diagrams of the model were shown in Figure 2.
According to the fitting (Figure 2) between the simulated head and the observed head, it can be seen that the correlation coefficient between the simulated head and the head of groundwater level was above 0.99, and the standard root mean square error was less than 3% in 30 d, 120 d, 240 d and 300 d. The simulated values and the observed values were closely distributed on the diagonal line, which shows that the calculated values of the model have a high degree of fitting with the observed values, and the model was reliable.
According to the geological characteristics of the study area, groundwater observation wells were extracted to compare the simulated water level with the observed water level. It can be seen from Figure 3 that the variation trend of simulated water level was consistent with that of observed water level, and only a few points have more than 1 m errors in some months. Generally, the simulation accuracy was high and the reliability was very good.
3.2 Rate periodic water equilibrium analysis
simulation was – 69.27 million m3, which was closer to the value of storage variables caused by the decrease of groundwater level
than that of water equilibrium method. The results show that the model was reliable and the simulation accuracy was good.
a. Water level fitting on 30th day b. Water level fitting on 120th day
c. Water level fitting on 240th day d. Water level fitting on 300th day Figure 2 Water level fitting in the calibration period
c. Water level fitting in 144-1 d. Water level fitting in S-2
Figure 3 Observed water level and simulated water level fitting of groundwater observation wells in calibration period Model verification was applied to verify the accuracy of model
parameters and the stability of model operation. The verification period was from January 1 to December 31, 2017, and the measured groundwater level on January 1, 2017 was taken as the initial water level. The values of each source and sink were based on the measured
data in 2017, and the parameter utilization rate of the model was determined. The operating conditions were in good agreement with the rate on a regular basis. The groundwater level depth map, water level fitting map and some observation well water level fitting maps of the verification period model are shown in Figure 4.
a. Water level fitting on 30th day b.Water level fitting on 120th day
From Figure 4, it can be seen that the groundwater level in the study area decrease during the 2017 was 15 million m3 higher than that in 2016. The simulation results are in good agreement with the actual situation. The dynamic variation of groundwater level in the verification period was regularly consistent with the rate. The period of high water level was mainly April and the period of low water level was mainly August. The correlation coefficient between the observed water level and the simulated water level was above 0.99, the standard root mean square error was less than 3%, and the head error was within a reasonable range. The law of transformation was consistent and the simulation error was small. The results of model verification showed that the calibrated model had high reliability. Meanwhile, the division of aquifers, the selection of parameters, the correct setting of boundary conditions, and the strong stability of the model can accurately reflect the characteristics of groundwater flow system in the study area. It can be used to simulate groundwater movement in the study.
3.3 Simulation verification
January 1 was taken as the initial calculation time, and the simulated groundwater levels in April and May were the highest water levels, August and September were the lowest water level periods in one year. From January to March, the recharge and discharge remain in a relatively stable state. The fluctuation range
of groundwater level was small. In April, the groundwater recharge increased obviously, while at the beginning of spring irrigation, the crop water demand was not large and the increase of groundwater exploitation was not obvious. So the highest water level appeared in April and May. From June to August, when the temperature rises, the evaporation also increases, and this period was the peak period of crop water demand, the exploitation of groundwater was also clear. The groundwater level decreased significantly, and the lowest water level appeared in August and September. The groundwater level also decreased by 5-10 m compared with that in April. From September to December, the agricultural water demand decreased rapidly after harvest, and the amount of groundwater exploitation decreased. With the replenishment of runoff and leakage, the groundwater level continued to rise, and basically returned to the initial level at the end of the calculation period. The variation law of groundwater level shows obvious mining-irrigation characteristics, the simulation results are the same as the actual groundwater level, and the simulated flow field of groundwater was consistent with the actual flow field.
3.4 Variation of groundwater level under different reservoir regulation and storage schemes
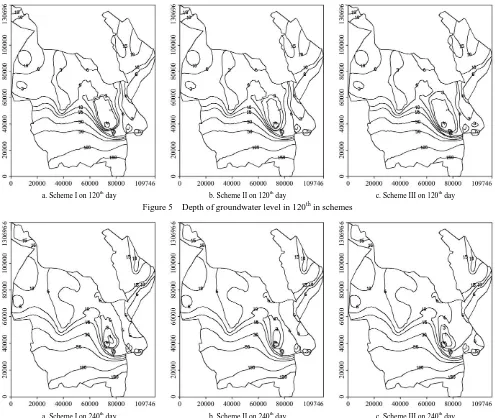
The groundwater levels simulated in the study area under three different schemes were shown in Figures 5-8.
a. Scheme I on 120th day b. Scheme II on 120th day c. Scheme III on 120th day
Figure 5 Depth of groundwater level in 120th in schemes
a. Scheme I on 300th day b. Scheme II on 300th day c. Scheme III on 300th day a. Scheme I on 300th day b. Scheme II on 300th day c. Scheme III on 300th day
Figure 7 Depth of groundwater level in 300th in schemes
a. Simulated water levels in S-2 (<3 km) b. Simulated water levels in S-4 (<3 km, >5 km)
c. Simulated water levels in S-1 (<5 km, >7 km) d. Simulated water levels in 147-1 (>12 km) Figure 8 Simulated water levels of groundwater observation wells in Schemes
On the 120th day, the depth of the groundwater level in the upper reaches of the three schemes was small, but the depth of the groundwater level in the periphery of the reservoir and the downstream area was obviously changed. Compared with the Scheme I, the groundwater level in the periphery of the second reservoir and the downstream of 5000 m in the downstream of the project was slightly decreased. However, the variation range was not large, and the falling amplitude was about 1 m. The groundwater level raised in the range of 2000 m in the upstream of the reservoirs, and the increase was less than 1 m. Meanwhile, the water level in the periphery of the reservoir was also raised. The groundwater level within the range of 3000 m in the downstream of the reservoir increased by about 2-3 m, the water in the range of 3000-10 000 m in the downstream of the reservoir increased by about 1 m, and the level of the groundwater level for
between the case 2 and the Scheme I on 300th day was significantly greater than that of both 120th and 240th days, and the influence distance was also greater at 120th and 240th day. Compared with the Scheme I, the groundwater depth of Scheme III in the range of 2000 m upstream of the reservoir was up to about 1 m. The groundwater level increases by 1-3 m in the area of the reservoir and the downstream of the reservoir, the increase of the local area was more than 3 m, and the depth of the groundwater table was less than 1m. It was also indicated that the overflow of the spring was increased; in the range of 3000-8000 m in the downstream, the depth of the groundwater increased by about 1 m. The water level between the two schemes at 240th days have obvious difference; the groundwater level difference between the Scheme III and the Scheme I were close to the 120th day at the 300th day, but the influence range was slightly expanded over 120th day. The farthest range of the groundwater level change was approximately 12 000 m downstream.
According to the analysis, it can be seen that the maximum influence range of groundwater level under three different reservoir storage schemes was 2000 m upstream and 12 000 m downstream. When the groundwater level was closer to the reservoir, it has greater influence on the reservoir operation scheme, and the distance and time affected by different regulation and storage schemes are different. According to the variation map of groundwater depth under different schemes, it was found that the groundwater level outside 5000 m upstream of the reservoir has no obvious change.
The simulated water levels of 4 groundwater observation well S-2 (near the reservoir), S-4 (4000 m downstream of the reservoir), S-1 (7600 m downstream of the reservoir) and 147-1 (12 000 m downstream of the reservoirs) at 400 m under different schemes were analyzed, result was shown in Figure 10. The groundwater level of the Scheme II was lower than that of the Scheme I, and the groundwater level was decreased gradually. The most significant decrease in the 4 observation wells was the S-4 in the vicinity of the reservoir, the maximum decrease was 2.1 m. The average decrease of S-4 was 0.82 m in the S-4 month, and the average decrease of S-1 in the month of S-1 was 0.99 m. The monthly average decrease of S-2 was 0.83 m, and the maximum impact distance of Scheme II was 1000 m upstream of the reservoir and 9000 m downstream of the reservoir. The groundwater level of Scheme III was higher than that of Scheme I in April and December. The average increase of ground water level was 0.78 m in S-4, 0.78 m in S-2, 0.56 m in S-1, and 0.11 m in 147-1. The maximum impact distance of the Scheme III was 2000 m upstream and 12 000 m downstream of the reservoir.
4 Discussion
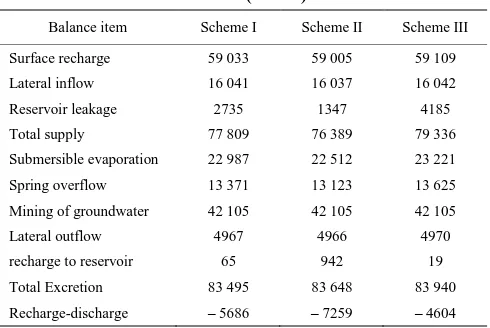
Variation of groundwater quantity existed under different reservoir regulation and storage schemes. The calculation results of the groundwater balance under each scheme are shown in Table 1.
It can be seen from Table 1 that with the increase of reservoir water level, the total recharge also showed an increasing trend, the largest increase was the reservoir leakage. Compared with Scheme I, the leakage of Scheme II was reduced by 51%, and the leakage of Scheme III was increased by 53%. The surface recharge also increases slightly with the increase of reservoir water level. Compared with Scheme I, the cathedral recharge of Scheme II was reduced by 280 000 m3, and the recharge of Scheme III was increased by 760 000 m3. The lateral inflow of
groundwater varies slightly among the three Schemes, which can be ignored.
Table 1 Calculation table of groundwater balance in different schemes (104 m3)
Balance item Scheme I Scheme II Scheme III
Surface recharge 59 033 59 005 59 109
Lateral inflow 16 041 16 037 16 042
Reservoir leakage 2735 1347 4185
Total supply 77 809 76 389 79 336
Submersible evaporation 22 987 22 512 23 221
Spring overflow 13 371 13 123 13 625
Mining of groundwater 42 105 42 105 42 105
Lateral outflow 4967 4966 4970
recharge to reservoir 65 942 19
Total Excretion 83 495 83 648 83 940
Recharge-discharge – 5686 – 7259 – 4604 Compared with Scheme I, the total excretion of both Scheme II and Scheme III increased. With the increase of reservoir water level, evaporation and spring overflow showed an upward trend. Compared with Scheme I, the evaporation of Scheme II was reduced by 4.75 million m3, the overflow of spring water was reduced by 2.48 million m3, the evaporation of Scheme III was increased by 2.24 million m3, and the overflow of spring water was increased by 2.54 million m3.
With the increase of reservoir water level, the amount of groundwater recharge reservoir decreases obviously. In Scheme II, the recharge of groundwater to reservoir was 9.42 million m3, and the recharge of groundwater to reservoir was below 1 million m3. Through the calculation results of the model, it can be seen that under the three reservoir regulation and storage Schemes, the most obvious variations were the reservoir leakage, groundwater recharge to the reservoir, evaporation and spring water overflow. Higher water level of the reservoir leads to greater leakage of the reservoir, greater evaporation of the water surface, and smaller recharge of groundwater to the reservoir. The leakage of the reservoir makes the groundwater level around the reservoir raise, the amount of submersible evaporation also increases, and the overflow of spring water increases with the increase of groundwater level. Therefore, under different working conditions, the most important change factors were reservoir leakage and groundwater recharge to reservoir, and the rest were affected by these two changes, so different reservoir transportation will be carried out. Under the schemes, the exchange capacity between reservoir water and groundwater was analyzed month by month in order to explore the influence of reservoir regulation and storage process on the change of groundwater level.
5 Conclusions
Based on the data of topography, hydrogeology and groundwater dynamic observation in the study area, the groundwater flow model in the plain area of Manas River Basin was established by numerical simulation method, and the influence of reservoir regulation and storage process on groundwater level in Manas River Basin was studied. The main results are as follows:
in most areas. Settlement results of numerical Simulation and calculation of traditional Water balance method. The results are basically consistent and the errors are within 10%.
(2)The results of numerical simulation showed that the groundwater recharge items in the study area are mainly surface recharge, groundwater lateral inflow and reservoir leakage recharge account for 75.19%, 21.22% and 3.60% of the total recharge, respectively. The main groundwater discharge items in the study area are groundwater exploitation, evaporation, spring water overflow and groundwater lateral discharge, which account for 27.07%, 16.08%, 50.90% and 5.95% of the total discharge, respectively. The groundwater in the study area was in a negative equilibrium state, and the difference of replenishment and discharge was 69.27 million m3.
(3) According to the calibration and verification of groundwater numerical model, the variation of groundwater level under different reservoir regulation and storage schemes was studied. When the reservoir was in normal operation, the leakage of the reservoir was 27.35 million m3; when the reservoir was operated at the lowest water level, the leakage of the reservoir was the smallest, 13.47 million m3; when the reservoirs are always running at the normal water level, the leakage of the reservoir was the largest, 41.85 million m3. When the reservoirs run at the lowest water level, the groundwater level around the reservoir decreased compare to the normal operating water level, the maximum drop of groundwater observation well was 2.1 m, and the maximum monthly average drop was 0.99 m. When the reservoirs are always running at the normal water level, the groundwater level around the reservoir increases compare to the normal operating water level. The maximum increase of groundwater observation well was 1.5 m, and the maximum monthly average increase was 0.78 m.
(4) The reservoir regulation and storage mode has obvious influence on the change of groundwater level around the reservoir. Closer distance makes greater influence by the reservoir regulation and storage, and the reservoir regulation and storage has little influence on the upstream and the downstream of the reservoir. The results of numerical simulation show that the maximum influence distance of the reservoir regulation and storage process on the groundwater level was 2000 m upstream and 12 000 m downstream. The dynamic change of groundwater around the reservoir was affected by the reservoir regulation and storage mode and groundwater exploitation. Reducing the leakage of the reservoir through engineering and management measures was beneficial to improve the degree of soil salinization around the reservoir and improve the comprehensive utilization benefit of the reservoirs.
Acknowledgements
This study was financially supported by the National key R & D Program (NO.2017YFC0404304) and Key projects of Xinjiang Joint Foundation of National Natural Science Foundation of China(No.U1803244 ),and The National Natural Science Fund of China (No.51469028).
[References]
[1] Bai M, Sui Y J. Dynamic variation characteristics and influencing factors of groundwater level in plain area of Manas River Basin. Water Resources Research, 2005; 3: 20–21. (in Chinese)
[2] Li W Y. The effect of human activities on the water circulation in the plain area of the oasis in the Mahe River Basin. Shihezi University, 2016.
(in Chinese)
[3] Liu H L, Chen X, Bao A M, Bao A M, Wang L. Investigation of groundwater response to overland flow and topography using a coupled MIKE SHE/MIKE 11 modeling system for an arid watershed. Journal of Hydrology, 2007; 347(3-4): 448–459.
[4] Lu C Y, Sun Q Y, Li H, Gai Y R. Evaluation of groundwater recharge in arid and semi-arid areas based on water cycle simulation. Journal of Water Conservancy, 2014; 45(6): 701–711. (in Chinese)
[5] Sophocleous M. Interactions between groundwater and surface water: the state of the science. Hydrogeology Journal, 2002; 10(2): 348–348.、
[6] Zhao B F, Kang W D, Zhutian D W, Ma L J. Identification of aquifer parameters based on numerical simulation. Journal of Earth Sciences and the Environment, 2009; 31(4): 409–412. (in Chinese)
[7] Shu L C, Tao Y F, Liu P G. Reliability calculation of groundwater recharge considering uncertainty of hydrogeological parameters. Journal of Water Conservancy, 2008; 39(3): 346–350.
[8] Winter T C. Relation of streams, lakes, and wetlands to groundwater flow systems. Hydrogeology Journal, 1999; 7(1): 28–45.
[9] Winter T C, Buso D C, Shattuck P C, Harte P T, Vroblesky D A, Goode D J. The effect of terrace geology on ground‐water movement and on the interaction of ground water and surface water on a mountainside near Mirror Lake, New Hampshire, USA. Hydrological Processes, 2008; 22(1): 21–32.
[10] Singh A, Bürger C M, Cirpka O A. Optimized sustainable groundwater extraction management: General approach and application to the city of Lucknow, India. Water Resources Management, 2013; 27(12): 4349– 4368.
[11] Liu L G, Cui Y L, Luo Y F. Groundwater management strategy of irrigation district based on Modflow-taking Liuyuankou Irrigation area as an example. Journal of Wuhan University: Engineering Edition, 2010; 43(1): 25–29. (in Chinese)
[12] Cheng L, Xu Z X, Luo R, Mi Y J. The application of SWAT in arid and semi-arid areas-A case study of Kuye River Basin. Geographical Study, 2009; 28(1): 65–73. (in Chinese)
[13] Cheng C L, Shu L C, Lu C P, Chen R B. MODFLOW and LAK3 are used to calculate the leakage of reservoir. Engineering Survey, 2013; 7: 31–34. (in Chinese)
[14] Zhang F, Weng H X, Chen L Q, Ji Z Q, Zhang Z Q. A simulated experimental study on the variation of mixed nutrients in seafloor groundwater and seawater. Journal of Oceanography (Chinese Edition), 2010; 3: 167–175. (in Chinese)
[15] Yuan R Q, Song X F, Wang P, Zhang Y H, Wang S Q, Tang C Y. Effects of Baiyangdian Lake leakage on peripheral groundwater. Advances in Water Science, 2012; 23(6): 751–756. (in Chinese)
[16] Kim N W, Chung I M, Won Y S, Arnold J G. Development and application of the integrated SWAT-MODFLOW model. Journal of Hydrology, 2008; 356(1-2): 1–16.
[17] Mälkönen E, Derome J, Fritze H, Helmisaari H S, Kukkola M, Saarsalmi A, et al. Compensatory fertilization of Scots pine stands polluted by heavy metals. Nutrient Cycling in Agroecosystems, 1999; 55(3): 239–268.
[18] Restrepo J I, Montoya A M, Obeysekera J. A wetland simulation module for the MODFLOW ground water model. Ground Water, 2010; 36(5): 764–770.
[19] Zhang H M, Yang J T, Baartman J E M, Li S Q, Geissen V. Quality of terrestrial data derived from UAV photogrammetry: A case study of Hetao irrigation district in Northern China. Int J Agric & Biol Eng, 2018; 11(3): 171–177.
[20] Guzman J. Integrated SWAT-modflow modeling framework: Modeling multiple disconnected surface watersheds on a single subsurface aquifer extent. International Journal of High Speed Electronics and Systems, 2000; 10(1): 247–253.
[21] Sakakibara K, Tsujimura M, Song X F, Zhang J. Spatiotemporal variation of the surface water effect on the groundwater recharge in a low-precipitation region: application of the multi-tracer approach to the Taihang Mountains, North China. 2017; 545: 132–144.
[22] Ravikumar P, Somashekar R K. Assessment and modelling of groundwater quality data and evaluation of their corrosiveness and scaling potential using environmetric methods in Bangalore South Taluk, Karnataka State, India. Water Resources, 2012; 39(4): 446–473. [23] Huang T M, Pang Z H, Liu J L, Ma J Z, Gates J. Groundwater recharge
insights from environmental tracers. Hydrogeology Journal, 2017; 25(7): 2049–2065.
[24] Scanlon B R, Keese K E, Flint A L, Flint L E, Simmers I. Global synthesis of groundwater recharge in semiarid and arid regions. Hydrological Processes, 2006; 20(15): 3335–3370.
[25] Chen X, Chen X H. Numerical simulation and water balance analysis of groundwater in sand hills area, USA. Advances in Water Science, 2004; 15(1): 94–99. (in Chinese)
[26] anks E W, Brunner P, Simmons C T. Vegetation controls on variably saturated processes between surface water and groundwater and their impact on the state of connection. Water Resources Research, 2011; 47(11): 11517.