Cancer Cell International 2002,
2 x
Primary research
Possible attenuation of the G2 DNA damage cell cycle checkpoint
in HeLa cells by extremely low frequency (ELF) electromagnetic
fields
Paul A Harris*
1
, Justin Lamb
2
, Brian Heaton
3
and Denys N Wheatley
4
Address: 1Section of Surgery, Division of Clinical Sciences (University of Sheffield), Clinical Sciences Centre, Northern General Hospital, Herries
Road, Sheffield, S5 7AU, UK, 2Department of Adult Oncology, Dana Farber Cancer Institute, 44 Binney Street, Boston, MA 02115, USA, 3Department of BioMedical Physics and BioEngineering, University Medical Buildings, Foresterhill, Aberdeen AB25 2ZD, UK and 4Department of
Cell Pathology, University of Aberdeen, MacRobert Building, 581 King Street, Aberdeen AB24 5UA, UK
E-mail: Paul A Harris* - [email protected]; Justin Lamb - [email protected]; Brian Heaton - [email protected]; Denys N Wheatley - [email protected]
*Corresponding author
Abstract
Background: The issue remains unresolved as to whether low frequency magnetic fields can affect cell behaviour, with the possibility that they may be in part responsible for the increased incidence of leukaemia in parts of the population exposed to them.
Methods: Combined treatment of HeLa cells with gamma-irradiation (1, 3 and 5 Grays) and extra low frequency magnetic fields of ~50 Hz was carried out under rigorously controlled conditions.
Results: Synchronised cells progressing from S-phase arrived at mitosis on average marginally ahead of irradiation controls not exposed to ELF. In no instance out of a total of twenty separate experiments did this "double-insult" further delay entry of cells into mitosis, as had been anticipated.
Conclusion: This apparently "non-genotoxic" agent (ELF) appears to be capable of affecting cells that would normally arrest for longer in G2, suggesting a weakening of the stringency of the late cycle (G2) checkpoint.
Introduction
Some epidemiological studies purport to show a relation-ship between cancer incidence and environmental expo-sure to extremely low frequency (ELF) electromagnetic fields (EMFs) [1,2]. Others have failed to find a correla-tion [3,4], and Campion [5] and more recently Park [6] have concluded that any association is probably far too tenuous and insignificant to warrant further investigation. The inability of laboratory studies to provide convincing
evidence that ELF fields can alter cells seems to support such a view. Negative evidence proves little, and despite such statements, a nagging concern that some as yet unex-plained ability of ELF-EMFs to modify cellular processes, such as implied by the enhancement ("promotion"?) of leukemogenesis in man. Without some clear endpoint to measure, few have known where to begin in a systematic laboratory approach, which is made worse by the lack of a tangible hypothesis.
Published: 7 May 2002
Cancer Cell International 2002, 2:3
Received: 28 February 2002 Accepted: 7 May 2002
This article is available from: http://www.cancerci.com/content/2/1/3
Ionising radiation is undoubtedly associated with car-cinogenesis, since it is known to increase the rate of genet-ic mutation and thus the incidence of cellular defects leading to the emergence of malignant phenotypes. Envi-ronmental exposure to ELF-EMFs is reputedly far too weak to cause genetic damage [7] and in vitro assays of muta-genicity have been negative [8]. However, since not all car-cinogens have to be genotoxic, it is possible that some agents participate indirectly in the induction of genetic changes required to bring about carcinogenesis. The spon-taneous gene mutation rate in human cells is high and mechanisms operate which repair these errors, thereby re-ducing genomic instability, with the incidence of cancer being orders of magnitude higher in their absence [9]. Damaged cells can either engage a programmed cell death pathway, effectively committing suicide [10,11], or arrest in cycle until the damage is repaired during the "time-out" response to the so-called DNA damage cell cycle check-points [12,13]. While both mechanisms help maintain ge-nomic stability, they themselves are targets for non-genotoxic carcinogens.
Of the two main checkpoints, the one in G1 largely pre-vents duplication of genetic errors, whilst the one in G2 stops cells entering mitosis with damaged chromosomes. Loss of checkpoint stringency is a feature of oncogenic transformation [14,15]; the gene encoding the p53 tu-mour suppressor that plays such a pivotal role in the G1 DNA damage checkpoint is mutated in >50% of human cancers [16], with inactivation of the protein itself by as-sociation with viral oncoproteins accounting for many others. Indeed, p53 knock-out mice spontaneously devel-op a high frequency of tumours [17,18] due to failure in G1 arrest following DNA damage [19,20], with a resultant predisposition to gene amplification and genetic instabil-ity [21,22]. Conversely, if "proliferative impetus" is main-tained when cells should have arrested in their cycle because of reduced checkpoint stringency, this may lead to the propagation of either somatic or induced muta-tions, which is a hypothetical mechanism for non-genoto-xic carcinogenicity.
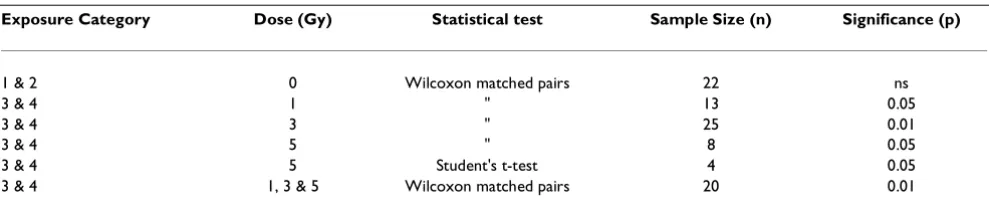
Table 1: Statistics applied to flow cytometry data
Exposure Category Dose (Gy) Statistical test Sample Size (n) Significance (p)
1 & 2 0 Wilcoxon matched pairs 22 ns
3 & 4 1 " 13 0.05
3 & 4 3 " 25 0.01
3 & 4 5 " 8 0.05
3 & 4 5 Student's t-test 4 0.05
3 & 4 1, 3 & 5 Wilcoxon matched pairs 20 0.01
Table 2: Perpendicular components of background time-varying and static magnetic fields measured at location of sample holders
Component of System Active (Yes/No) Time-Varying Field Static Field
coils A,B no 3nT 50.3 µT
coils C,D no 3nT 45.6 µT
Amplifier and Signal Generator no
coils A,B no 3nT
coils C,D no 3nT
Amplifier and Signal Generator yes
coils A,B yes 2mT*
coils C,D no 0.38 µT*
Amplifier and Signal Generator yes
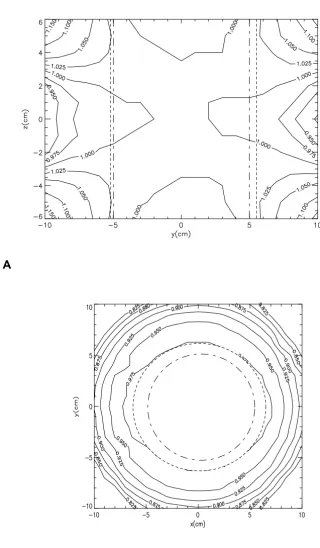
Figure 1
A : Magnetic field distribution in the vertical plane; (- - - - -) represents the boundary of the ± 2.5% cylindrical uniform magnetic field; (- - -) represents the boundary of the sample holder. B: Magnetic field distribution in the horizontal plane demonstrating cylindrical symmetry; (- - - -) represents the boundary of the ± 2.5% cylindrical uniform magnetic field; (- - -) represents the boundary of the sample holder.
A
Extensive cell proliferation studies that we have carried out over nearly 5 years have yielded only negative results when cells have been exposed to 50 Hz, 2mT magnetic fields for up to 72 h, i.e. no discernible effect of the fields. In agreement with the majority of published results, stud-ies on the growth-related enzyme, ornithine decarboxyla-se, in murine L929 fibroblasts show it was unaffected [[23], and unpublished data], contrary to the findings of Litowitz et al. [24]. However, when cells were subjected to a mild thermal stress (39°C) at the same time as being ex-posed to 50 Hz magnetic fields for up to 72 h, a small in-crease in the rate of proliferation was noted compared to cultures subjected to only the small rise in temperature [23]. This effect was seen for magnetic field intensities ranging from 100 µT to 2mT and suggests that cell prolif-eration/behaviour could be modified by ELFs in cells al-ready responding to another environmental stress. Two previous reports have explored a similar approach. Hintenlang [25] found an increase in near tetraploid chro-mosome complements in human lymphocytes irradiated with doses of up to 4Gy from a 137Cs source which were
subsequently cultured in 60 Hz magnetic fields of up to 1.4mT, providing evidence that cellular mechanisms of ra-diation damaged cells could be modulated. And Rosenthal and Obe [26] found a significant increase in the frequency of sister chromatid exchanges in human lym-phocytes pre-treated with antineoplastic drugs and subse-quently cultured in a 5mT 50 Hz field, which is highly relevant to our finding (see Discussion). We surmised that a double insult would further delay the entry of irradiated cells into division in synchronized HeLa cultures when an ELF magnetic field was also applied.
Results and discussion
ELF EMFs and premitotic delay following genotoxic stress
HeLa cells are demonstrably deficient in the G1 DNA damage cell cycle checkpoint [27] due to PHV E6 inactiva-tion of p53 [29,30], allowing the effect of magnetic field exposure on the stringency of the G2 DNA damage check-point to be analysed in isolation. The G2 block is a univer-sal cell response to DNA damaging agents [31–34], showing that this checkpoint is susceptible to partial loss of stringency rather than complete inactivation. Cells re-leased from double thymidine block were irradiated 4 h later in mid-S phase with 1, 3 or 5 Grays of gamma radia-tion. These levels might be considered high in these stud-ies, but were chosen after preliminary experiments were done because they produced the most consistent delays in the entry of cells into mitosis. Once irradiated, the incuba-tion was continued with or without continuous incident magnetic fields, and the appearance of post-mitotic G1 cells was monitored by flow cytometry at various times up to a maximum of 24 h (field characteristics shown in Fig 1; see Material and Methods section).
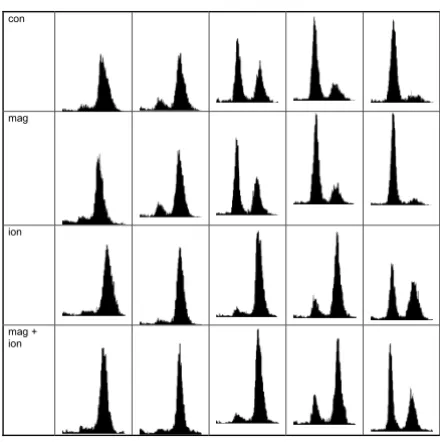
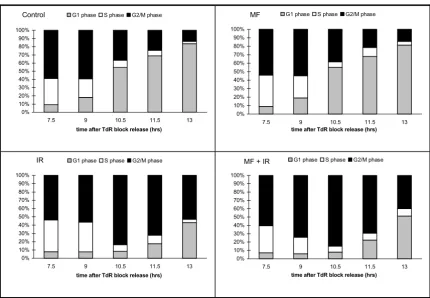
Figures 2 to 8 show the results as determined by flow cy-tometry. Cells released from the double thymidine block at time-zero that had not been exposed to gamma-radia-tion (Group1) completed mitosis on schedule within 12 h [27]. The magnetic fields of 2mT (Group 2) had no ef-fect on their progression into division. Gamma-irradiated cells slowly regained their ability to enter and complete M-phase, but were considerably delayed compared to Groups 1 and 2, as seen in the subsequent 24 h follow-up period (Group 3).
Irradiated cells that were also incubated in the presence of a 2mT magnetic field (Group 4) similarly showed a con-siderable delay in progressing through mitosis. However, decomposition of the flow-cytometry histograms suggests that the cells were entering G1 earlier that their matched controls (Group 3), which would only be consistent with a reduced G2 checkpoint stringency. Further, this effect was more prominent with increasing doses of gamma radia-tion. Out of a total of over 20 experiments, 80% showed this effect; equally noteworthy is that in no experiment was the reverse seen. Table 1 gives the statistical analysis showing the significant difference between Groups 3 and 4.
Further comments
ELF-EMFs of environmentally significant field strengths (~2mT) shortens the pre-mitotic delay following DNA damage in HeLa cell cultures prevented from reaching
mi-Figure 2
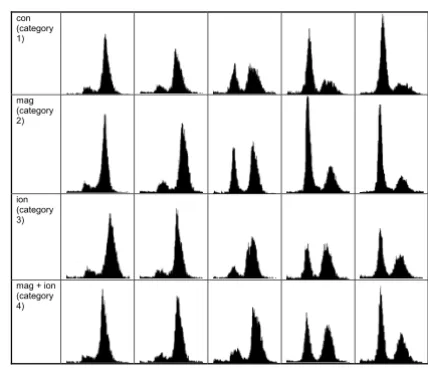
Flow cytometry histograms of synchronised HeLa S3 cells. From left to right the histograms correspond to 7.5, 9, 10.5, 11.5 and 13 h after release of the second thymidine block. Categories 3 and 4 have been irradiated with a dose of 1 Gy in early S-phase.
con (category 1)
mag (category 2)
ion (category 3)
tosis on schedule by gamma-irradiation. Since EMF treat-ment alone lacked any discernible effect, it is clear from this work, as in our previous studies, that biological sys-tems like this have to be rendered exquisitively sensitive to environmental agents before any discernible effect of an agency such as ELF-EMFs might be detected. In human populations at risk to leukemia, irrespective of the causa-tive agent or the genetic disposition of the individuals to this disorder, a low but consistent frequency of cancer it-self indicates that the system is delicately poised, and
hence the influences of a non-genotoxic agent, such as ELF-EMFs, could operate by compromising the late cycle checkpoint under these circumstances. Such an effect might well be "felt" in a population in which the back-ground incidence of cancer in the most susceptible early age-groups was low, even with an apparent doubling in the incidence of the disease. Furthermore, if attenuation of the G2 checkpoint can be implicated as one possibility, by inference it follows that the same is probably true of at-tenuation of the other major cell cycle checkpoint in G1
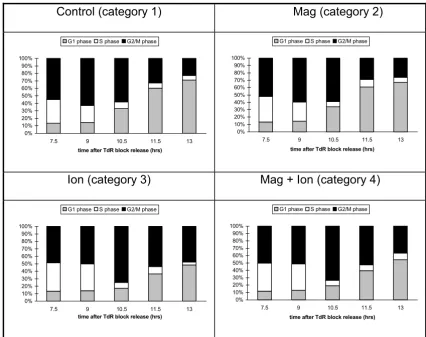
Figure 3
Bar charts illustrating the proportion of cells at different stages in the cell cycle derived from the decomposition of flow cytom-etry histograms. Irradiated cells have been given 1 Gy in early S-phase.
Control (category 1)
Mag (category 2)
0% 10% 20% 30% 40% 50% 60% 70% 80% 90% 100%
7.5 9 10.5 11.5 13
time after TdR block release (hrs)
G1 phase S phase G2/M phase
0% 10% 20% 30% 40% 50% 60% 70% 80% 90% 100%
7.5 9 10.5 11.5 13
time after TdR block release (hrs)
G1 phase S phase G2/M phase
Ion (category 3)
Mag + Ion (category 4)
0% 10% 20% 30% 40% 50% 60% 70% 80% 90% 100%
7.5 9 10.5 11.5 13
time after TdR block release (hrs)
G1 phase S phase G2/M phase
0% 10% 20% 30% 40% 50% 60% 70% 80% 90% 100%
7.5 9 10.5 11.5 13
time after TdR block release (hrs)
(the R or Restriction Point), shown to be exacerbated by the action of non-genotoxic agents such as phenobarbital by Gonzales et al. [35]. This has in fact been proposed as the primary mechanism of this drug's well-recognised ef-fect on carcinogenesis. Thus deficiencies in crucial cell cy-cle control mechanisms allow the propagation of genetic defects and contribute to the increased genetic instability leading to cancer. These observations therefore define a
novel and plausible mechanism by which ELF-EMFs might
also be included as a non-genotoxic carcinogen. Despite the "artificiality" of our test system and the levels of these agencies being considerably above those that might be en-countered in nature, the very fact that delay in mitosis is not exacerbated by a double insult, but in general is re-duced, has obvious implications which cannot be ignored, even if these findings are in no way directly translatable into possible environmental reasons for increased "geno-toxic"/carcinogenic sequelae.
To date we have no explanation as to how these EMFs might alter pre-mitotic activity at the molecular level. Pre-vious data on the effects of ELF in synchronised Tetrahyme-na cell cultures seemed to indicate the initially expected extra delay caused by a second insult. However, these or-ganisms are exceedingly sensitive to heat and a 1.6°C rise in temperature in the active coil delivering ELFs was found to be responsible [36]. We have circumvented this
prob-lem here by introducing fans that stabilise the tempera-tures within the active and inactive coils at exactly the same level within the hot room, and allow us to adjust down the room temperature should it rise to an unaccept-able level. But the involvement of a very small heat-shock is much less likely to affect mammalian cells, many of which have a growth optimum of ~38.5°C. Since the usual outcome of raised temperatures is an exacerbation of any additional physical or chemical insult on the cells, ELF once again seems to be doing the very opposite in our ex-periments by reducing rather than further protracting the inevitable delay due to irradiation. In brief, the differences between Groups 3 and 4 cannot be attributed to tempera-ture asymmetry.
We surmised that cyclin B/p34cdc2 kinase activity would
show no difference between Groups 1 and 2, indicating that ELFs alone do not increase kinase activity. The G2/M transition is catalysed by cyclin-dependent kinase (cdk) (p34cdc2) [37], activity of which is principally regulated by
association with cyclin B [38] and a series of phosphoryla-tion/ dephosphorylation reactions [39,40]. In Groups 3 and 4 we had initially expected a drop in kinase activity following irradiation followed by a steady rise with time as the delay elapsed and cells prepared for division. But in three all experiments performed, we found that Group 4 kinase activity, assayed by a modification of the method of Matsushime et al. [41], rose above that in Group 3 at an earlier time (6 h), commensurate with a faster transit into division. However, these experiments did not show statis-tically significant elevations in each case, hence more con-clusive results cannot be reached until further work is done. However, it can be reported that in no instance has the cyclin kinase activity of ELF-exposed cells lagged be-hind the sham-exposed controls in either the X-irradiated or non-X-irradiated groups. An increase in cyclin B phos-phorylation would be commensurate with a shortening in ELF-EMF treated cells of the G2 delay, and would confirm the otherwise seemingly counterintuitive finding to the expected further protraction of this period, and implicat-ing magnetic field in reducimplicat-ing the strimplicat-ingency of the G2 checkpoint.
Increase in cyclin B and/or cdk1 expression demonstrably accelerates G2 progression, and clearly more exacting work now needs to be done on gene expression under these conditions, with emphasis on expression of the mRNA of these proteins. The absence of an observable ef-fect upon unirradiated cultures implicates the arrest-re-sponse mechanism itself (i.e. the damage sensor, the signal transduction pathway, cak inhibition, or whatever) as the primary site of action. While these processes remain relatively obscure, others have reported that magnetic fields can have profound effects upon a diverse group of cellular processes. Therefore interrogation of this control
Figure 4
Flow cytometry histograms of synchronised HeLa S3 cells. From left to right the histograms correspond to 7.5, 9, 10.5, 11.5 and 13 h after release of the second thymidine block. Categories 3 and 4 have been irradiated with a dose of 3 Gy in late S/early G2 phase.
con
mag
ion
complex and its suspected modulation by ELF is an im-portant focus for future work. At present it is unlikely that these studies can be repeated and extended to test our hy-pothesis, unless more serious attention is paid to its impli-cation.
We also concede that at present these time-consuming ex-periments have allowed us little opportunity to explore more comprehensively doses levels and different treat-ment schedules using the two agencies. Also agencies oth-er than gamma-irradiation need to be carefully considered. Nevertheless, we believe that our data demon-strates for the first time an unanticipated effect of ELF on a cellular response to incipient injury. The hypothesis that ELF might be capable of exacerbating an inherent or in-duced genetic instability by reducing or attenuating the
stringency of the late-cycle (G2) checkpoint, allowing cells to progress into and sometimes through mitosis before pmitotic inflicted damage has been adequately re-paired, may well be testable in other more sensitive ways and within other systems.
We concede, however, that we have not demonstrated that ELF increases the incidence of cellular transformation. In-deed, our cell system – which already exhibits a highly de-ranged malignant phenotype – might be considered a far less acceptable cell type than normal phenotypes which have been chosen for such demonstrations in other cell systems [24,36]. Equally, the absence of a functional G1 DNA damage control and the lowered stringency of the G2 checkpoint in HeLa cells (although the relative "intact-ness" of the G2 checkpoint cannot be disputed since these
Figure 5
Bar charts illustrating the proportion of cells at different stages in the cell cycle derived from the decomposition of flow cytom-etry histograms. Irradiated cells have been given 3 Gy in late S/early G2 phase.
0% 10% 20% 30% 40% 50% 60% 70% 80% 90% 100%
7.5 9 10.5 11.5 13
time after TdR block release (hrs)
G1 phase S phase G2/M phase
Control
0% 10% 20% 30% 40% 50% 60% 70% 80% 90% 100%
7.5 9 10.5 11.5 13
time after TdR block release (hrs)
G1 phase S phase G2/M phase
MF
0% 10% 20% 30% 40% 50% 60% 70% 80% 90% 100%
7.5 9 10.5 11.5 13
time after TdR block release (hrs)
G1 phase S phase G2/M phase
IR
0% 10% 20% 30% 40% 50% 60% 70% 80% 90% 100%
7.5 9 10.5 11.5 13
time after TdR block release (hrs)
G1 phase S phase G2/M phase
cells nevertheless arrest pre-mitotically following any dis-turbance in their preparation for division) may also have influenced the responses observed. While we feel that cells of normal phenotype may prove superior "models" in fu-ture work, it can be argued that work on transformed cells is still relevant because ELF might require some predispo-sition of cells (or some point of inherent/ induced genetic instability) which becomes further unbalanced and gives an abnormal response sooner than otherwise expected, and from which aberrant subclones of a more anaplastic nature arise. Thus the recent work of Still et al. [42] on Ju-rkat cells, which are highly sensitive to their environmen-tal conditions, may itself be a valid approach, although in this latest study these authors saw no clear difference
be-tween Ca2+-dependent gene expression in exposed cells
which might have arisen from previously reported chang-es in intracellular free Ca2+ levels [43].
Materials and Methods
Cell culture and synchronisation
Mycoplasm-negative human cervical epithelial carcinoma (HeLa) cells, certified as this cell type, as required by the
UKCCCR guidelines, were cultured in DMEM (4.5 g l-1
modification) supplemented with 10% calf serum, 80 µg
ml-1 streptomycin and 100 units ml-1 penicillin at 37°C in
a humidified 5% CO2 atmosphere. Cells were
synchro-nised at the G1/S boundary by double thymidine block, as in our previous studies [27].
Magnetic fields
Cells were cultured in a 50 Hz, 2mT root mean squared electromagnetic field applied perpendicular to the cell monolayers and generated with a Helmholtz configura-tion of coils. Two Helmholtz pairs were used so that sam-ples could be either exposed to an applied magnetic field or sham exposed, i.e. identical environmental conditions but without magnetic field exposure. The homogeneity of the field in the coils is shown in Fig. 1A and 1B. Measure-ment of the magnetic field conditions, including both time-varying and static fields, was made using a search coil type sensor and a Bartington's MAG-03MC Fluxgate Magnetic Field Sensor. Both had calibrations traceable to national standards. Measurements of the perpendicular components of the background time-varying fields and the static fields are shown in Table 2.
Cell cultures were housed in two hermetically sealed,
cy-lindrical perspex flasks commensurate with the ± 2.5%
uniform volume exhibited by the Helmholtz pairs (see legend to Figure 1A and 1B). Sealable openings were used to provide a 5% CO2 in air atmosphere and allow inser-tion of a temperature probe. Temperature control was achieved by housing the exposure systems in a 37°C hot-room and using an in-line duct fan to provide a fast air flow (maximum 460 m3 h-1) directly on to the flasks by
use of ventilation ducting and a suitable Y-tube connector. Temperature differences between the two flasks were kept to within ± 0.1°C.
Exposure conditions of cell cultures
For the purpose of investigating whether ELF magnetic fields can modulate post-irradiation G2 checkpoint func-tion cell cultures were subjected to one of four environ-mental conditions hereafter referred to as categories 1 to 4. For the flow cytometry experiments cultures were grown in 30 mm diameter dishes and were subjected to the exposure in the Groups shown below immediately fol-lowing release of a double thymidine block:
Group 1 Cultures grown under normal conditions, i.e. 37°C in a 5% CO2/air atmosphere.
Group 2 As for Group 1 but continuously exposed to a 2mT, 50 Hz magnetic field with a perpendicular orienta-tion relative to the cell monolayer.
Group 3 Irradiated using a 137Cs source in the range 1–5
Gy. Subsequently cultured as Group 1.
Group 4 Irradiated with 137Cs and then immediately and
continuously exposed to a 2mT, 50 Hz magnetic field with a perpendicular orientation relative to the cell monolayer.
Figure 6
Flow cytometry histograms of synchronised HeLa S3 cells. From left to right the histograms correspond to 9.5, 11, 12.5, 13.5 and 15 h after release of the second thymidine block. Categories 3 and 4 have been irradiated with a dose of 5 Gy in early S-phase.
control . . . .
5Gy . . . .
The 137Cs irradiator was housed in a separate building
re-sulting in a transit time of approximately 20 min before cultures were back in the hot room. Except for the time in the gamma-irradiation source, the cultures were kept in a polystyrene box with 37°C water bottles to maintain their temperature.
Flow cytometry
Nuclei were isolated and stained with propidium iodide [28]. Nuclear fluorescence (DNA content) was recorded for each cell of doublet discriminated populations with a Coulter EPICS Profile II machine. Not less than 10,000 nuclei were processed per sample. Cell cycle phases were obtained by decomposition of the frequency histograms
by the half-peak reflection method, using an algorithm in "Cytologic" software (Coulter Electronics).
Abbreviations
ODC, ornithine decarboxylase; HPV, human papilloma-virus; HEPES, N-2-hydroxyethypiperazine-N'-2-ethanesulphonic acid; EDTA, ethylenediaminetetraacetic
acid; EGTA, ethyleneglycol-bis (β
-aminoethylether)-N,N,N',N'-tetraacetic acid; DTT, dithiothreitol; PMSF, phenylmethylsulphonyl fluoride.
Acknowledgements
PAH held a Medical Research Council Studentship and JL a Caledonian Re-search Foundation Scholarship during this course of this work. We also wish to thank the many people who offered their careful and useful critical comments of these studies and the manuscript prior to submission. Figure 7
Bar charts illustrating the proportion of cells at different stages in the cell cycle derived from the decomposition of flow cytom-etry histograms. Irradiated cells have been given 5 Gy in early S-phase
0% 10% 20% 30% 40% 50% 60% 70% 80% 90% 100%
9.5 11 12.5 13.5 15
time after TdR block release (hrs)
G1 phase S phase G2/M phase
Control
0% 10% 20% 30% 40% 50% 60% 70% 80% 90% 100%
9.5 11 12.5 13.5 15
time after TdR block release (hrs)
G1 phase S phase G2/M phase
MF
0% 10% 20% 30% 40% 50% 60% 70% 80% 90% 100%
9.5 11 12.5 13.5 15
time after TdR block release (hrs)
G1 phase S phase G2/M phase
IR
0% 10% 20% 30% 40% 50% 60% 70% 80% 90% 100%
9.5 11 12.5 13.5 15
time after TdR block release (hrs)
G1 phase S phase G2/M phase
References
1. Wertheimer N, Leeper E: Electrical wiring configurations and childhood cancer.Amer J Epidem 1979, 109:273-284
2. Feychting M, Ahlbom A: Magnetic fields and cancer in children residing near Swedish high-voltage power lines.Amer J Epide-miol 1993, 138:467-481
3. Verkasalo PK, Pukkula E, Hongisto MY, Valjas JE, Heikkila KV, Ko-skenvuo M: Risk of cancer in Finnish children living close to power lines.Brit Med J 1993, 307:895-899
4. Linet MS, Hatch EE, Kleinerman RA, Robison LL, Kaune WT, Fried-man DR, Severson RK, Haines CM, Hartsock CT, Niwa S, Wacholder S, Tarone RE: Residential exposure to magnetic fields and acute lymphoblastic leukemia in children.New Eng J Med 1997,
337:1-7
5. Campion EW: Power lines, cancer, and fear.New Engl J Med 1997,
337:44-45
6. Park RL: Currents of Fear.In "Voodoo science; the road from foolish-ness to fraud". Oxford University Press, Oxford 2000, 140-161 7. Adair RK: Constraints on biological weak effects of weak ELF
electromagnetic fields.Physical Rev 1991, 43:1039-1040 8. Murphy JC, Kaden DA, Warren J, Sivak A: Power frequency
elec-tric and magnetic fields: a review of genetic toxicology.Mutat Res 1993, 296:221-240
9. Lane DP: p53, guardian of the genome.Nature 1992, 358:15-16 10. Williams GT: Programmed cell death: Apoptosis and
onco-genesis.Cell 1991, 65:1097-1098
11. Harrington EA, Fanidi A, Evan GI: Oncogenes and cell death.Curr
Opin Genet Dev 1994, 4:129
12. Murray A: Cell cycle checkpoints.Curr Opin Cell Biol 1994, 6: 872-876
13. Elledge SJ: Cell cycle checkpoints: preventing an identity crisis.
Science 1996, 274:1664-1672
14. Hartwell LH: Defects in a cell cycle checkpoint may be respon-sible for the genomic instability of cancer cells.Cell 1992,
71:543-546
15. Weinert TA, Lydall D: Cell cycle checkpoints, genetic instability and cancer.Semin Cancer Biol 1993, 4:129-140
16. Hollstein M, Rice K, Greenblatt MS, Soussi T, Fuchs R, Sorlie T, Hovig E, Smith-Sørensen B, Montesano R, Harris CC: Database of p53
gene somatic mutations in human tumors and cell lines.
Nu-cleic Acids Res 1994, 22:3551-3555
17. Donehower LA, Harvey M, Slagle BL, McArthur MJ, Montgomery CA, Butel JS, Bradley A: Mice deficient for p53 are developmentally normal but susceptible to spontaneous tumours.Nature 1992,
356:215-221
18. Harvey M, McArthur MJ, Montgomery CA, Butel JS, Bradley A, Done-hower LA: Spontaneous and carcinogen induced tumorigene-sis in p53-deficient mice.Nature Genet 1993, 5:225-229 19. Kastan MB, Onyekwere O, Sidransky D, Vogelstein B, Craig RW:
Participation of p53 protein in the cellular response to DNA damage.Cancer Res 1991, 51:6304-6311
20. Kuerbitz SJ, Plunkett BS, Walsh WV, Kastan MB: Wild-type p53 is a cell cycle checkpoint determinant following irradiation.
Proc Natl Acad Sci USA 1992, 89:7491-7495
21. Livingstone LR, White A, Spouse J, Livanos E, Jacks T, Tlsty TD: Al-tered cell cycle arrest and gene amplification potential ac-company loss of wild-type p53.Cell 1992, 70:923-935
22. Yin Y, Tainsky MA, Bischoff FZ, Strong LC, Wahl GM: Wild-type p53 restores cell cycle control and inhibits gene amplifica-tion in cells with mutant p53 alleles.Cell 1992, 70:937-948 23. Harris PA: Biological effects of extremely low frequency
mag-netic fields.PhD Thesis ; University of Aberdeen. 1999
24. Litovitz TA, Krause D, Mullins JM: Effect of coherence time of the the applied magnetic field on ornithine decarboxylase
activ-ity.Biochem Biophys Res Comm 1991, 178:862-865
25. Hintenlang DE: Synergistic effects of ionising radiation and 60 Hz magnetic fields.Bioelectromagnetics 1993, 14:545-551 26. Rosenthal M, Obe G: Effects of 50 Hz electromagnetic fields on
proliferation and on chromosomal alterations in human pe-ripheral lymphocytes untreated or pretreated with chemical mutagens.Mutat Res 1989, 210:329-335
27. Lamb J, Wheatley DN: Cell killing by the novel imidazoacridi-none antineoplastic agent, C-is inhibited at high concentra-tions coincident with dose-differentiated cell cycle perturbation.Br J Cancer 1311, 74:1359-1368
28. Vindeløv LL, Christensen IJ, Nissen NI: A detergent-trypsin meth-od for the preparation of nuclei for flow cytometric DNA analysis.Cytometry 1983, 3:323-327
29. Scheffner M, Werness BA, Huibregtse JM, Levine AJ, Howley PM:
The E6 oncoprotein encoded by human papillomavirus types 16 and 18 promotes the degradation of p53.Cell 1990, 63: 1129-1136
30. Hwang E-S, Naeger LK, DiMaio D: Activation of the endogene-ous p53 growth inhibitory pathway in HeLa cervical carcino-ma cells by expression of the bovine papillocarcino-mavirus E2 gene.
Oncogene 1996, 12:795-803
31. Kimler BF, Schneiderman MH, Leeper DB: Induction of concentra-tion-dependent blockade in the G2 phase of the cell cycle by cancer chemotherapeutic agents.Cancer Res 1978, 38:809-814 32. Konopa J: G2 block induced by DNA crosslinking agents and
its possible consequences.Biochem Pharmacol 1988, 37:2303-2309 33. Lock RB, Ross WE: Inhibition of p34cdc2 kinase activity by etoposide or irradiation as a mechanism of G2 arrest in Chi-nese hamster ovary cells.Cancer Res 1990, 50:3761-3766 34. Sørenson CM, Eastman A: Mechanism of
cis-diamminedichloro-platinum(II)-induced cytotoxicity: role of G2 arrest and DNA double-strand breaks.Cancer Res 1988, 48:4484-4488 35. Gonzales AJ, Goldsworthy TL, Fox TR: The non-genotoxic
chem-ical carcinogen phenobarbital delays G1 checkpoint re-sponse in B6C3F1 mouse hepatocytes.In: Keystone Symposium
on 'Growth Control', Keystone CO, USA. 1997
36. McCallum HM: Biological and health effects associated with some non-ionising radiations.PhD Thesis, University of Aberdeen.
1994
37. Norbury C, Nurse P: Animal cell cycles and their control.Annu
Rev Biochem 1992, 61:441-470
38. Pines J, Hunter T: Isolation of a human cyclin cDNA: evidence for cyclin mRNA and protein regulation in the cell cycle and for interaction with p34cdc2.Cell 1989, 58:833-846
39. Draetta G, Beach D: Activation of cdc2 protein kinase during mitosis in human cells: cell cycle-dependent phosphorylation and subunit rearrangement.Cell 1988, 54:17-26
40. Morgan DO: Principles of CDK regulation. Nature 1995,
374:131-134 Figure 8
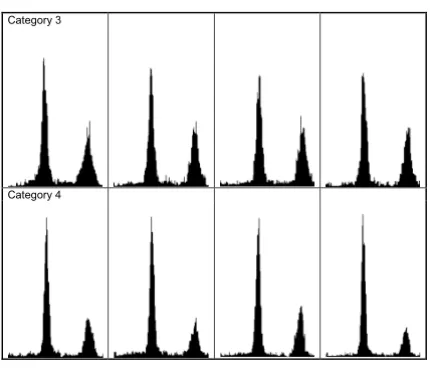
Flow cytometry histograms of synchronised HeLa S3 cells corresponding to categories 3 and 4. Each row corresponds to cultures irradiated with 5 Gy and assessed for nuclear DNA content approximately 13 h after release of the second thymidine block.
Category 3
41. Matsushime H, Quelle DE, Shurtleff SA, Shibuya M, Sherr CJ, Kato J-Y: D-type cyclin-dependent kinase activity in mammalian cells.Mol Cell Biol 1994, 14:2066-2076
42. Still M, Linström E, Ekstrand AJ, Mild KH, Mattsson M-O, Lundgren E:
Inability of 50 Hz magnetic fields to regulate PKC and Ca2+ -dependent gene expression in Jurkat cells. Cell Biol Internat
2002, 26:203-2098(doi:10.1006/cbir. 2001.0837)
43. Linström E, Linström P, Berglund A, Mild KH, Lundgren E: Intracel-lular calcium oscillations induced in a T cell line by a weak 50 Hz magnetic field.J Cell Physiol 1993, 156:395-398
Publish with BioMed Central and every scientist can read your work free of charge
"BioMedcentral will be the most significant development for disseminating the results of biomedical research in our lifetime."
Paul Nurse, Director-General, Imperial Cancer Research Fund
Publish with BMCand your research papers will be: available free of charge to the entire biomedical community
peer reviewed and published immediately upon acceptance
cited in PubMed and archived on PubMed Central
yours - you keep the copyright
[email protected] Submit your manuscript here:
http://www.biomedcentral.com/manuscript/