Impact of spectral interval on wavelet features for detecting wheat yellow
rust with hyperspectral data
Jingcheng Zhang
1,
Bin Wang
1,
Xuexue Zhang
1,
Peng Liu
1,
Yingying Dong
2,3*,
Kaihua Wu
1*,
Wenjiang Huang
2,3(1. College of Life Information Science and Instrument Engineering, Hangzhou Dianzi University, Hangzhou 310018, China; 2. Key laboratory of Digital Earth Science, Institute of Remote Sensing and Digital Earth, Chinese Academy of Sciences, Beijing 100094 China; 3. Aerospace Information Research Institute, Chinese Academy of Sciences, Beijing 100094, China)
Abstract: Detection of yellow rust using hyperspectral data is of practical importance for disease control and prevention. As an emerging spectral analysis method, continuous wavelet analysis (CWA) has shown great potential for the detection of plant diseases and insects. Given the spectral interval of airborne or spaceborne hyperspectral sensor data differ greatly, it is important to understand the impact of spectral interval on the performance of CWA in detecting yellow rust in winter wheat. A field experiment was conducted which obtained spectral measurements of both healthy and disease-infected plants. The impacts of the mother wavelet type and spectral interval on disease detection were analyzed. The results showed that spectral features derived from all four mother wavelet types exhibited sufficient sensitivity to the occurrence of yellow rust. The Mexh wavelet slightly outperformed the others in estimating disease severity. Although the detecting accuracy generally declined with decreasing of spectral interval, relatively high accuracy levels were maintained (R2>0.7) until a spectral interval of 16 nm. Therefore, it is recommended that the spectral interval of hyperspectral data should be no larger than 16 nm for the detection of yellow rust. The relatively loose spectral interval requirement permits extensive applications for disease detection with hyperspectral imagery.
Keywords: continuous wavelet analysis, spectral interval, hyperspectral data, wheat yellow rust
DOI: 10.25165/j.ijabe.20181106.4168
Citation: Zhang J C, Wang B, Zhang X X, Liu P, Dong Y Y, Wu K H, et al. Impact of spectral interval on wavelet features for detecting wheat yellow rust with hyperspectral data. Int J Agric & Biol Eng, 2018; 11(6): 138–144.
1 Introduction
Crop diseases pose a major threat to crop production and account for 10%-40% of global yield losses[1-3]. Featured by fast, nondestructive characteristics, hyperspectral remote sensing is an efficient tool for agricultural monitoring, particularly the detection of diseases and insects. In a study on the detection of rhizomania in sugar beet, Steddom et al.[4] observed significant changes in the normalized difference vegetative index (NDVI) and red green ratio (RGR) between healthy and symptomatic plants for both leaf and canopy samples. Naidu et al.[5] analyzed changes in leaf spectral reflectance between grapevines infected by leafroll disease and healthy plants; the results recommended employment of multiple parameters including original band reflectance at 684 nm, 752 nm, and 970 nm, a vegetation index (VI), and the photochemical/
Received date: 2018-02-07 Accepted date: 2018-06-25
Biographies: Jingcheng Zhang, PhD, Associate Professor, research interests: agricultural remote sensing, Email: zhangjc_rs@163.com; Bin Wang,Master, research interests: digital signal processing, Email: 1027533742@qq.com;
Xuexue Zhang, Master, research interests: agricultural modelling, Email: 2462638339@qq.com; Peng Liu, Master, research interests: Hyperspectral analysis, Wenjiang Huang, PhD, Professor, research interests: agricultural remote sensing, Email: huangwj@radi.ac.cn.
*Corresponding author: Yingying Dong, PhD, Associate Professor, research interests: machine learning and hyperspectral analysis. Key laboratory of Digital Earth Science, Institute of Remote Sensing and Digital Earth, Chinese Academy of Sciences, Beijing 100094, China. Tel/Fax: +86-10-82178169, Email: dongyy@radi.ac.cn; Kaihua Wu, PhD, Professor, research interests: precision agriculture. College of Life Information Science and Instrument Engineering, Hangzhou Dianzi University, Hangzhou 310018, China. Tel/Fax: +86-571-87713553, Email: wukh_rs@163.com.
physiological reflectance index (PRI) for detection of the disease in both symptomatic and non-symptomatic leaves. In a case study on the detection of powdery mildew in winter wheat canopies using leaf hyperspectral data, Zhang et al.[6] formed an optimal disease detection model based on several spectral features, including three VIs (the chlorophyll absorption in reflectance index (CARI), modified CARI (MCARI), and green normalized difference vegetation index (GNDVI)), two derivative spectral features (the sum of 1st derivative values within the blue edge (SDb) and the maximum value of the first derivative within the blue edge (Db)), a continuous removal transformed spectral feature (Wid), and the reflectance of green bands corresponding to the band setting of Landsat-5 TM (RG). Castro et al.
[7]
applied hyperspectral techniques for the early detection of laurel wilt disease in avocado plants. Their results suggested that the combination of features including transformed CARI (TCARI), GNDVI, NIR/G, Red-edge/G, and the Green vegetation index (VIGreen) can achieve the optimal performance in early detection of the disease.
To detect crop diseases with hyperspectral data, it is important to apply spectral analysis methods to fully utilize the wealth information contained in the spectral dimension[8,9]. As an emerging spectral analytical technique, continuous wavelet analysis (CWA) was recently introduced to process vegetative hyperspectral
data[10,11]. Its capability for continuous signal decomposition on
several diseases and insects, such as yellow rust, powdery mildew, and aphids in winter wheat[13-15]. Compared with conventional spectral features (e.g., vegetation indices, spectral derivative analysis, continuous removal analysis), the superior performance of CWA-derived features makes it a promising tool for monitoring diseases and insects with remote sensing data.
From a practical perspective, it is important to conduct CWA analysis on airborne or spaceborne hyperspectral imagery data to allow monitoring or mapping of crop diseases on a parcel level. However, the spectral quality (particularly the spectral interval) of hyperspectral imagery data is considerably lower than that of data from field spectrometers, such as the ASD Fieldspec spectrometer. Given the high cost and low availability of hyperspectral imagers, sometimes hyperspectral imaging sensors with relatively large spectral interval are also considered in field campaigns. Therefore, it is necessary to understand the impact of spectral interval on the performance of CWA in detecting crop diseases. In addition, the influence of the type of mother wavelet used in the analysis, which is another important determinant of CWA performance on crop disease detection, is also unknown. Therefore, the objectives of this study were to: (1) evaluate the influence of mother wavelet type on the performance of CWA in disease monitoring; (2) assess the impact of spectral interval on CWA; and (3) examine the capability of wavelet features for disease detection based on the accuracy of estimation models.
2 Materials and methods
2.1 Experiments and data collection
Experiments were conducted in an experimental winter wheat field at Beijing Xiaotangshan Precision Agriculture Experimental Base, Beijing, China (40º10.6ʹN, 116º26.3ʹE) during the 2010-2011 growing seasons. A winter wheat cultivar susceptible to yellow rust disease, Jingdong 9843, was used as the subject of the experiment. The soil in the field was characterized as silt-clay loam. The recommended fertilization and irrigation rates for this cultivar (200 kg/hm2 nitrogen and 450 m3/hm2 water) were applied. For yellow rust inoculation, the plants were sprayed with summer spores according to the National Plant Protection Standard[16]. Two spore concentration levels were used to create a gradient of infection severity: 4 mg/100 mL and 7.5 mg/100 mL, with a dosage of 5 mL spore solution per square meter. To prevent the occasional infection of the reference area (healthy plants), a fungicide spray procedure was implemented. Spectral measurements and disease surveys were carried out from the jointing stage (Zodaks 37) to grain-filling stage (Zodaks 70) of winter wheat, considering the timing of preventive procedures.
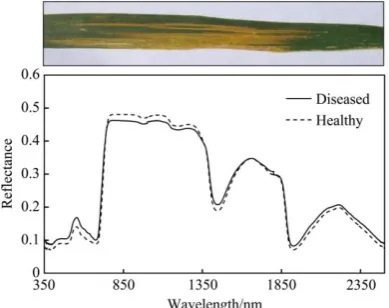
Figure 1 Disease symptoms and spectral behavior of yellow rust
2.1.1 Spectral measurements and processing
To collect leaf spectral measurements, wheat leaves were cut from plants with scissors and stored on ice. To avoid dehydration, the collected samples were immediately transported to a nearby laboratory within 20 min, and the spectral measurements were conducted. During the experimental period, a total of 198 leaf samples consisting of 55 healthy and 143 diseased leaves of various severities were collected. The samples were randomly grouped with a proportion of 60:40 percent for calibration and validation.
Leaf spectra were taken with a FieldSpec® UV/VNIR spectroradiometer (ASD Inc., Boulder, Colorado, USA) and an ASD Leaf Clip. The wavelength range of this system is from 350 nm to 2500 nm. Ten measurements were taken and averaged to obtain a spectrum for each leaf. The spectrum of a white reference panel with 99% reflectance was measured to convert the radiance to reflectance after measurements of every 10 leaves. The raw spectral data were processed using ViewSpec software (commercial software for the ASD spectroradiometer). After processing, reflectance spectra with 1-nm interval were obtained for analysis. A digital color photo was taken immediately after each spectral measurement for determination of disease severity. To assess the influence of the spectral interval on CWA, the original spectra were resampled to create a series of datasets with different spectral gaps. In addition to the original spectral data with a 1-nm interval, the spectra were resampled to form datasets with spectral intervals of 2 nm, 4 nm, 8 nm, 16 nm, 32 nm, and 64 nm. These measurements thus constituted a gradient of spectral intervals. A resampled spectrum with different spectral intervals is shown in Figure 2.
2.1.2 Severity determination
The disease index (DI) was used to quantify disease severity; it reflects the proportion of disease pustules on the leaf[17-18]. The DI was estimated using image processing software based on a machine vision technique. The software included two segmentation steps: one for identifying the leaf from the background, and the other for recognizing damaged areas on the leaf. Using visual recognition as a reference, the software yielded a DI estimation accuracy of over 95%.
2.2 Continuous wavelet analysis of spectral data
Leaf spectra were analyzed using CWA to extract the most appropriate wavelet features for disease detection. The CWA workflow includes wavelet decomposition of the spectral signal, derivation of wavelet features, and performance assessment. 2.2.1 Wavelet decomposition of spectral data
As a central process of CWA, wavelet decomposition is implemented to convert each original spectrum to a set of energy coefficients on continuous wavelengths and scales according to a mother wavelet function. The transformation is conducted according to the following equation:
, ,
( , ) , ( ) ( )
f a b a b
W a b f f d
(2)where, Ψ(λ) indicates the mother wavelet; a is a scaling factor indicating the wavelet’s width; b is a shifting factor indicating the position of the wavelet; and f(λ) is the hyperspectral reflectance spectrum (λ=1, 2, … n; n is the number of wavebands). The coefficients Wf(ai,bj); i=1, 2,…, m; j=1, 2,…, n) constitute a
wavelets were tested in the analysis: Gaus1, Mexh, Meyr, and Morl. The function curves of the four wavelets are shown in Figure 3.
Figure 2 Demonstration of a spectrum resampled with different spectral intervals
2.2.2 Derivation of wavelet features
To analyze the correlations between the decomposed wavelet energy coefficients and disease severity, a correlation scalogram was generated to indicate the suitability of wavelet features at continuous wavelengths and scales. To achieve this purpose, the coefficients of determination (R2) for linear correlations between wavelet coefficients and DIs across all measurements were calculated. The R2 values corresponding to different wavelengths and scales can thus form a correlation scalogram, which is also an m×n matrix. The wavelet features can be identified based on this correlation scalogram and a thresholding method[10,13]. In this study, 1% was used as the threshold, indicating elements in the top 1% based on corresponding R2 values in the correlation scalogram. To guarantee that the wavelet features had sufficient stability, only regions with four or more elements were retained in the analysis. Within each feature region, only the element with the highest R2 value was retained as the CWA feature for disease detection. Because a spectral response dominated by leaf water content is significantly weaker than that dominated by pigments and visible symptoms, the feature selection was conducted over a wavelength range of 350-1300 nm (response to pigment variation and visible disease symptoms) and 1300-2500 nm (response to variation in leaf water content). The feature selection was first performed on the original spectral data with four different mother wavelets. Then, based on the mother wavelet with the highest sensitivity to disease severity, the feature selection was further performed on the resampled spectral datasets with different spectral intervals. The identified features corresponding to different mother wavelets and different spectral intervals were used to support subsequent modeling processes and the analysis of the influences of mother wavelet type and spectral interval.
2.3 Performance assessment of wavelet features in disease detection
To link the identified wavelet features with disease severity of yellow rust, models for estimating disease severity were established with partial least square regression (PLSR) analysis. For wavelet features corresponding to different mother wavelet types and datasets with different spectral intervals, the models were trained
with 60% of the data (calibration samples) and validated against the remaining 40% of the data (validation samples). To assess and compare different model forms, two indices, the coefficient of determination (R2) and the root mean square error (RMSE), were used as accuracy indicators. All statistical analyses were implemented in SPSS 19.0. The entire workflow of the analysis is illustrated in Figure 4.
Figure 4 Workflow of data processing and analysis
3 Results and discussion
3.1 Wavelet features derived from different mother wavelet types
Based on the training data, four correlation scalograms corresponding to different types of mother wavelets were generated (Figure 5). In general, significant differences were observed among the four correlation scalograms. The correlation scalogram for Gaus1 was similar to that for Mexh, whereas the correlation scalogram for Meyr was similar to that for Morl. Such a pattern may be related to the similarity of the shapes of the mother wavelets (Figure 3). Following the feature selection protocol as described in Section 2.2.2, different numbers of wavelet features were identified corresponding to the four mother wavelets. The transformations according to the Gaus1, Mexh, Meyr, and Morl mother wavelets yielded 6, 7, 8, and 11 features, respectively.
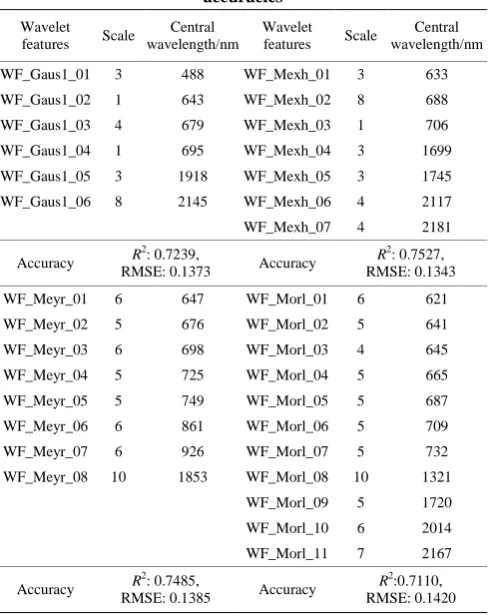
Figure 5 Correlation scalogram of continuous wavelet analysis with different types of mother wavelets As seen in Table 1, regardless of the mother wavelet type,
many wavelet features were distributed around the red to near-infrared spectral region (620-780 nm). In this region, spectral variation is closely associated with the absorption of
changes the reflectance of red bands[20,21]. Among the wavelet features within the red to near-infrared spectral regions, a certain proportion was distributed around the red-edge region (670- 760 nm), where a strong response of the spectral signal to plant stresses is typically observed. The reflectance in spectral regions beyond 1300 nm is governed by the absorption of vegetation water content. Given that the disease also induces dehydration[19], a number of wavelet features were identified in this region.
Table 1 Summery of wavelet features and corresponding accuracies
Wavelet features Scale
Central wavelength/nm
Wavelet features Scale
Central wavelength/nm
WF_Gaus1_01 3 488 WF_Mexh_01 3 633
WF_Gaus1_02 1 643 WF_Mexh_02 8 688
WF_Gaus1_03 4 679 WF_Mexh_03 1 706
WF_Gaus1_04 1 695 WF_Mexh_04 3 1699
WF_Gaus1_05 3 1918 WF_Mexh_05 3 1745
WF_Gaus1_06 8 2145 WF_Mexh_06 4 2117
WF_Mexh_07 4 2181
Accuracy R
2: 0.7239,
RMSE: 0.1373 Accuracy
R2: 0.7527, RMSE: 0.1343
WF_Meyr_01 6 647 WF_Morl_01 6 621
WF_Meyr_02 5 676 WF_Morl_02 5 641
WF_Meyr_03 6 698 WF_Morl_03 4 645
WF_Meyr_04 5 725 WF_Morl_04 5 665
WF_Meyr_05 5 749 WF_Morl_05 5 687
WF_Meyr_06 6 861 WF_Morl_06 5 709
WF_Meyr_07 6 926 WF_Morl_07 5 732
WF_Meyr_08 10 1853 WF_Morl_08 10 1321 WF_Morl_09 5 1720 WF_Morl_10 6 2014 WF_Morl_11 7 2167
Accuracy R
2
: 0.7485,
RMSE: 0.1385 Accuracy
R2:0.7110, RMSE: 0.1420 Among the four types of mother wavelets, the identified wavelet features significantly differed with respect to scale and
central wavelength (Table 1). The wavelet features corresponding to Gaus1 and Mexh were located at relatively lower scales (over 1-8) compared with those features corresponding to Meyr and Morl (over 5-10). Such a difference may be related to the complexity of the wavelet shapes. Because feature extraction using wavelet analysis mainly relies on similarities between the shape of the mother wavelet and the original spectral signal, it is understandable that mother wavelets with relatively complex shapes tend to capture broad spectral changes at higher scales, whereas mother wavelets with simple shapes tend to capture smaller spectral variations at lower scales. The estimation accuracies of the models (Table 1) suggested that wavelet features based on Mexh performed slightly better in estimating the severity of yellow rust infection compared with features based on the other mother wavelet types. As a commonly used mother wavelet, Mexh has been shown to concentrate energy in transformed signals and remove noise during spectral analysis[22,23]. More important, the shape of the Mexh wavelet reflects some classic vegetation absorption features, making it a frequently used wavelet for transforming vegetation spectral signals[10,13]. Based on this result, the Mexh wavelet is the optimal mother wavelet for extracting wavelet features for yellow rust detection, and was therefore used in subsequent analyses.
3.2 Impact of spectral interval on CWA analysis for disease detection
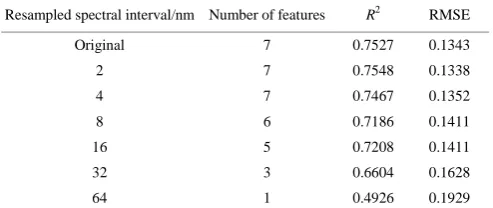
To investigate the influence of spectral interval on the use of CWA for disease detection, the original spectra were resampled to a series of datasets with a gradient of spectral intervals. The correlation scalograms corresponding to different spectral intervals are demonstrated in Figure 6. Based on the correlation scalograms and the capability of the identified wavelet features for disease detection (Table 2), a general pattern could be observed: the number of wavelet features decreased with decreasing spectral interval. For the original spectra and those with 2 nm and 4 nm intervals, a total of 7 wavelet features were identified. For the remaining spectral data (8-nm interval and larger), the number of wavelet features gradually decreased to only one (64-nm interval data).
Table 2 Modeling accuracy of disease detection based on wavelet features from datasets with different spectral intervals
Resampled spectral interval/nm Number of features R2 RMSE
Original 7 0.7527 0.1343
2 7 0.7548 0.1338
4 7 0.7467 0.1352
8 6 0.7186 0.1411
16 5 0.7208 0.1411
32 3 0.6604 0.1628
64 1 0.4926 0.1929
The underlying basis for this phenomenon is the gradual loss of spectral detail with decreasing spectral interval. In CWA, the continuous decomposition of a spectral signal guarantees that wavelet features corresponding to different scales can be separated. Thus, even if spectral details associated with low-scale wavelet features are lost, some high-scale wavelet features characterizing the general spectral shape can still be extracted. This trait explains why the relationship between wavelet features and disease severity as indicated by R2 and RMSE did not vary much with decreasing spectral interval. Changes in retrieval accuracy were particularly small, until a spectral interval of 16 nm (R2 declined from 0.7527 to 0.7208 and RMSE increased from 0.1343 to 0.1411, for original and 16-nm data, respectively). The difference in retrieval accuracy for models based on the original, 2-nm interval, and 4-nm interval spectra could barely observed. According to the Mexh correlation scalogram, several sensitive feature regions (marked in red in Figure 6) around the pigment absorption and red-edge regions (i.e., WF_Mexh_01 and WF_Mexh_03) spanned a couple of scales. In addition, some sensitive feature regions corresponding to plant water absorption maintained relatively a high scale of 4-5 (i.e., WF_Mexh_06 and WF_Mexh_07). Therefore, it is understandable that when high-frequency spectral information is removed (i.e., low-scale wavelet features, corresponding to spectral detail), low-frequency spectral information (i.e., high-scale wavelet features, corresponding to the general spectral shape) can still respond well to disease severity. Such a pattern can also be visually observed from the changes of spectral absorption bands across different resampled spectral curves (Figure 2). However, when the spectral interval decreased to 32 nm, the number of wavelet features within 350-1300 nm decreased to one, and only two features were identified within 1300-2500 nm (Figure 6). Such a change indicates that at this spectral interval, some important spectral shape information relevant to disease severity was lost, which led to a considerate drop in accuracy. Moreover, at a larger interval of 64 nm, spectral detail at absorption positions was lost and the spectral curve resembled a line chart (Figure 2). At this interval, only one wavelet feature was identified around the red-edge region (Figure 6). As a result, accuracy declined sharply at this interval (R2 = 0.4926, and RMSE = 0.1929).
Despite the fact that some conventional spectral features (i.e., certain VIs, spectral derivatives, or continuous removal features) can capture spectral changes induced by infection[14,24], the traversal nature of CWA optimizes the scale and position of wavelet features, which can potentially lead to stronger correlations with disease severity. The responses of feature selection and estimation accuracy to changes in spectral interval suggest that the spectral interval of hyperspectral data should be no coarser than 16 nm for detection of yellow rust disease with wavelet features.
Although CWA feature extraction mainly relies on hyperspectral data, the relatively loose requirement for spectral interval will significantly facilitate data acquisition. With the fast development of airborne or spaceborne hyperspectral imagers, the availability of data to support disease monitoring and mapping will increase. The next step of this research is to use real hyperspectral imaging data to examine the capability and feasibility of CWA-based strategies for disease monitoring. Apart from disease monitoring, it is also necessary to investigate the influence of spectral interval on CWA-based feature selection and modeling for other general problems in vegetation remote sensing, such as the retrieval of biophysical and biochemical parameters. More studies in this area will promote the use of CWA techniques for practical applications.
4 Conclusions
To improve the detection of yellow rust disease based on CWA of hyperspectral data, a detailed analysis with respect to the impact of mother wavelet type and spectral interval was conducted. The major conclusions are as follows: (1) Despite the fact that the central wavelength and scale of wavelet features derived from different mother wavelet types (Gaus1, Mexh, Meyr and Morl) significantly differed, the accuracies of corresponding models for estimating disease severity were similar. Wavelet features corresponding to Mexh slightly outperformed those based on the other mother wavelets in disease detection; therefore, Mexh is recommended for feature extraction. (2) Changes in spectral interval influenced the number of identified wavelet features, their sensitivity to the disease, and the overall modeling accuracy. The number of wavelet features, the features’ sensitivity, and estimation accuracy decreased with decreasing spectral interval; the decline was gradual for data with spectral intervals of 1-16 nm, but sharp for 32-nm and 64-nm intervals. Therefore, it is recommended that the spectral interval of hyperspectral data should be no coarser than 16 nm for disease detection. Such a relatively loose spectral interval requirement will encourage the application of CWA in disease monitoring. (3) The feasibility of using CWA for disease detection with realistic hyperspectral images should be examined in the future.
Acknowledgments
This work was subsidized by the National Natural Science Foundation of China (41601466; 61661136004) and Youth Innovation Promotion Association CAS (2017085).
[References]
[1] Christou P, Twyman R M. The potential of genetically enhanced plants to address food insecurity. Nutrition Research Reviews, 2004; 17(1): 23–42.
[2] Strange R N, Scott P R. Plant Disease: A threat to global food security. Annual Review of Phytopathology, 2005; 40, 83–116.
[3] Oerke E C. Crop losses to pests. Journal of Agricultural Science, 2006; 144(1): 31–43.
[4] Steddom K, Heidel G, Jones D, Rush C M. Remote detection of rhizomania in sugar beets. Phytopathology, 2003; 93: 720–726. [5] Naidu R A, Perry E M, Pierce F J, Mekuria T. The potential of spectral
reflectance technique for the detection of Grapevine leafroll-associated virus-3 in two red-berried wine grape cultivars. Computers and Electronics in Agriculture, 2009; 66: 38–45.
[6] Zhang J C, Pu R L, Wang J H, Huang W J, Yuan L, Luo J H. Detecting powdery mildew of winter wheat using leaf level hyperspectral measurements. Computers and Electronics in Agriculture, 2012; 85: 13–23.
spectral and geometric parameters for early detection of laurel wilt disease in avocado. Remote Sensing of Environment, 2015;171: 33–44. [8] Hahn F. Actual pathogen detection: sensors and algorithms-A review.
Algorithms, 2009; 2: 301–338.
[9] Sankaran S, Mishra A, Ehsani R, Davis C. A review of advanced techniques for detecting plant diseases. Computers and Electronics in Agriculture, 2010; 72(1): 1–13.
[10] Cheng T, Rivard B, Sánchez-Azofeifa A, Feng J, Calvo-Polanco M. Continuous wavelet analysis for the detection of green attack damage due to mountain pine beetle infestation. Remote Sensing of Environment, 2010;114: 899–910.
[11] Cheng T, Rivard B, Sánchez-Azofeifa A. Spectroscopic determination of leaf water content using continuous wavelet analysis. Remote Sensing of Environment, 2011; 115(2): 659–670.
[12] Ebadi L, Shafri H Z M. A stable and accurate wavelet-based method for noise reduction from hyperspectral vegetation spectrum. Earth Science Informatics, 2014; 8: 411–425.
[13] Zhang J C, Pu R L, Loraamm R W, Yang G J, Wang J H. Comparison between wavelet spectral features and conventional spectral features in detecting yellow rust for winter wheat. Computers and Electronics in Agriculture, 2014; 100: 79–87.
[14] Zhang J C, Yuan L, Wang J H, Huang W J, Chen L P, Zhang D Y. Spectroscopic leaf level detection of powdery mildew for winter wheat using continuous wavelet analysis. Journal of Integrative Agriculture, 2012; 11(9): 1474–1484.
[15] Luo J H, Huang W J, Zhao J, Zhang J C, Zhao C J, Ma R H. Detecting aphid density of winter wheat leaf using hyperspectral measurements. IEEE Journal of Selected Topics in Applied Earth Observations and Remote Sensing, 2013; 6: 690–698.
[16] Li G B, Zeng S M, Li Z Q. Integrated management of wheat pests, Press of Agriculture Science and Technology of China, 1989; Beijing, China. [17] Graeff S, Link J, Claupein W. Identification of powdery mildew
(Erysiphe graminis sp. tritici) and take-all disease (Gaeumannomyces graminis sp. tritici) in wheat (Triticum aestivum L.) by means of leaf reflectance measurements. Central European Journal of Biology, 2006; 1: 275–288.
[18] Luedeling E, Hale A, Zhang M, Bentley W J, Dharmasri L.C. Remote sensing of spider mite damage in California peach orchards. International Journal of Applied Earth Observation and Geoinformation, 2009; 11: 244–255.
[19] Line R F. Stripe rust of wheat and barley in North America: A retrospective historical review. Annual Review of Phytopathology, 2002; 40: 75–118.
[20] Devadas R, Lamb D W, Simpfendorfer S, Backhouse D. Evaluating ten spectral vegetation indices for identifying rust infection in individual wheat leaves. Precision Agriculture, 2009; 10: 459–470.
[21] Kuckenberg J, Tartachnyk I, Noga G. Detection and differentiation of nitrogen-deficiency, powdery mildew and leaf rust at wheat leaf and canopy level by laser-induced chlorophyll fluorescence. Biosystems Engineering, 2009; 103: 121–128.
[22] Torrence C, Compo G P A. Practical guide to wavelet analysis. Bulletin of the American Meteorological Society, 1998; 79(1): 61–78. [23] Wang Y, Mo J Y. A new de-noising technique for spectra based on
Mexican hat wavelet. Spectroscopy and Spectral Analysis, 2005; 25: 124–127.