September 2001, V
ol 1, No 1
www
.ger
ontechjournal.net
25
Quite a few adults experience difficulties in using present-day consumer products with their extensive functionality1, 2. Three factors may potentially contribute: complexity of the user interface, age effects in perceptual, cog-nitive, and motor abilities, and generation-related lack of experience with such technol-ogy. The objective of the present study is to unravel the influences of these three factors. To this end, four age groups between 30 and 70 yrs handled user interfaces of simulated
devices in two laboratory experiments. This concerned a video-phone interface with a single layered and a two-layered menu inter-face in the first and a three-layered interinter-face of a simulated mobile phone in the second experiment.
We start with explaining the theoretical framework including the concept of genera-tion effects and how to distinguish these from age effects. Next, the two experiments will be described and discussed.
Technology generation and
Age in using layered user interfaces
Mili Docampo Rama* PhD,
Huib de Ridder** PhD,
Herman Bouma*** PhD
From the former IPO Center for Research on Human-System Interaction and the former Institute for Gerontechnology, Eindhoven University of Technology,
the Netherlands
Present affiliations: * Philips Design
e-mail [email protected]
** Department of Industrial Design, Delft University of Technology. e-mail [email protected]
*** Emeritus Eindhoven University of Technology. e-mail [email protected]
M. Docampo Rama, H. de Ridder, H. Bouma, Technology generation and Age in using layered user interfaces, Gerontechnology, 2001; 1(1): 25 - 40. Why do older adults encounter more difficulties than younger persons do in using present electronic devices? Two factors may play a role: (1) Age-related decline in ability; (2) Generation-related lack of earlier experience with such user interfaces. In two experiments, performance was compared of four age groups when using simulations of devices with software style user interfaces in one, two, and three menu layers. For task duration only an age effect was found. However, for mode error performance a generation effect appeared in that subjects who experienced software style user interfaces in early adulthood performed better than older subjects who did not have such earlier experience. Within the older subjects, no age effect in error performance was found. The results are interpreted in terms of the generation theory as known from sociological studies in that experiences in the formative period before the age of 25 yrs are more persistent than later ones.
September 2001, V
ol 1, No 1
www
.ger
ontechjournal.net
26
FRAMEWORK
Complexity of user interface
Taking the users’ point of view, user inter-faces can be characterised by the associated interaction styles. In an interaction style, specifications are given of re-usable applica-tion controls, specific selecapplica-tions and designs of such controls, and general design principles3.
To these has been added directness of manipulation on a continuum between very indirect and very direct manipulations of functions3-7. We follow de Vet and de Ruyter8, who offer a structured approach to interaction styles and their possible impacts on user performance.
An interaction style then supports generic options of user tasks, called conceptual oper-ations, organises such options according to operational procedures: called interaction structure, and uses specific interaction proce-dures for input and output devices, called interaction techniques. For example, a mouse pointing device (interaction tech-nique) is used to select a file (conceptual operation) by clicking several icons (interac-tion techniques) following a certain dialogue flow within a hierarchical menu (interaction structure). This offers a general description of user interfaces and the impact of specific aspects of the interaction style can be manip-ulated in order to assess the effects on the user.
Recently, an analysis has been provided how the interaction style of consumer products has changed within the 20th century9. Three major styles have been identified: a mechan-ical style up till the thirties or forties, an elec-tro-mechanical style up till the early eighties, and a software style since then. For the pres-ent paper, the transition from electro-mechanical to software style is relevant. The transition is characterised as follows. Interaction techniques evolved from mechanical attributes such as push buttons, switches, and rotary dials toward
software-directed attributes such as displays, touch buttons, and wireless remote controls. The interaction structure changed from an organ-isation in breadth, using one layer in which only basic functionality was present and directly visible to the user, toward a multi-layered hierarchical style, in which from the abundant functionality only part is visible to the user at any time. As to conceptual oper-ations, the basics of the electro-mechanical style have evolved toward a wide variety of options, an overview of which is difficult to get. In the software style, several options are invisible and feedback about the present mode of the user interface and of the pres-ent functions of input- and output devices is usually restricted.
In the present paper, we will focus on the number of layers as a basic ingredient of the interaction structure complexity. We assume this plays a key role in the user’s understand-ing of the organisation of the user interface of the device. A layered control panel fails to provide information about the available functionality and about the functions of each control and the status of the information behind it. So, such user interfaces may impose a large demand on the user’s reason-ing ability for figurreason-ing out the procedures. Furthermore, a good working memory is required10 for keeping all relevant informa-tion available for execuinforma-tion of the users’ present intentions. Especially, the visuo-spa-tial sketch pad11is expected to be involved as on the control panel no cues are provided about the present spatial locations of the dif-ferent functions. User interfaces organised in one layer only are expected to rely less on such cognitive abilities.
September 2001, V
ol 1, No 1
www
.ger
ontechjournal.net
27 about the spatial location of functions.
Besides, accuracy on the window display diminished when the number of values increased that the users had to keep track of13. Hence, the load on working memory seemed to be a crucial factor. Also, it has been reported that the users’ mean response time for decision and movement is shorter when user interfaces are structured in breadth rather than in depth14.
Age
There is substantial evidence, of course, that certain cognitive abilities involved in learning complex systems change with increasing age15. Among others, this holds for reasoning ability and working memory for spatial infor-mation. This has been ascribed to a decreas-ing ability to hold information in workdecreas-ing memory16, 17, perhaps because of a reduction of processing capacity18, 19. Salthouse20 pro-vides an overview of age related changes in spatial abilities, most of which show a rather linear decline with age starting at the age of 40 yrs or even 30 years as normative studies of the Raven matrices test21 about abstract reasoning with visual material indicate. However, longitudinal studies about the abil-ity of reasoning and spatial orientation, as measured by part of the WAIS, indicate that no substantial changes are found before the late sixties22.
Indeed, it has been shown that the handling of complex systems with increasing age is related to cognitive changes. Age differences in performance involving complex parallel activities have a 70% overlap with age-related differences in processing speed23. Also, in exploring a new system, age differ-ences have been found in the level of rea-soning24, such as defined by the GEMS model25. With increasing age, performance on the highest level of reasoning declines and performance on a trial-and-error basis increases. Also, when working with a menu structure, latency differences between older and younger subjects were explained partly by differences in spatial ability24. In
perform-ing a data-entry task, visuo-motor skills and memory appeared good predictors of age-related differences in quantity and quality of the task26. It is expected than that in our study age differences will appear in working with complex user interfaces.
The age-complexity hypothesis states that differences in performance between old and young adults increase with task complexity27. In experiments comparing screen-based ver-sus text-based editors, this tendency has been confirmed12. Consequently, perform-ance differences between older and younger adults are expected to increase with the number of layers of a hierarchical menu interface.
Technology Generation
Next to general cognitive abilities, specific experience in using complex systems is expected to play a role, The user needs to learn or have available declarative and pro-cedural knowledge28 about functionality, structure, and controls of the system. The greater the knowledge base of a person on a certain topic, the easier it will be to encode, understand, integrate, and remember new relevant information29. Since this information is to be stored in long-term memory, the user may take advantage of earlier acquired knowledge for generalising this toward the use of similar types of user interface. This has indeed been reported30, 31. However, transfer of knowledge can also be negative if users cannot follow their existing habits and have to learn new procedures32.
September 2001, V
ol 1, No 1
www
.ger
ontechjournal.net
28
home to living independently and starting a family of their own. Values, norms, and skills acquired during this period tend to be stable and influence behaviour later in life35, 36. Several factors have been mentioned as con-tributing to this effect, among which neuro-logical change and decreased social mobility. Also, from child-development studies it appears that cognitive abilities such as hypo-thetico-deductive reasoning reach their high-est level during adolescence37-40, adding weight to the concept of the formative period. The concept of technology generations have been coined by Sackmann and Weymann41 and further worked out by Becker and van de Goor42,43. They found evidence that peo-ple who experienced the availability of the same types of consumer product during their formative period, in some respects display similar technology usage many years later. So, different technology generations appear to behave differently with respect to technol-ogy, due to differences in technology experi-ence during their formative years.
Generation-specific technology experience could also induce differences in using current consumer products. If the formative period is the optimal phase in life in which complex interaction styles can be understood and learned in all facets, then older people may be at a disadvantage in using present com-plex user interfaces. They did not have the opportunity to get skilled in their formative period earlier in life. So, birth cohorts that have experienced electro-mechanical inter-faces within their formative period can be expected to have more difficulties in learning to use software style interfaces than birth cohorts that had the opportunity to learn such new interfaces within their formative period.
The problem then becomes to determine where the boundary occurred between birth cohorts that grew up with electro-mechani-cal interfaces and birth cohorts that grew up with software-style interfaces. Following ear-lier investigators41, 44, 45, we operationally
define the beginning of the period at which a specific interaction style was introduced as the point in time where 20% diffusion with-in the population has been reached. By then, it is likely that persons who themselves do not have such devices, have experienced it via friends, relatives, at school, or at work.
Devices such as radio, telephone, television, and videorecorder were initially developed with an electro-mechanical, if not mechani-cal user interface. In the early 1980’s, con-sumer products appeared on the market with a software-style interface, often including a wireless remote control. For the situation in the Netherlands, a survey has been carried through for determining the diffusion of software-style user interfaces9, using wireless remote control and the availability of the textual information system on TV called Teletext as indices. The outcome suggested that in 1985, more than 20% of the subjects had software style devices at their parental home and more than 80% of the subjects younger than 25 yrs at that time had used these. The diffusion period of software style devices then comes out at about five years. In this paper, birth cohorts before 1960 will be referred to as the electro-mechanical gen-eration (EM-gengen-eration) and birth cohorts as from 1960 as the software-generation (S-generation).
Age effects versus generation effects Since both age and generation are based upon the year of birth, how can we opera-tionally distinguish between age effects and (technology) generation effects? Following general sociological methodology33, different generations are defined on the basis of rather sudden, discontinuous changes in society such as wars, economic depressions etc., and consequently generation effects should reflect such discontinuity. Age effects are different since these are assumed to be rather continuous.
September 2001, V
ol 1, No 1
www
.ger
ontechjournal.net
29 choosing subjects from suitable age cohorts
such that the transition from electro-mechanical to software style user interfaces is suitably covered. If performance declines continuously with birth cohort, we will inter-pret this as an age effect. If performance declines discontinuously with birth cohort, we will interpret this as a generation effect. More specifically, we will look for any dis-continuity appearing at the birth cohort of about 1960, when the predefined EM-gen-eration changed into the S-genEM-gen-eration. Combined continuous and discontinuous effects of age and generation may also occur, but will be more difficult to analyse opera-tionally.
Experiment 1 will be concerned with user interfaces with one and two layers and experiment 2 with a three-layered user inter-face.
EXPERIMENT 1:
ONE AND TWO LAYERED USER INTERFACES
Methods
A software-based simulation was run of a videophone with either a one-layered or a two-layered user interface. Conceptual oper-ations (task content) and interaction tech-niques are held constant whereas the inter-action structure is manipulated in the num-ber of layers.
Subject’s task was to contact a person with a prescribed name in three conditions, manip-ulating the presence or absence of video and the presence of subtitling. Error performance was measured by the number of mode errors, defined as actions that do not have any effect on the device as these are execut-ed in an incorrect state (for example making a call while the telephone is switched off). Mode errors are supposedly due to erro-neous expectations about the way the sys-tem works46. In contrast to other types of error, a mode error confronts the user direct-ly with the failure of the action.
Subjects are expected to make more mode errors and operate more slowly with the two-layered as compared to the one-layered user interface. Learning may be expected by repeated actions and also by knowledge transfer from one user interface to the other. Therefore we chose for two trials with one interface followed by two trials with the other one. The experiment was conducted in 1997/98.
Subjects
Eighty subjects between 25 and 75 yrs took part in the experiment. The subjects were chosen from four age groups: 25-35 yrs (mean 30), 40-50 yrs (mean 45), 50-60 yrs (mean 55), 65-75 yrs (mean 68). The data will be plotted according to their means. Per age group there were equal numbers of males and females. The youngest group belongs to the S-generation, the other three to the EM-generation. None of the subjects had ever used a videophone before. Educational level was a high-school diploma or less, resulting in a rather homogeneous population in that respect.
The subjects did not report any problems as to manual movements, hearing, and vision.
Design
Independent variables are the user interface (single-layered or two-layered), the trial per user interface (first or second), the order of the user interface (single layered first or two-layered first) and the four age groups. A 2 x 2 x 2 x 4 counterbalanced block design was used. The order of the user interface and age served as between-subjects variables. Dependent variables were per trial the total number of mode errors and total task dura-tion.
Materials
September 2001, V
ol 1, No 1
www
.ger
ontechjournal.net
30
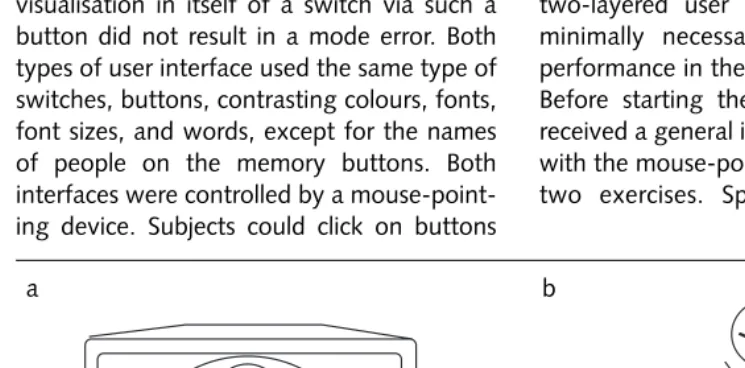
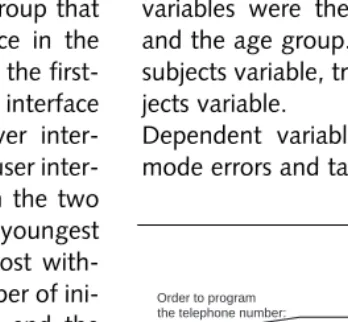
Both user interfaces had three switches: for turning the device on/off, for selecting the channel (audio, or audio and video), and for activating subtitling on/off. Furthermore there were three buttons as memory buttons for telephone numbers. Buttons and switch-es could only be used in a certain order, which was exactly the same for the two interfaces. If the subjects confused the order, this resulted in a mode error.
On the first layer of the two-layered inter-face (Figure 1b) three rectangular buttons A,B,C are present. These correspond with the spatial position of the three switches as present on the one-layered interface (Figure 1a). If on the two-layered interface one of the buttons is pressed, the corresponding switch pops up on the display in the centre of the device. The rectangular buttons did not have to be pressed in a fixed order. Hence, visualisation in itself of a switch via such a button did not result in a mode error. Both types of user interface used the same type of switches, buttons, contrasting colours, fonts, font sizes, and words, except for the names of people on the memory buttons. Both interfaces were controlled by a mouse-point-ing device. Subjects could click on buttons
and switches for activation. The experiment was run on a laptop Pentium 130. The sub-jects were seated in a quiet room that was well lit without specular reflection on the lap-top screen.
Procedure
The experiment consisted of four trials, Each subject exercised with one user interface dur-ing the first two trials and worked with the other one during the last two trials. There were no breaks between the trials. In each trial, three tasks were carried out in the fol-lowing order: calling a certain person without enabling the video screen, calling a person after enabling the video screen without sub-titling, and calling a person after enabling the videoscreen after having activated the subti-tling of incoming speech. On the one-lay-ered user interface, nine steps were the min-imum for carrying out the three tasks, on the two-layered user interface 15 steps were minimally necessary. Therefore, optimum performance in the four trials is 48 steps. Before starting the first trial, each subject received a general introduction and practised with the mouse-pointing device by means of two exercises. Specific instructions were
off +
on yes
no
audio audio video subtitling
name 2 name 1
name 3
(B)
(C) (D)
(A)
name 1
name 2 name 3
no subtitling yes audio video audio + off on
If C: If B: If A:
Figure 1. a Simulated single-layer videophone user interface. b Simulated two-layer videop-hone user interface. The upper part depicts the switch that appears on display D if button A,B, or C was pressed. Words were in fact presented in Dutch.
September 2001, V
ol 1, No 1
www
.ger
ontechjournal.net
31 given before each user interface was
han-dled. After the final trial, each subject was asked about any prior computer and mouse experience.
Results: Mode errors
With optimum performance at 48 steps, on average 87 steps were needed by the youngest group and 164, 104, and 129 steps respectively by the 40-50, 50-60, and 65-75 yrs groups. These include correct actions, mode errors, and a small number of redun-dant steps. On average, the groups from young to old finished the four trials in 5min 29s, 10 min 37s, 12 min 38s, and 17min 5s.
Mode error transformation
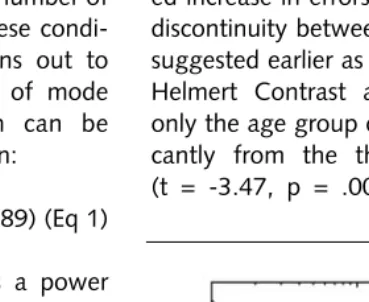
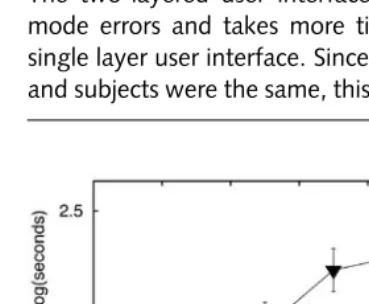
Each subject took part in four trials. Combined with the eight combinations of age group and interface order, this resulted in 32 conditions with 10 scores of number of mode errors per condition. For these condi-tions, the standard deviation turns out to increase with the mean number of mode errors (Figure 2). This relation can be described by the following function:
log s(x) = 0.35 + 0.69 log x (r = 0.89) (Eq 1)
So the standard deviation s(x) is a power function of the mean x with exponent 0.69. For further analyses such as ANOVA repeat-ed measures, the standard deviation should be independent of the mean. This can be accomplished47by raising the raw data to the power of 0.31, i.e. 1 – 0.69. From here on, only the monotonically transformed data will be used. Earlier analysis of untransformed data showed similar results48.
Analysis
A 2 x 2 x 2 x 4 ANOVA mixed repeated measures (user interface by trial per user interface by interface order by age) was car-ried out with the transformed number of mode errors as dependent variable. Mauchsly’s test of sphericity indicated that the variance was indeed homogeneous (Mauchly’s W= 1.0). Four main effects were
significant: age (F(3,72)= 4.31, p= .008, power = .85), user interface (F(1,72)=30.8, p=.000, power = 1.0), trial per user interface (F(1,72)= 122.88, p=.000, power = 1.0), and interface order (F(1,72)=7.82, p=.007, power = .80). Significant interactions were: order by user interface (F(1,72) =94.38, p=.000, power = 1.0), order by trial-per-user-interface (F(1,72)= 4.38, p=.040, power = .46), and the four way interaction (F(3,72) = 2.77, p = .048, power = .28).
Age and generation
Figure 3 depicts mode error performance per user interface and age group across trial and order. The two-layered interface elicits more errors than the single-layered interface whereas the younger age group makes fewer errors than the three older age groups. The three older groups do not show an age–relat-ed increase in errors. The pattern shows the discontinuity between the age of 30 and 45 suggested earlier as a generation effect. The Helmert Contrast analysis confirmed this: only the age group of 25-35 differed signifi-cantly from the three older age groups (t = -3.47, p = .00). The three older age
Figure 2. Standard deviations of mode errors in relation to average number of mode errors. Each data point represents the average of 20 subjects. For each age group, high scores generally concern first
September 2001, V
ol 1, No 1
www
.ger
ontechjournal.net
32
groups all showed a similar error perform-ance (40-50 yrs versus the two older groups: t = 0.88, p = .37 and between the two old-est groups: t = 0.58, p = .56). Fig 2 also sug-gests that there was no difference between the one-layered and two-layered interface as to the relation between error performance and age. This was confirmed by the ANOVA repeated measures showing no interaction between age and user interface (F(1,72) = 1.34, p =.27).
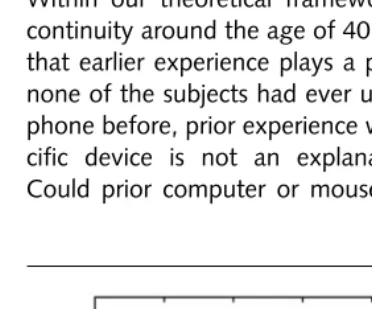
Within our theoretical framework, the dis-continuity around the age of 40 yrs suggests that earlier experience plays a part here. As none of the subjects had ever used a video-phone before, prior experience with the spe-cific device is not an explanatory factor. Could prior computer or mouse experience
explain the results? Table 1 shows per age group the proportion of subjects with expe-rience with computer and mouse. Expeexpe-rience diminishes with increasing age in a rather continuous manner; the possible discontinu-ity in mouse use is between the age groups 40-50 yrs and 50-60 yrs and so at a different age than the discontinuity in mode errors. A mixed repeated measures ANCOVA with mouse experience as the covariate showed indeed mouse experience not significant (F(1,71) = 1.00, p=.32), whereas the main effect of age was still significant (F(3,71) = 3.16, p=.03), and the Helmert Contrast analysis maintained a significant difference between the younger groups and the three older age groups (t = -2.80, p = .01). Hence, although a significant interaction between mouse experience and type of user interface (F(1,71)= 7.88, p = .01) indicated that mouse experience may help subjects using the two-layered interface, it did not explain the discontinuity.
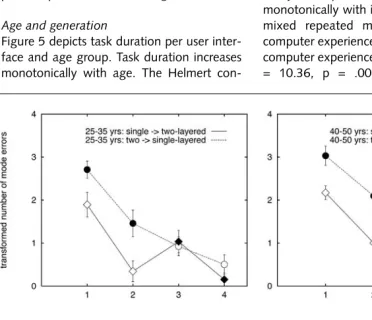
Figure 4 shows errors as a function of trial number and order of using single and two-layered user interfaces. It is obvious that all age groups learn substantially. Roughly, the four age groups follow the same pattern. All groups were able to learn by repetition. The youngest group shows most reduction of transformed errors in the second trial. This was confirmed by the Helmert contrast analysis (t = -2.26, p = .03). The transitions from trial 2 to trial 3 indicate that there is generalisation of learning from one interface to the other. The order in which the inter-faces were presented also influenced the results, as confirmed by the ANOVA mixed repeated measures mentioned earlier. Otherwise, the transformed data are not the best means of analysing learning effects in more detail, and we leave this for later analysis.
Results: Task duration
As is usual for time measures in this type of experiments, the task duration data were log-transformed47. The Mauchly sphericity test indicated homogeneous resulting
vari-Figure 3. Transformed mode error perfor-mance as a function of age group for the two interfaces. Vertical bars in this and fol-lowing figures denote twice the standard error of the mean.
Table 1: Proportions computer and mouse experience per age group.
age category computer mouse
25-35 .90 .90
40-50 .75 .80
50-60 .65 .40
September 2001, V
ol 1, No 1
www
.ger
ontechjournal.net
33 ances. (W= 1.0). The 2 x 2 x 2 x 4 ANOVA
mixed repeated measures with task duration per trial as dependent measure showed sig-nificant main effects of age (F(3,72)= 15.99, p = .00, power = 1.0), user interface (F(1,72) = 73.26, p = .00, power = 1.0), and trial number per user interface (F(1,72) = 145.07, p = .00, power = 1.0). Furthermore, the two way interaction of order by user interface (F,1,72) = 91.02, p = .00, power = 1.0) and the three way interaction order by user inter-face by trial per user interinter-face (F(1,72 = 5.12, p = .03, power = .65) were significant.
Age and generation
Figure 5 depicts task duration per user inter-face and age group. Task duration increases monotonically with age. The Helmert
con-trast analysis indicates that the youngest group differs significantly from the older groups (t = -5.78, p = .00) and also the 4050 group from the two older groups (t = -3.30, p = .00). The difference between the two oldest groups just fails to reach signifi-cance ( t = -1.92, p =.06). For both inter-faces, the results can be described as an age effect and no discontinuity seems present.
We have checked whether computer experi-ence can explain the age effect, since partic-ularly computer experience decreases monotonically with increasing age as well. A mixed repeated measure ANCOVA with computer experience as covariate shows that computer experience was significant (F(1,71) = 10.36, p = .00) as is the interaction
September 2001, V
ol 1, No 1
www
.ger
ontechjournal.net
34
between computer experience and user interface (F(1,71) = 4.92, p = .03), but the age effect remains (F(3,71) = 10.31, p =.00). All subjects showed shorter task duration by repetition and also the learning effect gener-alised toward the second interface. Since these effects are in full agreement with the literature23, 30, we will not elaborate on this.
Discussion
The two-layered user interface elicits more mode errors and takes more time than the single layer user interface. Since task content and subjects were the same, this is a clear-cut
result that agrees with the literature13, 14. It substantiates the difficulties for the user of hidden aspects of the user interface, even for just two layers. Perceptually hidden aspects put a load on working memory in an effort to be constantly and instantly available to the user for action.
The main new finding is that age group dif-ferences in mode errors suggest a discontin-uous generation effect, whereas in the same experiment, task duration shows the well-known continuous influence of age. The EM-generation (40 –75 yrs) had more difficulty using the videophone simulation than the S-generation. Moreover, between the three age groups of the EM-generation no differ-ences in mode errors occurred. In line with the general generation theory developed in the social sciences33, 34and extended toward experience with technology during the form-ative years41-43, we find a generation effect in mode errors. Generation–related lack of experience and knowledge about software style interfaces confronts the user born before 1960 or so with difficulties.
We have looked in the literature for similar type of experiments and found two other relevant studies. In 1996, Czaja49, using a data entry task, and later Czaja and Sharit26 in experiments with a consumer electronics product, found a discontinuity in error per-formance between 30 and 50 yrs (Figure 6), whereas task duration showed a continuous increase with age. Although their study had a different framework, this seems to be in agreement with the findings in the present study. Another study used only two age groups from which no such conclusions can be drawn23. It is interesting that speed or duration measures seem to have a different background than error measures. Speculatively, we might contribute the user’s time management according to general information processing capacities that decline with increasing age. The errors reflect the user’s specific skills in understanding or handling the new systems that for older
sub-Figure 5. Log task duration as a function of age group for the two interfaces.
September 2001, V
ol 1, No 1
www
.ger
ontechjournal.net
35 jects are related to generation-bound lack of
experience with the specific interaction style of present software user interfaces.
The discontinuity between the EM-genera-tion groups and the S-groups also applies to the single-layered structure. This was not quite expected since the single layer user interface resembles the earlier electro-mechanical user interfaces in that all avail-able functionality is visualised simultaneous-ly. It might be the case that the software way in which the experiments have been per-formed induced such differences. In the liter-ature two earlier studies that tried to find easier user interfaces, concerning a screen-based editor12and a grid display13found that the simplifications did not eliminate age differences.
The transition from the single-layer interface toward the two-layer interface causes trou-ble to the user but mode errors are less than for the subjects of the same age group that started with the two-layer interface in the first trial. Similarly there is a gain in the first-time use of the single-layer user interface from experience with the two-layer face. With increased experience of user inter-face and task, differences between the two interfaces level out. At the end, the youngest group (S-generation) operates almost with-out errors. However, the large number of ini-tial errors by the youngest group and the presence of the generation effect suggest that this will not generalise toward different tasks and different user interfaces of the software type. Although there is a tendency that the oldest group learns somewhat less effectively than the younger groups of the EM-generation, this cannot be substantiated from the present data.
EXPERIMENT 2:
A THREE-LAYERED USER INTERFACE The purpose of this experiment is to test whether the results from the first experiment can be generalised toward a more complex, three-layered user interface. A simulation of a mobile phone has been used featuring a
three-layer user interface and two tasks. The experiment was conducted in 1998/99.
Methods
Subjects
Forty subjects between 25 and 75 yrs took part. The youngest group belonged to the S-generation: 25-35 yrs (mean 31), the three other groups to the EM-generation: 40-50 yrs (mean 46); 50-60 yrs (mean 55), and 65-75 yrs (mean 69). Education level was high school diploma or bachelor degree, equally divided in each of the groups. Also an equal number of males and females was present in each group. The subjects did not have any self-reported problems with manual move-ments, hearing, and vision.
Design
A 2 x 4 design was applied. Independent variables were the trial (first and second), and the age group. Age served as between-subjects variable, trial number as within-sub-jects variable.
Dependent variables were the number of mode errors and task duration per trial.
C B A < >
1 2 3 4 5 6 7 8 9
* 0 #
off on
5 10x) 4 1 2
3 4 (2x)3
2
1 the telephone number:
Order to program Order to program
the colour of the cove
September 2001, V
ol 1, No 1
www
.ger
ontechjournal.net
36
Materials
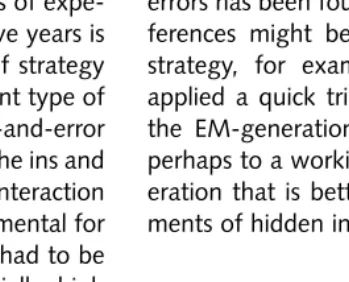
A mobile phone user interface was simulated using Microsoft Visual Basic 4.0 in the Windows 3.11 environment. Figure 7 depicts the interface. Two rather complex tasks were implemented: to program telephone num-bers and to change the colour of the cover. The user interface was provided with buttons and a display. The buttons represented 10 digits, a *, a #, two function buttons, a con-firmation button, two arrow buttons, and three memory buttons. Mode errors could be made by clicking the confirmation, memory, or arrow buttons in the wrong mode. All but-tons and words were clearly and equally vis-ible. Activation was by means of a mouse-pointing device. The experiment was run on a laptop Pentium 130. The subjects were seated in a quiet room that was well lit with-out specular reflection on the screen.
Procedure
The experiment consisted of two trials with-out a break. Within each trial, two tasks were executed in a fixed order. The participants were first asked to change the colour of the cover from red to blue. Next they were asked to program their own home telephone num-ber under button C. In Figure 7, the opti-mum ways of performing the tasks are indi-cated. Both consist of first pressing a func-tion button, next the confirmafunc-tion button, and then either the direction buttons to change the colour or the telephone number followed by the confirmation button.
The first task had to be fulfilled before enter-ing the second one. A minimum of 19 steps was needed for carrying out the two tasks of each trial. Before starting the experiment, the subjects were given a general introduction and they practised with the mouse-pointing device. After the final trial, each subject was interviewed as to experience in the use of computer, mouse, and mobile phone.
Results: Mode errors
With optimum performance for the two trials at 38 steps, on average 172 steps were made
by the 25-35 group, 418 steps by the 40-50 group, 439 steps by the 50-60 group, and 474 by the 65-75 group. The totals include the 38 necessary steps, the number of mode errors, and the number of redundant steps, somewhat more expressed than in experi-ment 1. Average total task duration was 6 min 8 s for the youngest group, 19 min 1 s for the 40-50 group, 20 min 27 s for the 50-60 group and 43 min 15 s for the 65-75 group.
Mode error transformation
As in Experiment 1, the standard deviation increased with the mean number of mode errors (Figure 8) as described by the follow-ing regression equation:
Log s(x) = .11 + .87 log (x) (r= .88) (Eq 2)
Accordingly, all raw scores were transformed by raising these to the exponent 1.00 - .87 = .13. Only the transformed data were used for the analysis.
Mode errors
A 2 x 4 ANOVA repeated measure has been carried out with the transformed number of mode errors per trial as dependent variable. Significant were the main effects of age (F(3,36)= 4.68, p = .01, power = .87), and trial (F(1,36)= 99.73, p = .00). The interac-tion between age and trial appeared non-sig-nificant (F(3,36) = 1.73, p = .18, power = .11).
Age and generation
September 2001, V
ol 1, No 1
www
.ger
ontechjournal.net
37 So generation–related difference in
experi-ence appears to play a role. Surprisingly, no subject had ever used a mobile phone before (i.e. before 1998/99). Therefore, prior expe-rience with such a device cannot explain the differences. Could computer and mouse experience play a part? Table 2 gives the pro-portions of subjects with mouse and com-puter experience prior to the experiment. Computer experience turns out to decline with age, also for the three older groups, and mouse experience shows some difference between the 40-50 and the 50-60 groups. Both are different from the transformed mode errors. This is confirmed by an ANCO-VA with mouse experience as covariate. The factor mouse experience was not significant (F(1,35) =.21, p = .65), the main effect of age remained: (F(3,35) = 4.35, p = .01), and the Helmert contrast analysis again showed a significant difference between the youngest group and the three older groups (t = -3.58, p = .00). So the results confirm the earlier found difference between the EM-genera-tion and the S-generaEM-genera-tion as to mode errors. As to the learning effects, all age groups made fewer errors in the second trial where-as no significant interaction between age groups and trial number was found.
Results: Task duration
Task duration data were again log-trans-formed and Mauchsly’s sphericitiy test
indi-cated thay the variances of the transformed data were homogeneous (W = 1.0). The 2 x 4 ANOVA repeated measures with task dura-tion per trial as the dependent measure showed main effects of age (F (3,36) = 15.42, p =.00, power = .87), and of trial number (F(1,36 = 197.33, p = .00, power = 1.0). Figure 10 depicts transformed task duration as a function of mean age of each of the four groups. Task duration appears to increase monotonically with age. The Helmert contrast analysis showed that the 25-35 group differs from the three older groups (t = -6.07, p = .00) and also from the 40-50 group (t = -2.64, p = .01). Only the difference between the two oldest groups fails to reach significance (t = .1.57, p = .13). Such age effect can be ascribed to general cog-nitive and/or perceptual-motor behaviour. The second trial showed shorter task duration as compared to the first, and the age effect per-sisted.
Discussion
The results of the second experiment with a
Figure 8. Standard deviation of mode errors as a function of average mode errors. Each data point represents 10 subjects.
Figure 9. Transformed mode error perfor-mance as a function of age group for a three-layered user interface.
Table 2: Proportions computer and mouse experience per age group in experiment 2.
age category computer mouse
25-35 1.00 .80
40-50 .80 .80
50-60 .70 .60
September 2001, V
ol 1, No 1
www
.ger
ontechjournal.net
38
three-layered user interface are similar to the results of the first in that mode errors reflect a difference between the EM-generation and the S-generation around the birth cohort of 1960, whereas task duration reflects age effects as such. Recent experience with more recent devices such as computer, mouse, or mobile phone does not explain the generation differ-ences. So again there is dissociation between mode errors reflecting generation differences and task duration related to age-dependent cognitive and perceptual-motor changes.
Although it is likely that the user interface with three layers in experiment 2 was more difficult than the user interface with one or two layers in experiment 1, such comparison cannot be made because of the differences in task and in subjects between the two exper-iments. However, the high numbers of errors clearly indicate the considerable difficulties that the subjects experience with the three-layered user interface.
The persistence over so many years of expe-riences built up during the formative years is suggestive of certain persistence of strategy when confronted with a more recent type of user interface. A strategy of trial-and-error that may be useful for finding out the ins and outs for a device with a software interaction style would have been rather detrimental for the earlier EM-devices since these had to be handled rather carefully. The initially high number of mode errors by the youngest age group in experiment 1 is suggestive of such a quick learning strategy by trial-and-error. Also it might be the case that of the S-generation working memory has been trained better to pick up perceptual-motor or cognitive aspects of layered user interfaces. However, the present experiments do not provide further evidence as to the reasons behind the generational persistence.
CONCLUSION
In the beginning of the 1980’s, the interac-tion style of electronic consumer devices changed from an electro-mechanical style
user interface toward a software style user interface. In two experiments it appears that experience with the interaction style during early adulthood, before the age of 25, is per-sistent and influences actual interaction with software style interfaces in the late 1990’s. Assuming a diffusion period of about 5 years, the birth cohort of 1960 has been identified as the time of transition between the electro-mechanical generation and the software generation. The two experiments with simulated devices with a software style of interaction confirm the initial hypothesis.
The generation of birth cohorts that grew up with electro-mechanical user interfaces of consumer devices, displays different behav-iour than later birth cohorts when handling software style user interfaces with one, two, or three menu layers. The difference between the EM-generation and the S-gen-eration shows up in the higher number of mode errors of the EM-generation. Within the EM-generation, no age effect in mode errors has been found. The generational dif-ferences might be due to a different user strategy, for example if the S-generation applied a quick trial-and-error learning that the EM-generation did not dare to use or perhaps to a working memory of the S-gen-eration that is better geared to the require-ments of hidden interface layers.
September 2001, V
ol 1, No 1
www
.ger
ontechjournal.net
39 In the same experiments, task duration has
been found to increase monotonously with increasing age in conformance with the liter-ature, and seems unrelated to generation dif-ferences.
Hidden interface layers put a considerable load on working memory as to perceptuo-motor or cognitive aspects. This is true for all age groups. In our experiments all age groups gradually overcame the difficulties. However, it is likely that for subjects older than the present age groups, say above 75 yrs, the difficulties might become insur-mountable so that they would simply give up. Similarly, more difficult tasks or more complex user interfaces than in the present experiments might simply make the tasks impossible for older subjects. The functional-ity would then become inaccessible. Here is a challenging task for designers of software-type user interface who wish to take older users seriously.
Acknowledgements
The research is part of the project Technology Generations commissioned by Philips Design and partly subsidised by the Netherlands Ministry of Economic Affairs. The project was initially co-ordinated for Philips by Cees de Bont, followed by Sidney Vastenhout, Hans de Waard, Carel Vereijken, and presently Mili Docampo Rama. Other members of the team were Liesbeth Scholten and Juliana Kelley for Philips Design, Anne-Geerte van de Goor and Henk Becker for Utrecht University Sociology Department, and from Eindhoven University of Technology Don Bouwhuis, Boris de Ruyter, and John de Vet for the Institute for Perception Research IPO, Frederiek van der Kaaden, Geert Verbong, and Harry Lintsen for the section History of
Technology and Jan Rietsema for the Institute for Gerontechnology. Arlette Oosterholt and Luc Gijs assisted us in the experiments.
References
1. Stewart T. Physical interfaces or “obviously it’s for the elderly, it’s grey, boring, and dull”. In Bouma H, Graafmans JAM, editors.
Gerontechnology. Amsterdam: IOS Press 1992. 2. Freudenthal A. Transgenerational design of
“smart products”, a checklist of guidelines. In Graafmans J, Taipale V, Charness N, editors.
Gerontechnology: A Sustainable Investment in the Future. Amsterdam: IOS Press 1998. 3. Colbert M. Style guides and their application:
the case of Microsoft “Windows” and a remote tutoring environment. Behaviour and Information Technology 1997; 16: 25-42. 4 Rauterberg M. An empirical comparison of
menu selection and desktop computer programs carried out by beginners and experts. Behaviour and Information Technology 1992; 4: 227-236. 5. Schneiderman B. Direct Manipulation: A step beyond programming languages. Ph.D. the-sis, University of Maryland 1983.
6. Wiedenbeck S, Davis SA. The influence of interaction style and experience on user per-ceptions of software packages. Journal of Human–Computer Studies 1997; 46: 563-588. 7. Hutchins EL, Hollan JD, Norman DA. Direct
manipulation interfaces. Human-Computer Interaction 1985; 1: 311-338.
8. Vet J de, Ruyter B de. An Inventory of Interaction Styles. Report 1113 Institute for Perception Research IPO. Eindhoven, the Netherlands 1996. 9. Docampo Rama M, Kaaden F van der. The
User-Interface of Consumer Electronics: Historical overview of interaction styles in the Netherlands, 1963-1996. Report 1194 IPO Center for Research on User-System
Interaction. Eindhoven, the Netherlands 1998. 10. Baddeley AD. Working Memory. Oxford:
Clarendon Press 1986.
11. Logie RH. Visuo-spatial Working Memory. Hove: Lawrence Erlbaum Associates 1995. 12. Gomez L, Egan D, Wheeler E, Sharma DK,
Gruchacz A. How interface design determines who has difficulty learning to use a text edi-tor. Proceedings of CHI ’83 Human Factors in Computing Systems: p. 176-181. New York: Association of Computing Machinery 1983. 13. Detweiler MC, Hess SM, Ellis RD. The effects of
display layout on keeping track of visuo-spatial information. In Rogers WA, Fisk AD, Walker N, editors. Aging and Skilled Performance: Advances in theory and applications. p. 157-184. Mahwah, NJ: Lawrence Erlbaum Associates 1996. 14. Landauer TK, Nachbar DW. Selection from
alphabetic and numeric menu trees using a touch screen: Breadth, depth, and width. In Borman L, Curtis B, editors. Human Factors in Computing Systems II. Amsterdam: Elsevier Science Publishers 1985.
15. Craik FIM, Bosman EA. Age-related changes in memory and learning. In Bouma H, Graafmans JAM, editors. Gerontechnology. Amsterdam: IOS Press 1992.
September 2001, V
ol 1, No 1
www
.ger
ontechjournal.net
40
Arenberg D, Thompson LW, editors. New direc-tions in Memory and Aging, p.1-17. Hillsdale, NJ: Lawrence Erlbaum Associates 1980. 17. Hultsch DF, Dixon RA. Learning and memory
and aging. In: Birren JE, Schaie KW, editors. Handbook of the Psychology of Aging, 3rd edi-tion. New York: Van Nostrand Reinhold 1990. 18. Salthouse TA, Skovronek E. Within-context
assessment of age differences in working memory. Journal of Gerontology: Psychological Science 1992; 47:10-120. 19. Howard JH, Howard DV. Learning and Memory.
In Fisk AD, Rogers WA, editors. Handbook of Human Factors and the older Adult. p.7-26. San Diego: Academic Press 1997.
20. Salthouse TA. Theoretical Perspectives on Cognitive Aging. Hillsdale, NJ: Lawrence Erlbaum Associates 1991.
21. Raven JC. Guide to the Standard Progressive Matrices. London: H.K.Lewis 1960.
22. Schaie KW. The Seattle longitudinal study: A 21-year exploration of psychometric intelligence in adulthood. In Schaie KW, editor. Longitudinal studies of adult psychological development. p.64-135. New York: Guilford Press 1983. 23. Salthouse TA, Hambrick DZ, Lukas KE, Dell TC.
Determinants of adult age differences on syn-thetic work performance. Journal of Experi-mental Psychology: Applied 1996; 2: 305-329. 24. Freudenthal TD. Learning to Use Interactive
Devices; Age differences in the reasoning process. Ph.D.thesis. Eindhoven University of Technology 1998.
25. Reason J. Human Error. New York: Cambridge University Press 1990.
26. Czaja SJ, Sharit J. Ability-performance relation-ships as a function of age and task experience for a data entry task, Journal of Experimental Psychology: Applied 1998; 4: 332-351. 27. Cerella J, Poon LW, Williams DM. Age and
the complexity hypothesis. In Poon LW, edi-tor. Aging in the 80s. Psychological issues. p. 332-340. Washington,DC: American Psychological Association 1980.
28. Anderson JR. The Architecture of Cognition. Cambridge, MA: Harvard University Press 1983. 29. Searleman A, Douglas H. Memory from broad-er Pbroad-erspective. New York: McGrawHill 1994. 30. Kelley CL. Age, Experience, and Transfer
across Word Processors. Ph.D. thesis University of Waterloo 1996.
31. Singley MK, Anderson JR. The transfer of text-editing skill. International Journal of Man-Machine Studies 1985; 22: 403-423. 32. Czaja S, Sharit J. Age differences in the
per-formance of computer-based work.
Psychology and Aging 1993; 8: 59-67. 33. Glenn ND. Cohort Analyses. In Uslaner EM,
editor. Series: Quantitative Applications in the Social Sciences. Beverley Hills, Cal: SAGE Publications Inc. 1977.
34. Cutler SJ, Kaufman RL. Cohort changes in politi-cal attitudes; tolerance of ideologipoliti-cal nonconfor-mity. Public Opinion Quarterly 1975; 2: 68-81. 35. Becker HA. Generaties en hun Kansen.
Amsterdam: Meulenhoff 1992.
36. Becker HA. Discontinuous change and genera-tional contracts. In: Arber S, Attiats-Donfut C, editors. The myth of generational conflict. p 114-132. England: Routledge & Keegan-Paul 2000. 37. Piaget J, Inhelder B. Memory and
Intelligence. New York: Basic Books 1973. 38. Keating DP. Thinking processes in adolescence.
In Adelson J, editor. Handbook of Adolescent Psychology. New York: Wiley 1980.
39. Neimark ED. Adolescent thought: Transition to formal operations. In Wolman BB, Strickler G, editors. Handbook of Developmental
Psychology. Englewood, NJ: Prentice Hall 1982. 40. Sroufe LA., Cooper RG. Child Development:
Its nature and course. New York: Alfred A. Knopf Inc. 1988.
41. Sackmann R, Weymann A. Die Technisierung des Alltags: Generationen und technische Innovationen. Bremen: BMFT 1994. 42. Becker HA, Goor A van de. Key components
of the model explaining the emergence and development of general generations. Report 8. Department of Sociology. University of Utrecht, the Netherlands 1997.
43. Goor A van de, Becker HA. Technology Generations in the Netherlands: a sociological Analysis. Maastricht: Shaker 2001.
44. Rogers M. Diffusion of Innovations, 3rd ed. New York: Free Press 1983.
45. Baudet H. Een vertrouwde Wereld: 100 jaar Innovatie in Nederland. Amsterdam: Bakker 1986. 46. Johnson J. Modes in non-computer devices.
International Journal of Man-Machine Studies 1990; 32: 423-438.
47. Winer BJ, Brown DR, Michels KM. Statistical Principles in experimental Design, 3rd ed . New York: Mc Graw Hill Inc. 1991. 48. Docampo Rama M. Age-related effects in
working with layered interfaces. IPO Annual Progress Report 1997; 32: 19-26.