Effect of Earnings Management on Economic Value Added:
A China Study
Yishu Wang1,2, Xue Jiang1, Zhenjia Liu1,2 & Weixing Wang1,2 1 School of Business, Changzhou University, Changzhou City, Jiangsu Providence, China
2 Institute of Internal Control in Government & Nonprofit Organizations, Changzhou University, Changzhou City,
Jiangsu Providence, China
Correspondence: Yishu Wang, School of Business, Changzhou University, Changzhou City, Jiangsu Providence, China; Institute of Internal Control in Government & Nonprofit Organizations, Changzhou University, Changzhou City, Jiangsu Providence, China. E-mail: [email protected]
Received: February 4, 2015 Accepted: April 29, 2015 Online Published: May 11, 2015 doi:10.5430/afr.v4n3p9 URL: http://dx.doi.org/10.5430/afr.v4n3p9
Abstract
Earnings management is the judgement exercised by managers in financial reporting, which can be used to mislead stakeholders about reported accounting numbers. Economic value added (EVA) is used to obtain the real value of shareholder wealth; however, EVA is based on financial statements and is used to measure the value of competing companies, which likely motivates managers to engage in earnings management regarding EVA.
This paper thus addresses the association between earnings management and EVA in China and investigates whether earnings management influences a firm’s EVA regarding capital cost, providing investors with a method of determining the true value of enterprises. An analysis of earnings management is also presented based on data from 2003 to 2013 (excluding 2008). A significant positive relationship exists between earnings management through discretionary accruals (DAs) (Jones model, discretionary working capital accruals) and unadjusted EVA, a significant inverse relationship exists between earnings management through DAs (Jones model, current DAs, discretionary working capital accruals) and adjusted EVA (join adjusted items), a significant positive relationship exists between earnings management through DAs (current DAs) and adjusted EVA (join adjusted items and economic deprecation adjusted items), and a significant inverse relationship exists between earnings management through DAs (Jones model, discretionary working capital accruals) and adjusted EVA (join adjusted items and economic deprecation adjusted items).
Keywords: Earnings management, Economic value added, Discretionary accruals, Real earnings management,
Weight average capital cost
1. Introduction
Earnings management occurs when managers structure transactions to adjust financial reports to mislead stakeholders about reported accounting numbers (Healy and Wahlen, 1999). Earnings management research has largely been focused on determining whether earnings management occurs, what motivates earnings management (Chang, Hsin and Hou, 2013; Zhang and He, 2013; Nagata, 2013; Shu and Chiang, 2014; Jha, 2013; Farrell, Unlu and Yu,2014; Lin and Wu, 2014), and the value of capital incentives to manage earnings (Kim and Sohn, 2013; Salteh and Valipour, 2012).
Assessing the real value of corporations is critical for stakeholders. Traditional accounting indices for measuring company performance include return on assets (Bailey and Helfat, 2003), earnings per share (Neumann and Voetmann, 2005), and return on equity (Peng, 2004). Such measurements are generated from financial statements that follow generally accepted accounting principles (GAAP), which require that financial statements be prepared conservatively.
EVA is based on financial statements and is used to measure the value of competing companies, which likely motivates managers to engage in earnings management regarding EVA. Overall, EVA may not reflect true company performance. EVA is the profit earned by a company minus the cost of financing the firm’s capital (Stewart, 1991). However, company capital not only influences company finance but also company competitive strategy. By investigating whether earnings management influences company EVA from the perspective of capital cost, this study provides investors with a method of analyzing the true value of enterprises.
Over the past three decades, China has made enormous economic progress, and companies with high growth potential, particularly those that are technology-intensive and innovative, have been instrumental to China’s industrialization. Furthermore, the continued health of these companies is essential to maintaining China’s global economic competitiveness. Our study is critical because it is the first study to examine the association between EVA and earnings management in China. The remainder of the paper is organized as follows. Section 2 presents a brief review of the related literature. Section 3 provides details of the research design and sample selection procedure and develops our model. Section 4 presents our empirical findings. Section 5 contains a summary and conclusions.
2. Literature Review
2.1 Economic value added (EVA)
EVA is a frequently applied indicator in the praxis of financial analysis. Sirbu (2012) showed that traditional methods of calculating company value are not strongly related to the actual value created by companies, indicating that EVA is emphasized as a management tool because it aligns the objectives of managers with those of shareholders, improves accountability, and enhances the objectivity of performance analysis. Bahri, St-Pierre and Sakka (2011) showed that EVA can be a useful tool for performance management in small- and medium-sized enterprises when used in conjunction with a list of business practices that affect company results. In addition, they indicated that some business practices have a direct impact on EVA within one year, whereas others have a deferred influence. However, they concluded that the influence of other practices on EVA are weak or insignificant. Regarding the factors that influence EVA, Moradi ,Ghomian and Fard (2012) indicated that profitability, company size, growth potential, and intangible assets have a significant positive relationship with EVA, whereas capital structure has a significant negative relationship with EVA; however, the relationships between EVA and both management ability and inventory management are nonsignificant. Haque, Siddikee, Hossain, Chowdhury and Rahman (2013) showed an inverse relationship between dividend payout and EVA and recommended continuing the established dividend policy of retaining a large portion of earnings rather than a high payout ratio. This recommendation was based on shareholder value theory discouraging the distribution of earnings through dividends because it implies inefficiency on the part of management regarding the maximization of shareholder wealth. Martani and Saputra (2009) found that samples in a high-corporate-governance index group had higher EVAs than samples in a low-corporate-governance index group. Additionally, they found that sales growth, leverage, size, and company age exert a significant positive effect on EVA. Tseng (2008) found that internal research and development (R&D) can positively affect a firm’s EVA, and imported technology exerts no significant effect on EVA. Furthermore, they determined that internal R&D contributes to a firm’s EVA in addition to imported technology, physical capital, and labor.
2.2 Earnings Management
of debt-covenant violations to improve their bargaining power in the renegotiation that follows the violation. Furthermore, this study finds no evidence that high-debt firms engage in excessive earnings management to stave off a violation; the Sarbanes–Oxley Act appears to have restrained managers from using accruals to stave off violations. Farrell, Unlu and Yu (2014) determined that firms that are highly likely to engage in earnings management appear to use high-financing constraints to increase the use of accrual-based earnings management and reduce the use of other REM techniques. Lin and Wu (2014) reported cosmetic earnings management in developed and emerging markets. In contrast with those in developed markets, corporate managers in emerging markets have more incentive to manipulate earnings. More importantly, the degree of earnings management is significantly lower after corporate governance regulations are implemented in developed and emerging markets, indicating that implementing corporate governance regulations is critical to reducing earnings management.
However, Gong, Louis and Sun (2008) suggested that firms experience abnormal postrepurchase returns when post-repurchase realized earnings growth exceeds expectations formed on the basis of pre-repurchase deflated earnings numbers. Chin, Chen and Hsieh (2009) found that greater corporate internationalization is associated with high earnings management by discretionary accruals (DAs) and the likelihood of meeting or marginally exceeding analyst forecasts. Gunny (2010) showed that firms meeting earnings benchmarks through real earnings management and earnings management through real activities management is not opportunistic, which is consistent with managers’ attaining benefits that allow for improved future performance or signaling. Jackson and Liu (2010) found that firms manage negative debt expenses downward to meet or exceed analyst earnings forecasts. Boone, Khurana, Raman (2012) suggested that higher concentrations at local levels are associated with greater auditor tolerance for earnings management; in other words, this is associated with an increased likelihood of clients with nondiscretionary earnings (i.e., earnings before DAs) below the earnings target using income-increasing DAs to meet or exceed earnings benchmarks.
2.3 Relationship between earnings management and capital costs
Strobl (2013) suggested that earnings management can influence a firm’s cost of capital because the dependence of the manager’s manipulation strategy on the state of the economy has critical implications for the risk premium that market participants demand in order to hold the firm’s stock. Salteh and Valipour (2012) showed that enterprise earnings are affected by accounting methods and accounting estimates that can be subject to manipulation by managers, which is influenced by special objectives. They demonstrated a significant inverse relationship between DAs and the weighted average cost of capital and inferred that enterprises with weak performance have stronger incentives to increase their reported earnings through earnings management. Investors typically undervalue businesses suffering from loss of capital cost resulting from weak business performance as well as declining stock prices. Moreover, investors tend to undervalue the capital market growth rate for capital costs. Therefore, managers attempting to escape this situation likely have stronger incentives to exaggerate their earnings and stock prices as well as present a higher growth rate to generate more favorable perceptions of their business, which subsequently leads to decreased weighted average capital costs. EVA is the profit earned by a company minus the cost of financing the firm’s capital. Therefore, firms with lower capital have higher EVA. Accordingly, we propose Hypothesis 1 as follows:
H1: Earnings management through DA manipulation of earnings has a significantly positive relationship with economic value added.
3. Methodology
Using earnings management to predict economic value added, this study collected data from 2003 to 2013 (Note 1) from COMPUSTAT database (excluding 2008). A regression model was adopted to analyze data. Variables of this research are as follows
3.1 Independent variables: Earnings management
DAs (Discretionary accruals) represent the component of total accruals that is more susceptible to manipulation by managers, and is has been used frequently in prior studies as a proxy for earnings management, where the absolute value of
it to measure DAs were adopted (Jones ,1991; Dechow, Sloan and Sweeney,1995; Louis, 2004; Matsumoto, 2002).it it
it it
it it
it it
TA
PPE
TA
NETREV
TA
TA
JACC
1
3 1
2 1 1 1
1
……… (1) (Note 2)
liabilities minus the depreciation expense for year t; denotes the assets for year t-1; is the
change in net revenue for year t; and is the gross fixed assets for year t.
it it it it it it it
TA
REC
REV
TA
TA
CAC
1 2 1 1 1
1
……….. (2) (Note 3)
where is the change in income before extraordinary items minus operating cash flow minus depreciation and
amortization expenses; denotes the assets for year t-1; is the change in net revenue for year t; and
represents the change in account receivables for year t.
……… (3) (Note 4)
where represents the total accruals calculated as the continuing operating net profit minus the cash flow from
operations for year t; represents the assets for year t-1; is the change in net revenue for year t; and
is the return on assets for year t.
3.2 Dependent variables: Economic value added (Note 5) This research defines the EVA model in three ways as follows: EVA1: unadjusted EVA=NOPAT-(WACC×IC)
NOPAT= Pretax operating income× (1-cash tax rate)
Invest Capital (IC) =asset- non bear debt- short securities investment –construction in process EVA2: adjusted EVA (join adjusted items) =NOPAT-(WACC × IC)
NOPAT = pretax operating income× (1-cash tax rate) +adjustment items
Invest Capital (IC) =asset-non bear debt-short securities investment-construction in process+ adjusted items
EVA3: adjusted EVA (join adjusted items and economic deprecation adjusted items (Note 6)) = NOPAT-(WACC×IC) NOPAT=pretax operating income× (1-cash tax rate) +adjustment items ± economic deprecation adjusted items Invest capital(IC) =asset-non bear debt-short securities investment-construction in
Process+ adjusted items
In addition, Weight average capital cost (WACC):
Assets
Equity
Cost
Equity
Tax
Assets
Debt
Debt
Expense
INterest
%)
1
(
Equity cost is measured by capital asset price model and calculated by
R
f
(
R
m
R
f)
.R
f is the risk free(fixed deposit interest rate in one year).
is risk Coefficient.R
mis return of market (portfolio)No bear debt = account payable + account notes +accrued expense + pre-earned revenue + other account payable +account tax payable + other current liabilities
Adjust items=un-amortization research expense (5 years, Straight-line method)+ un-amortization marketing expense (5 years, Straight-line method) + allowance for account receivable + allowance for loss on inventory + allowance for loss on short term investment securities.
3.3 Control variables:
Moradi, Ghomian and Fard (2012) demonstrated that capital structure has a significantly negative effect on EVA, whereas profitability, firm size, firm growth, and intangible assets have a significantly positive effect on EVA. We use the following variables to measure the control variables: debt ratio is used to measure capital structure, equity of average assets is used to measure profitability, sales is used to measure firm size, asset growth is used to measure firm growth, and intangible assets are used to measure firm intangible assets ability.
1
it
TA
NETREV
itit
PPE
itCAC
1 itTA
REV
itit
REC
it it it it it it it ROA TA CR TA AWCA
1 2 1 1 . 1 0 1 1 it
WCA
1 itTA
CR
it1
it
3.4 Empirical Model
The study used the ordinary least squares method. The general model used to determine which factors influence the economic value added. The empirical model is as follows:
it it it
it it
it it
n
it DAJ DB EA SIZE GROWTH IA
EVA,
0
1
2
3
4
5
6
………… (4)it it it
it it
it it
n
it DACA DB EA SIZE GROWTH IA
EVA,
0
1
2
3
4
5
6
. ………. (5)it it it
it it
it it
n
it DAWC DB EA SIZE GROWTH IA
EVA,
0
1
2
3
4
5
6
………. (6)where denotes the DAs of the Jones model for year t; represents the current DAs for year t;
represents the discretionary working capital accruals for year t;
EVA
it,nis the economic value added(n=1 for unadjusted EVA; n=2 for adjusted EVA, join adjusted items; n=3 for adjusted EVA, join adjusted items and economic deprecation adjusted items);
DB
it represents a firm’s debt ratio for year t;EA
it is the equity of averageassets for year t; and
SIZE
it denotes the sales for year t;GROWTH
it denotes the asset growth rate for year t;and
IA
it represents the intangible assets for year t. 3.5 Robustness TestIn order to avoid possible bias from extreme values, the study adopt those samples only include the sample data of from the estimated cross section for each year (excluding 2008).
4. Results and Analyses
4.1 Descriptive statistics
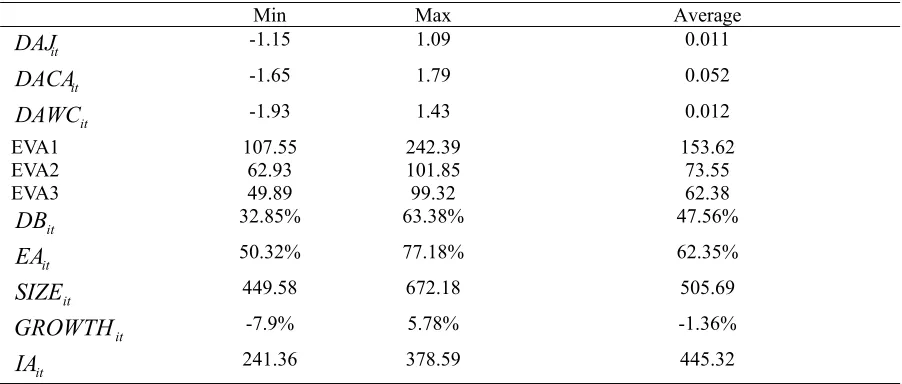
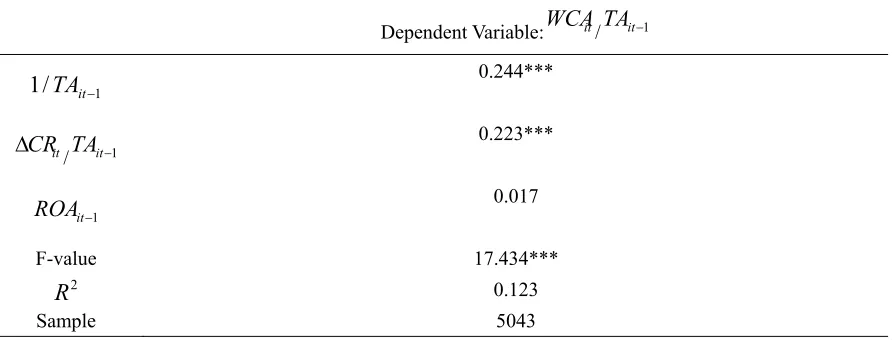
According to the descriptive statistics shown in Table 1, the mean discretionary accruals and real earnings management activities are positive. In addition, the results show that the DAs (discretionary accruals) are income-increasing, performance-adjusted discretionary items in China (Note 7). Furthermore, current DAs are higher and Jones model is lower. According to performance index (US$ billions), EVA1 (unadjusted) is higher and EVA3 (join adjusted items and economic deprecation adjusted items) is lower in China. In addition, the proportion of debt below 50% and the equity of average assets above 50% show that financial conditions have been conservative. However, the asset growth rate is negative. Tables 2-4 show the descriptive statistics obtained through the earnings management model. Jones (1991) model has stronger explanatory power (
R
2=0.654) for predicting earnings management and current DAs have weak explanatory power (R
2=0.053) for predicting earnings management. Overall, these empirical results show that Jones (1991) model is more effective for detecting earnings management in China.Table 1. Descriptive statistics: all samples (N=5043, US billions, %, Average values)
Min Max Average
-1.15 1.09 0.011
-1.65 1.79 0.052
-1.93 1.43 0.012
EVA1 107.55 242.39 153.62
EVA2 62.93 101.85 73.55
EVA3 49.89 99.32 62.38
it
DB
32.85% 63.38% 47.56%it
EA
50.32% 77.18% 62.35%it
SIZE
449.58 672.18 505.69it
GROWTH
-7.9% 5.78% -1.36%it
IA
241.36 378.59 445.32it
DAJ
DACA
itit
DAWC
it
DAJ
it
DACA
it
Table 2. Descriptive statistics of the estimated cross-section of the Jones (1991) model
Dependent Variable:
1
it it
TA
JACC
1
/
1
TA
it 3.666***1
it it
TA
NETREV
1.919***1
it it
TA
PPE
-0.394F-value 15.99
2
R
0.654Sample 5043 *:p<0.1; **: p<0.05; ***: P<0.01
Table 3. Descriptive statistics for the estimated cross-section of current discretionary accruals
Dependent Variable:
1
it it
TA
CAC
1
/
1
TA
it 4.606E7***1
it it it
TA REC
REV -0.047
F-value 13.714***
2
R
0.053Sample 5043 *:p<0.1; **: p<0.05; ***: P<0.01
Table 4. Descriptive Statistics for the estimated cross section of discretionary working capital accruals
Dependent Variable: /
1
/
1
TA
it 0.244***/
0.223***
0.017
F-value 17.434***
2
R
0.123Sample 5043 *:p<0.1; **: p<0.05; ***: P<0.01
it
WCA
TA
it1it
CR
TA
it11
it
4.2 Empirical test
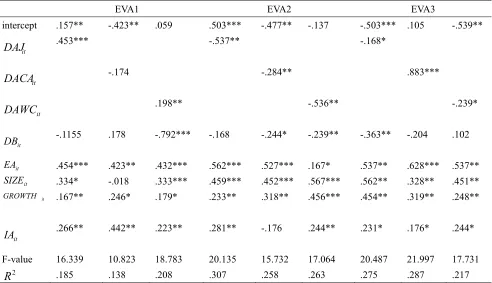
The empirical results in Table 5 show that DAs (Jones model) and working capital DAs have a significant positive relationship with the EVA1 (unadjusted EVA) of all firms in China. These findings support Hypothesis 1. Managers of listed firms in China have likely attempted to adopt earnings management through DA items (Jones model, discretionary working capital accruals). Because investors cannot identify earnings management, it generates a favorable image of businesses among investors, and investors may be willing to provide more funds to enterprises, leading to a decrease in the weighted average cost of capital (acquiring external funds was easier or cheaper) and an increase in the true value of firms (unadjusted EVA). Additionally, according to the regression coefficient, DAs (Jones model) yield a strong positive coefficient value (with EVA1, the coefficient is 0.453) in the DA model. In other words, DAs are more effective for analyzing the relationship between earnings management and EVA1 in China.
The empirical results in Table 5 show that all DAs have a significantly negative relationship with EVA2 (adjusted EVA, join adjusted items). These findings do not support Hypothesis 1. Managers of listed firms are highly unlikely to attempt to adopt earnings management through DA items because investors identify earnings management and focus on EVA2, which is detrimental to investors’ image of enterprises. Investors may thus be unwilling to provide additional funds to enterprises, leading to an increase in the weighted average cost of capital (acquiring external funds was costly) and a decrease in the true value of firms (adjusted EVA, join adjusted items). Additionally, according to the regression coefficient, DAs (Jones model) yield a strong negative coefficient value (with EVA2, the coefficient is -0.537) in the DA model. In other words, DAs (Jones model) are more effective for analyzing the relationship between earnings management and EVA2 in China.
The empirical results in Table 5 show that DAs (Jones model) and working capital DAs have a significantly negative relationship with EVA3 (adjusted EVA, join adjusted items and economic deprecation adjusted items). However, current DAs have a significantly positive relationship with EVA3. These findings partially support only Hypothesis 1. Managers of listed firms in China are highly likely to attempt to adopt earnings management through DA items (current DAs) because investors cannot identify earnings management. However, investors may focus on EVA3 (adjusted EVA, join adjusted items and economic deprecation adjusted items), which generates a favorable image of businesses among investors, who may be willing to provide additional funds to enterprises, leading to a decrease in the weighted average cost of capital (acquiring external funds was easier or cheaper) and an increase in the true value of firms (adjusted EVA, join adjusted items and economic deprecation adjusted items). In addition, managers of listed firms in China do not attempt to adopt earnings management through DA items (Jones model, working capital DAs) because investors identify earnings management. However, investors also focus on EVA3, which is detrimental to the image of enterprises among investors, who may thus be unwilling to provide additional funds to enterprises, leading to an increase in the weighted average cost of capital (acquiring external funds was costly) and a decrease in the true value of firms (adjusted EVA, join adjusted items and economic deprecation of adjusted items). In addition, according to the regression coefficient, DA items (discretionary working capital accruals) yield a stronger negative coefficient value (with EVA3, the coefficient is -0.239), whereas current DAs have a stronger positive coefficient value (with EVA3, the coefficient is 0.883) for DA items.
Regarding the control variables, capital structure (debt ratio) has a significantly negative relationship with EVA, and the equity of average assets, size (sales), growth (asset growth rate), and intangible assets have a significantly positive relationship with EVA. These results are consistent with those reported by Moradi, Ghomian, and Fard (2012), demonstrating that these variables have a significant effect on EVA in China. Regarding the results from variance inflation factors to explain variables for correlation, the result lies between 1.558 and 1.862 (Variance Inflation Factors <10). No correlation problem exists.
However, DAs (Jones model) had a stronger effect after 2008, and working capital DAs had a weaker effect after 2008. Overall, the relationship between earnings management and EVA differs before and after 2008.
Table 5. Regressions of earnings management with economic value added
EVA1 EVA2 EVA3
intercept .157** -.423** .059 .503*** -.477** -.137 -.503*** .105 -.539**
.453*** -.537** -.168*
-.174 -.284** .883***
.198** -.536** -.239*
it
DB -.1155 .178 -.792*** -.168 -.244* -.239** -.363** -.204 .102
it
EA .454*** .423** .432*** .562*** .527*** .167* .537** .628*** .537**
it
SIZE .334* -.018 .333*** .459*** .452*** .567*** .562** .328** .451**
it
GROWTH .167** .246* .179* .233** .318** .456*** .454** .319** .248**
it
IA .266** .442** .223** .281** -.176 .244** .231* .176* .244*
F-value 16.339 10.823 18.783 20.135 15.732 17.064 20.487 21.997 17.731
2
R
.185 .138 .208 .307 .258 .263 .275 .287 .217*:p<0.1; **: p<0.05; ***: P<0.01
Table 6. Frequency of the relationship between earnings management and economic value added: estimated cross sections for each year
EVA1 EVA2 EVA3
2003-2007 2009-2013 2003-2007 2009-2013 2003-2007 2009-2013
3(+) 2 (+) 2 (-) 4(-) 1(-) 5(-)
1(-) 1 (-) 3 (-) 4(-) 4(+) 2(+)
4(+) 3 (+) 2 (-) 4(-) 3(-) 4(-)
* Number represents “frequency”
** () represents a significant relationship (positive or negative) between earnings management and EVA
5. Conclusion
Assessing the real value of corporations is critical for stakeholders. One of the foremost objectives of enterprises is to increase short-term profits while increasing the long-term wealth of stakeholders. EVA, an index developed by Stewart (1991), is used to evaluate economic value, assess funds, and efficiently allocate resources and involves using adjustment items to reflect the true economic value of companies.
Earnings management is subjective because managers exercise judgment in financial reporting and tend to structure transactions to adjust financial reports to mislead stakeholders about the economic performance of a company or influence contractual outcomes that depend on reported accounting numbers. Because EVA is based on financial statements and is used to measure the value of competing companies, managers are likely motivated to engage in earnings management regarding EVA, such as adjusting operating income. Overall, EVA may not reflect true
it
DAJ
it
DACA
it
DAWC
it
DAJ
it
DACA
it
company performance. By investigating whether earnings management influences a firm’s EVA from the perspective of capital cost, this study provides third-party investors with a method of analyzing the true value of enterprises. We adopt a regression model to analyze data from 2003 to 2013 (excluding 2008) from the COMPUSTAT database in China and DA items to measure earnings management, unadjusted EVA, and adjusted EVA (join adjusted items, join adjusted items and economic deprecation adjusted items). The results show a significant positive relationship between earnings management through DAs (Jones model, discretionary working capital accruals) and unadjusted EVA, a significant inverse relationship between earnings management through DAs (Jones model, current DAs, discretionary working capital accruals) and adjusted EVA (join adjusted items), a significant positive relationship between earnings management through DAs (current DAs) and adjusted EVA (join adjusted items and economic deprecation adjusted items), and a significant inverse relationship between earnings management through DAs (Jones model and discretionary working capital accruals) and adjusted EVA (join adjusted items and economic deprecation adjusted items). In addition, we infer that those enterprises were affected by the financial tsunami. Our results are critical for managers, researchers, investors, and regulators. Managers should decrease unadjusted EVA without using earnings management through DAs (Jones model, discretionary working capital accruals); however, adjusted EVA (join adjusted items) can be reduced through earnings management. In addition, managers should increase adjusted EVA (join adjusted items and economic deprecation adjusted items) by using earnings management through DAs (current DAs); however, adjusted EVA (join adjusted items and economic deprecation adjusted items) can be increased without using earnings management through DAs (Jones model, discretionary working capital accruals).
These empirical findings show that DAs are substitutes because they occur in varying degrees in the same nation groups. Additionally, our results enable investors to analyze the true value of enterprises, regardless of whether enterprises have adopted earnings management. Regulators (e.g., governments) should establish stricter security measures and laws or rules for listed companies to prevent earnings management following a financial tsunami and encourage companies to report their “real” value. Future studies should consider refining the measurement of the earnings management model because not all of them are equal, and the consequences of engaging in earnings management are likely not equal in all capital markets. In addition, researchers may also consider focusing on identifying intermediate variables affecting these relationships or establishing an optimal theory for explaining the relationship between earnings management and EVA because this study only examines this relationship from the subjective perspective of capital cost.
References
Bahri, M. St-Pierre, J. & Sakka, O. (2011). Economic Value Added: A Useful Tool for SME Performance Management. International Journal of Productivity and Performance Management, 60(6): 603-621. http://dx.doi.org/10.1108/17410401111150779
Bailey, E. E. Helfat, C. E. (2003). External Management Succession, Human Capital and Firm Performance: An Integrative Analysis. Managerial and Decision Economics, 24,347-369. http://dx.doi.org/10.1002/mde.1119 Brown, L. Higgins, H. (2001). Managing Earnings Surprises in The US Versus 12 Other Countries. Journal of
Accounting and Public Policy, 20,373-398. http://dx.doi.org/10.1016/S0278-4254(01)00039-4
Boone, J.P. Khurana, I.K. & Raman, K.K. (2012). Audit Market Concentration and Auditor Tolerance for Earnings
Management. Contemporary Accounting Research, 29(4): 1171-1203.
http://dx.doi.org/10.1111/j.1911-3846.2011.01144.x
Chang, F.Y. Hsin, C.W. Hou S.S. (2013). A Re-Examination of Exposure to Exchange Rate Risk: The Impact of Earnings Management and Currency Derivative Usage. Journal of Banking and Finance, 37, 3243-3257. http://dx.doi.org/10.1016/j.jbankfin.2013.03.007
Chen, H. Chen, J.Z. Lobo, G.J.Wang, Y. (2011). Effects of Audit Quality on Earnings Management and Cost of Equity Capital: Evidence from China. Contemporary Accounting Research, 28(3), 892-925. http://dx.doi.org/10.1111/j.1911-3846.2011.01088.x
Chin, C.L. Chen, Y.J. & HsiehT.J. (2009). International Diversification, Ownership Structure, Legal Origin, and Earnings Management: Evidence from Taiwan. Journal of Accounting, Auditing and Finance, 24(2):233-362. Dechow, P. Sloan, R.Sweeney, A. (1995). Detecting earning management. The Accounting Review, 70,193-225. Farrell, K. Unlu, E.Yu, J. (2014). Stock Repurchases as An Earnings Management Mechanism: The Impact of
Gong, G. Louis, H. & Sun, A. (2008). Earnings Management and Firm Performance Following Open-Market Repurchases. Journal of Finance, 63(2):947-986. http://dx.doi.org/10.1111/j.1540-6261.2008.01336.x
Gunny, K. A. (2010). The Relation between Earnings Management Using Real Activities Manipulation and Future Performance: Evidence from Meeting Earnings Benchmarks. Contemporary Accounting Research, 27 (3):855-888. http://dx.doi.org/10.1111/j.1911-3846.2010.01029.x
Haque, R. Siddikee.J.A.Hossain, S. Chowdhury, S.P. Rahman, M. (2013). Relationship between Dividend Payout and Economic Value Added: A Case of Square Pharmaceuticals Limited, Bangladesh. International Journal of Innovation and Applied Studies, 3(1), 98-104.
Healy, P.M. Wahlen, J.M. (1999). A Review of the Earnings Management Literature and Its Implications for Standard Setting. Accounting Horizons,13(4), 365-383. http://dx.doi.org/10.2308/acch.1999.13.4.365
Huang, D.T. Liu, Z.C. (2010). Board Composition and Corporate Value in Taiwan High Technology Firms. The International Journal of Organizational Innovation, 2(4), 126-138.
Jackson, S.B. Liu, X.T. (2010).The Allowance for Uncollectible Accounts, Conservatism, and Earnings Management. Journal of Accounting Research, 48(3):565-601. http://dx.doi.org/10.1111/j.1475-679X.2009.00364.x
Jha, A. (2013). Earnings Management Around Debt-Covenant Violations-An Empirical Investigation Using a Large Sample of Quarterly Data. Journal of Accounting, Auditing and Finance, 28(4), 369-396. http://dx.doi.org/10.1177/0148558X13505597
Jones, J.J. (1991). Earnings Management during Import Relief Investigations. Journal of Accounting Research, 29,193-228. http://dx.doi.org/10.2307/2491047
Kaur, M., & Narang, S. (2008). Economic Value Added Reporting and Corporate Performance: A Study of Satyam Computer Services ltd. the ICFAI Journal of Accounting Research, 7(2), 40-52.
Kaur, A. Pal, K. (2008). Awareness of Economic Value Added Among Indian Corporate Managers: Evidences from a primary survey. Journal of Applied Finance, 14(8), 53-65.
Kim, J.B. Sohn, B.C. (2013). Real Earnings Management and Cost of Capital. Journal of Accounting and Public Policy, 32,518-543. http://dx.doi.org/10.1016/j.jaccpubpol.2013.08.002
Lin, F.Y. Wu, S.F. (2014). Comparison of Cosmetic Earnings Management for The Developed Markets and Emerging Markets: Some Empirical Evidence from The United States and Taiwan. Economic Modelling, 36,466-473. http://dx.doi.org/10.1016/j.econmod.2013.10.002
Louis, H. (2004). Earnings Management and The Market Performance of Acquiring Firms. Journal of Financial Economics,74,121-148. http://dx.doi.org/10.1016/j.jfineco.2003.08.004
Martani, D. Saputra, Y.E. (2009). The impact of Corporate Governance to the Economic Value Added Listed Company in BEI 2003-2004. China-USA Business Review, 8(3):26-40.
Matsumoto, D.A. (2002). Management’s Incentives to Avoid Negative Earnings Surprises. Accounting Review, 77,483-514. http://dx.doi.org/10.2308/accr.2002.77.3.483
Moradi, M. Ghomian, M.M. Fard, M.G. (2012). The Relationship between Particular Features of a Firm and The Economic Value Added. World Applied Sciences Journal, 19(11), 1640-1648.
Nagata, K. (2013). Does Earnings Management Lead to Favorable IPO Price Formation or Further Underpricing? Evidence from Japan. Journal of Multinational Financial Management, 23,301-313. http://dx.doi.org/10.1016/j.mulfin.2013.05.002
Neumann, R. Voetmann, T. (2005). Top Executive Turnovers: Separating Decision and Control Rights. Managerial and Decision Economics, 26(1), 25-37. http://dx.doi.org/10.1002/mde.1187
Peng, M.W. (2004). Outside Directors and Firm Performance during Institutional Transitions. Strategic Management Journal, 25,453-471. http://dx.doi.org/10.1002/smj.390
Salteh, H.M. Valipour, H. (2012). Investigating the Relationship between Earnings Management and Weighted Average Cost of Capital (WACC). Business and Management Review, 1(12), 28-38.
International Comparative Management, 13(2), 305-312.
Stewart, G. B. (1991). The Quest for Value, New York: Harperbusiness.
Strobl, G. (2013). Earnings Manipulation and the Cost of Capital. Journal of Accounting Research, 51(2):449-473. http://dx.doi.org/10.1111/1475-679X.12008
Tseng, C.Y. (2008). Internal R&D Effort, External Imported Technology and Economic Value Added: Empirical
Study of Taiwan’s Electronic Industry. Applied Economics, 40:1073-1082.
http://dx.doi.org/10.1080/00036840600771163
Zhang, X. He, Y. (2013). R&D-Based Earnings Management, Accounting Performance and Market Return Evidence from National-Recognized Enterprise Technology Centers in China. Chinese Management Studies, 7(4), 572-585. http://dx.doi.org/10.1108/CMS-09-2013-0176
Notes
Note 1. China
Note 2. Jones(1991) model
Note 3. Louis (2004): discretionary current accruals Note 4. Matsumoto(2002): working capital accruals Note 5. Huang and Liu(2010)
Note 6. Economic deprecation adjusted items is measured by funds method as it is better.
Note 7. Chen, Chen, Lobo and Wang(2011) indicated that is categorized into two groups: a positive denotes
income-increasing, performance-adjusted discretionary items, and a negative denotes income-decreasing, performance-adjusted discretionary items.
Note 8. In order to shorten the tables, we omit the solution
it
itit