RESEARCH
Comparison of iTRAQ and SWATH
in a clinical study with multiple time points
Antti Jylhä
1,2*, Janika Nättinen
1,2, Ulla Aapola
1,2, Alexandra Mikhailova
1,2, Matti Nykter
2, Lei Zhou
3,4,5,6,
Roger Beuerman
1,3,4and Hannu Uusitalo
1,2,7Abstract
Background: Advances in mass spectrometry have accelerated biomarker discovery in many areas of medicine. The purpose of this study was to compare two mass spectrometry (MS) methods, isobaric tags for relative and absolute quantitation (iTRAQ) and sequential window acquisition of all theoretical fragment ion spectra (SWATH), for analytical efficiency in biomarker discovery when there are multiple methodological constraints such as limited sample size and several time points for each patient to be analyzed.
Methods: A total of 140 tear samples were collected from 28 glaucoma patients at 5 time points in a glaucoma drug switch study. Samples were analyzed with iTRAQ and SWATH methods using NanoLC-MSTOF mass spectrometry. Results: We discovered that even though iTRAQ is faster than SWATH with respect to analysis time per sample, it loses in sensitivity, reliability and robustness. While SWATH analysis yielded complete data of 456 proteins in all sam-ples, with iTRAQ we were able to quantify 477 proteins in total but on average only 125 proteins were quantified in a sample. 283 proteins were common in the datasets produced by the two methods. Repeatability of the methods was assessed by calculating percent relative standard deviation (% RSD) between replicate MS analyses: SWATH was more repeatable (56% of proteins < 20% RSD), compared to iTRAQ (43% of proteins < 20% RSD). Despite the overall benefits of SWATH, both methods showed less than 1 log fold change difference in the expression of 74% common proteins. In addition, comparison to MS/MS peptide results using 8 isotopically labeled peptide standards, SWATH and iTRAQ showed similar results in terms of accuracy. Moreover, both methods detected similar trends in a longitudinal analysis of protein expression of two known tear biomarkers.
Conclusions: Overall, we conclude that SWATH should be preferred for biomarker discovery studies when analyzing limited volumes of clinical samples collected at multiple time points.
Trial Registeration: The study was approved by the Ethics Committee at Tampere University Hospital and was regis-tered in EU clinical trials register (EudraCT Number: 2010-021039-14).
© The Author(s) 2018. This article is distributed under the terms of the Creative Commons Attribution 4.0 International License (http://creat iveco mmons .org/licen ses/by/4.0/), which permits unrestricted use, distribution, and reproduction in any medium, provided you give appropriate credit to the original author(s) and the source, provide a link to the Creative Commons license, and indicate if changes were made. The Creative Commons Public Domain Dedication waiver (http://creat iveco mmons .org/ publi cdoma in/zero/1.0/) applies to the data made available in this article, unless otherwise stated.
Background
Biomarkers can reveal a patient’s risk to certain disease or complication and its severity, and predict the thera-peutic response [1]. In recent years mass spectrometry (MS) has become an attractive choice for biomarker discovery, because it can be used to detect and quantify
most proteins in a given sample [2, 3] and it can thus detect changes in cellular functions and metabolism in a more comprehensive way than the traditional immunoas-says [4]. In ophthalmology, tissue samples are always very limited in amount due to the size of the eye and potential damage to healthy structures. However, the tear fluid is a thin layer of extra-cellular fluid over the surface of the eye [5] that can be collected non-invasively. MS analysis of tear samples has proven its potential in discovering pro-teomic biomarkers and even small quantities of tear flu-ids are sufficient if collected and analyzed carefully [6–9]. Tear fluid proteomics is relevant for understanding the
Open Access
*Correspondence: [email protected]
1 Department of Ophthalmology, SILK, The Centre for Proteomics and Personalized Medicine (PPM), Faculty of Medicine and Life Sciences, University of Tampere, Arvo Ylpön katu 34, ARVO, PL 100, 33014 Tampere, Finland
outcomes of topically applied drugs, adverse reactions, anterior segment surgery, inflammatory diseases such as dry eye as well as other eye and systemic diseases [8–10].
iTRAQ or isobaric tags for relative and absolute quan-titation [11, 12] has often been the method of choice for relative quantitation, but more recently a new technique, sequential windowed acquisition of all theoretical frag-ment ion mass spectra (SWATH) [13], has begun to chal-lenge that position as an alternative method. SWATH and iTRAQ provide relative quantitation using very different approaches. Unlike SWATH, iTRAQ sample preparation requires preparatory steps to covalently bind isobaric labels to peptides which usually represent 4 or 8 different experimental groups depending on the study [11–13].
Data dependent acquisition (DDA) method is often used in iTRAQ experiment, which has been widely used for relative quantitation of proteins in clinical and in vitro studies [14–17]. Usually, the iTRAQ studies have been fairly small (< 40 samples), with total protein amount > 30 µg/sample [16–19] and in general, 25 µg of total protein has been regarded as a limit for successful iTRAQ labeling. iTRAQ has not been applied for large clinical trials because of the high costs of the reagents, complexity of the study setups and propensity of iTRAQ to yield incomplete data based on stochastic selection of peptides.
SWATH is a data independent acquisition (DIA) method where the instrument deterministically frag-ments all precursor ions within the predefined mass-to-charge (m/z) range and acquires convoluted product ion spectra containing all the fragment ions of all the
concurrently fragmented precursors [13]. This results
in a data set that is continuous in both fragment ion intensity and retention time dimensions and essentially represents a digital recording of all analyzed proteins in
the sample [3]. In SWATH, datasets are recorded
inde-pendently and can be re-examined if the library used in downstream analyses is updated. In addition, SWATH is label free and therefore not limited to a specific
num-ber of experimental groups [13]. SWATH was first
pre-sented by Gillet et al. [13], since then multiple different articles on the subject have been published [9, 21, 22]. DIA methods are also suitable for analysis of extremely small sample amounts [9, 23], which is crucial for small and non-reproducible clinical samples, common in many clinical specialties such as ophthalmology. SWATH allows more flexible comparisons and potential savings, especially when sample amount is limited [13].
iTRAQ and SWATH both produce relative quantita-tion results which need further validaquantita-tion using other methods in order to increase the reliability of discovery proteomics. Suitable methods for this purpose include different immunochemical methods and targeted MS/
MS analysis. However, ELISA assays and Western blot-ting are both often limited by selectivity and multiplex-ing possibilities with small samples [24, 25]. Targeted MS/MS analysis is currently the only mass spectrometry method which can produce absolute quantification of tar-geted proteins using isotopically labeled peptide stand-ards (AQUA) or protein standard absolute quantification (PSAQ) [26, 27]. Use of isotope standards minimizes the sample preparation and mass spectrometry equipment variation thus increase the reliability and accuracy of results [28].
We compared iTRAQ and SWATH in terms of sensi-tivity, reliability and robustness in tear fluid samples col-lected from 28 patients over five time points in a clinical drug switch study. In addition, we evaluated similarity of relative quantification results to 2 stable isotope labeled protein peptides (AQUA) quantification results obtained by MicroLC-MS/MS.
Methods
Chemicals and materials
Acetonitrile (ACN), formic acid (FA), water (UHPLC-MS grade), triethylammonium bicarbonate buffer 1 M (TEAB), sodium dodecyl sulfate (SDS), methyl meth-anethiosulfate (MMTS), trifluoroacetic acid (TFA), ammonium bicarbonate (ABC) and urea were all pur-chased from Sigma Aldrich (St. Louis, MO, USA). Pro-tease inhibitor cocktail (HALT) and sample cleaning tips (C18) were from Thermo Fisher Scientific (San Jose, CA, USA). BioRad DC protein quantification kit and serum albumin standard were purchased from Bio-Rad (Her-cules, CA, USA) and 30 kDa filters from PALL (Port Washington, NY, USA). 8-plex iTRAQ reagent kit and TPCK treated trypsin was acquired from Sciex (SCIEX, Framingham, MA, USA).
Sample collection and preparation
The study was approved by the Ethics Committee at Tam-pere University Hospital and was registered in EU clinical trials register (EudraCT Number: 2010-021039-14).
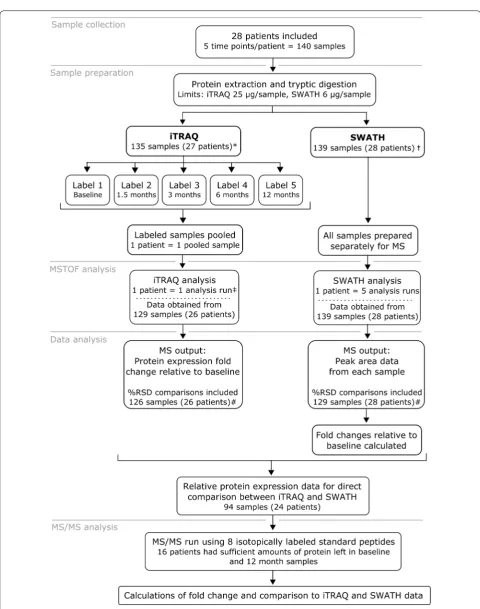
The study outline, sample preparation and analysis are
schematically presented in Fig. 1. The study was
Protein extraction and enzymatic digestion
For extraction of tear proteins, Schirmer’s strips were first cut into small pieces and solubilized to 50 mM ABC
solution containing HALT™ protease inhibitor,
incu-bated on ice for 60 min and centrifuged. Total protein concentration of the supernatant was measured with Bio-Rad DC protein quantification kit, using serum albumin as a standard. For iTRAQ 25 or 50 µg and for SWATH 6–50 µg of total protein was precipitated with cold acetone (− 20 °C) overnight. The protein amounts were selected based on the manufacturer’s recommen-dation in iTRAQ and our previous testing of suitable injection volume of 1.5 µg total protein in 2 µl volume in SWATH. Precipitated proteins were centrifuged, liq-uid layer was decanted from the tubes and samples were allowed to dry for 10 min. Proteins were solubilized in 0.5 M TEAB, denatured with 0.1% SDS and reduced by Tris-(2-carboxyethyl) phosphine and set to thermo mixer for 60 min of incubation at + 60 °C. After reduction
sam-ples were transferred into Pall Nanosep® 30 kDa MWCO
centrifugal devices with low protein binding membrane and flushed three times with 200 µl of 75% urea solu-tion for addisolu-tional denaturasolu-tion. Cysteine residues were blocked by MMTS at room temperature in dark. Sam-ples were flushed with additional urea solution twice, and urea was removed with 50 mM ABC. Samples were then subjected to enzymatic digestion (trypsin:protein ratio 1:25 µg) for 16 h at + 37 °C. The following day samples were flushed with 50 Mm ABC to remove peptides from the filter and dried in speed vacuum. SWATH samples were solubilized to 0.1% TFA and desalted with C18 fil-ter tips. Desalting was done by first cleaning the filfil-ter by aspirating 50% ACN and 0.1% TFA through the tip, then sample was aspirated 7 times, followed by cleaning aspi-ration with 5% ACN. Final elution was done by 80% ACN and 0.1% FA. Samples were dried in speed vacuum and stored at − 20 °C until used for iTRAQ labeling or recon-stituted to loading solution (5% ACN, 0.1% FA) before NanoRPLC-MSTOF SWATH analysis. SWATH analy-sis samples were diluted to equal concentrations before injection to the instrument.
iTRAQ labeling
Each iTRAQ reagent (113, 114, 115, 116, 117, 118, 119, 122 isobaric tags) was reconstituted in ethanol, and pep-tide samples were reconstituted in iTRAQ dissolution buffer. Samples were labelled with the iTRAQ reagents one patient at a time (5 samples = 5 labels per patient). The labelled samples were incubated for 2 h at room tem-perature with interval mixing (alternating 1 min static and 15 min at 1200 rpm), centrifuged at 13,500 rpm for
5 min, and pooled (Fig. 1). The pooled samples were
dried by vacuum centrifugation. Sample clean-up and desalting was carried out using Macro Spin Column Fil-ters (Nest Group Inc, Southborough, MA) and washing samples several times with ACN and TEAB buffers. The samples were dried in vacuum centrifugation and stored at − 20 °C until analyzed.
NanoRPLC‑MSTOF
NanoLC-MSTOF parameters used in iTRAQ analysis
have been published before in [17] and SWATH method
has been published before [9]. Digested peptides were
analyzed by Nano-RPLC-MSTOF instrumentation using Eksigent 425 NanoLC coupled to high speed Tri-pleTOF™ 5600 + mass spectrometer (Ab Sciex, Concord,
Canada). A capillary RP-LC column (cHiPLC® ChromXP
C18-CL, 3 µm particle size, 120 Å, 75 µm i.d × 15 cm, Eksigent Concord, Canada) was used for LC separation of peptides. Samples were first loaded into trap column
(cHiPLC® ChromXP C18-CL, 3 µm particle size, 120 Å,
75 µm i.d × 5 mm) from autosampler and flushed for
10 min at 2 µl/min (2% ACN, 0.1% FA). The flush sys-tem was then switched to line with analytical column. Tear samples were analyzed with 120 min 6 step gradient using eluent A: 0.1% FA in 1% ACN and eluent B: 0.1% FA in ACN (eluent B from 5 to 7% over 2 min, 7 to 24% over 55 min, 24 to 40% over 29 min, 40 to 60% over 6 min, 60 to 90% over 2 min and kept at 90% for 15 min, 90 to 5% over 0.1 min and kept at 5% for 13 min) at 300 nl/min.
MicroLC‑MS/MS analysis with AQUA peptides
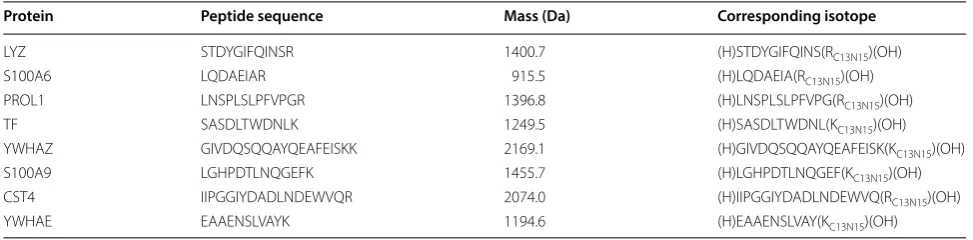
Sixteen patients were selected for MS/MS analysis. Selec-tion of patients was based on what samples had suf-ficient amount tear fluid left for MS/MS analysis after iTRAQ and SWATH analyses. We selected 8 proteins and one peptide from each for MicroLC-MS/MS analy-sis (Table 1). Sample preparation was similar to SWATH samples and AQUA peptides were added in the final elution step before injecting to MS/MS analysis. Con-centration of AQUA peptide was matched to the mean concentrations of each peptide in the tear samples. Cor-responding isotopically labeled peptides were purchased from Sigma-Aldrich (purity > 95%).
Tear samples were analyzed with Sciex 6500 + MSTrap which was coupled to NanoLC 425 with 1–10 µl/min
microLC flow cell. Acclaim™ PepMap™ C18, analytical
C18, 300 Å, 5 µm, 0.3 × 150 mm HPLC column was
pur-chased from Thermo Fisher scientific. MicroLC utilized a 42 min 6 step gradient using eluent A: 0.1% FA in MQ and eluent B: 0.1% FA in ACN (eluent B from 10 to 30% over 22 min, 30 to 50% over 8 min, 50 to 80% over 2 min, kept at 80% for 5 min, 80 to 10% over 0.2 min and kept at 10% for 5 min, at 5 µl/min. MSTrap settings were as fol-lows; Curtain gas: 30, Spray voltage: 5300, Collision gas: medium, Temperature: 150 °C, Ion source gas 1: 20, Ion sourece gas 2: 20, were set the same for all peptides. Col-lision energy was set to 30 for all fragments and corre-sponding isotopes.
Data analysis
ProteinPilot software version 4.0.8085 (AB Sciex, Can-ada) was used for database searching (IPI v. 3.87) for building library for SWATH analysis and iTRAQ analy-sis. Some important settings in the Paragon search algo-rithm in ProteinPilot were configured as follows. Sample type: identification, Cys-alkylation: MMTS, Digestion:
Trypsin, Instrument: TripleTOF 5600 +, Search effort:
thorough ID. False discovery rate (FDR) analysis was performed in the ProteinPilot and FDR < 1% was set for
protein identification. Peptide identification limit was set to 99%. The data from all the identification runs were combined as a batch and used for library creation.
PeakView® software 2.0 with SWATH was used to
assign the correct peaks to correct peptides in the library. iRT peptides (Biognosys, Switzerland) was used for retention time calibration with PeakView. 1–15 peptides per protein were selected to be used in SWATH quanti-fication. All shared peptides were excluded from analy-sis. SWATH plug-in FDR analysis was used to select the proper peptides for use in quantification. For all compari-son data between iTRAQ and SWATH all proteins with relative quantitation data based on single peptide were removed from results.
All statistical analyses were performed with Excel or R statistical software version 3.2.3 (R Core Team. Foun-dation for Statistical Computing, Vienna, Austria. URL:
https ://www.R-proje ct.org/). Relative standard deviations (% RSD) were calculated from two replicate MS analyses in order to assess repeatability of iTRAQ and SWATH. Duplicate proteins with identical gene names were merged, keeping only the protein name with the high-est ranking (number of proteins after duplicate check, iTRAQ n = 667, SWATH n = 680, Additional file 1).
For MS/MS quantification method we used 3 point smoothing in peak integration and all 3 peptide fragment chromatograms were combined for each protein. Quanti-fied peptides areas were normalized against their corre-sponding isotopically labeled standard peptide peak areas to remove instrument variability. Analysis method was validated in terms of sample preparation, linearity and repeatability.
Results
All of the iTRAQ and SWATH analyses were performed
using identical TripleTOF 5600 + MS and NanoLC
set-tings. A total of 14 days of instrument time was required for iTRAQ analyses and 35 days for SWATH analyses. Altogether 140 tear samples were processed, however,
Table 1 Proteins and their specific peptides and fragments used in MS/MS quantification analysis
Protein Peptide sequence Mass (Da) Corresponding isotope
LYZ STDYGIFQINSR 1400.7 (H)STDYGIFQINS(RC13N15)(OH)
S100A6 LQDAEIAR 915.5 (H)LQDAEIA(RC13N15)(OH)
PROL1 LNSPLSLPFVPGR 1396.8 (H)LNSPLSLPFVPG(RC13N15)(OH)
TF SASDLTWDNLK 1249.5 (H)SASDLTWDNL(KC13N15)(OH)
YWHAZ GIVDQSQQAYQEAFEISKK 2169.1 (H)GIVDQSQQAYQEAFEISK(KC13N15)(OH)
S100A9 LGHPDTLNQGEFK 1455.7 (H)LGHPDTLNQGEF(KC13N15)(OH)
CST4 IIPGGIYDADLNDEWVQR 2074.0 (H)IIPGGIYDADLNDEWVQ(RC13N15)(OH)
iTRAQ analyses were performed with 135 samples, as protein concentration of the remaining 5 samples was below the manufacturer’s suggested limit of 25 µg/sam-ple. The corresponding limit for SWATH analysis was 6 µg of protein and only one sample fell below this limit. We obtained corresponding data for 94 tear samples
iTRAQ and SWATH analyses (Fig. 1).
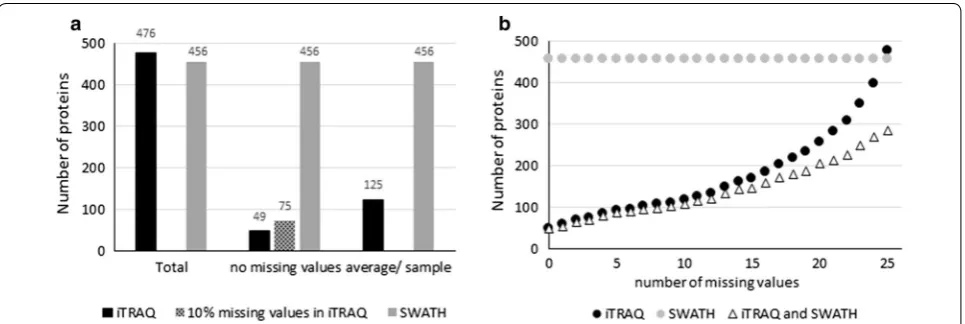
We identified a total of 667 different proteins using iTRAQ in total of 13,220 peptides from 135 samples, cor-responding to 310,452 identified spectra, and 477 pro-teins had more than two peptides and were quantified. With SWATH we identified a total of 11,791 peptides from 60 samples, corresponding to 285,263 identified spectra in an assembly of 680 proteins using False dis-covery rate of 1.0%. From this library, 456 proteins had more than two distinct peptides in all analyzed tear sam-ples. The average amount of proteins identified in all time points of one patient by iTRAQ was 125, (range 59–258) and 49 proteins were quantified in all samples. Moreover, 283 proteins were quantified with both analysis methods. iTRAQ is known to generate data with missing values, and we observed how, by allowing missing values, the number of quantified proteins increased (Fig. 2b). The SWATH protein library was more representative of the study as a whole. iTRAQ and SWATH libraries with pep-tide information are presented in Additional file 1.
Data quality assessment
Each tear sample was run twice. In these replicate MS analyses, iTRAQ quantified an average of 125 and SWATH 456 proteins. In order to assess repeatability, we calculated and compared % RSD. At different % RSD cut-off levels SWATH consistently showed higher number of proteins in relation to total number of quantified proteins (Fig. 3a, b).
To evaluate the effect of sample preparation and instru-ment stability, we visualized protein expression variation of individual samples by boxplots (Fig. 3c, d). Variability between sample distributions was minor and medians were consistently close to zero, however, distribution var-iation in iTRAQ was larger than in SWATH.
To correlate the fold change values between the two methods we compared the protein expression values obtained by iTRAQ to those of SWATH. There were alto-gether 103 samples and 14 527relative changes in pro-tein levels where this comparison was possible (Fig. 4). The relative changes were similar between two methods: 70.6% of all proteins (and 76.1% of the 49 proteins seen in all samples) had less than onefold difference between
corresponding iTRAQ and SWATH results (Fig. 4a, b).
One iTRAQ sample was clearly deviating from the rest (Fig. 4a, b) and its removal from the data increased the
correlation of iTRAQ and SWATH (Fig. 4c). This
devia-tion was also seen in the median and range in compari-son to the other samples in iTRAQ box plot (Fig. 3c).
MS/MS validation using isotopically labeled peptides
Finally, we validated the SWATH and iTRAQ results using MicroLC-MS/MS analysis with AQUA pep-tides. We selected 8 proteins with 1 peptide per pro-tein and two different time-points (first and last) from 16 patients for the targeted quantification with isotopically labeled peptides. MS/MS method sample preparation together with instrument variation % RSD was < 15% for all peptides and instrument repeatabil-ity alone < 5%. Linear range was confirmed in the range of 50 fold change and all peptides showed linearity of r2 > 0.99. We calculated the protein expression fold
change between first and last sample collection time points and compared it to SWATH-MS and iTRAQ
results respectively. MS/MS fold change comparison was possible with 114 values in SWATH analysis and 110 values with iTRAQ. This comparison showed sim-ilar results between the two methods with good corre-lation to MS/MS. Median difference to MS/MS values
were 0.33 [0.60 ± 0.79 (Mean ± SD)] using iTRAQ
and 0.45 [0.62 ± 0.74 (Mean ± SD)] with SWATH-MS.
Illustration of all 8 proteins results are represented in Additional file 2.
Clinical correlation of LYZ and S100A6 expression changes in two methods
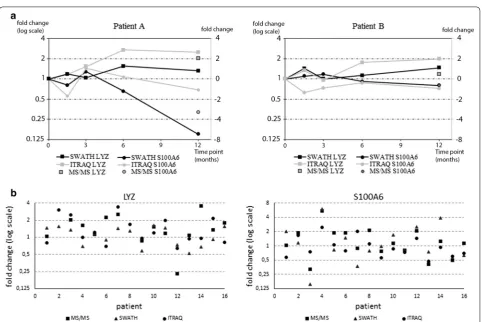
In order to verify biological validity of the results we selected two known tear fluid biomarkers for longitudinal
analysis. Lysozyme (LYZ) and S100A6 protein expres-sions have been linked to dry eye disease and glaucoma drug adverse effects; LYZ expression decreases while S100A6 increases in response to these conditions [6, 7,
20]. Both proteins were quantified in all samples using both analysis methods. In addition, our results demon-strate good correlation between SWATH and iTRAQ (Fig. 5a). Based on protein expression levels of LYZ and S100A6 we were able to demonstrate that both patients are showing improvement on the ocular surface and that patient A reacts faster to the drug switch than patient B. Figure 5b result highlights the patient specific response, as we can see that in most cases LYZ is increased while S100A6 expression has gone down. Furthermore, patients
Fig. 3 Data quality assessment. a Total number of relatively quantified proteins and b proportion of total analyzed proteins in technical replicates with RSD < 10, < 20 and < 40% (Mean ± SD, n(iTRAQ) = 125, n(SWATH) = 456). Distribution of proteomic results of individual samples analyzed with c
Fig. 4 Variation of the results in iTRAQ and SWATH. Y-and x-axes represent the expression value (log2-scaling) in each sample. a All results quantified
in 94 samples by both methods, n = 14,473 relative fold change values (Spearman’s rank correlation coefficient r2= 0.345). b 49 proteins quantified
in all iTRAQ samples correlated against SWATH results, n = 4606 (r2= 0.414). c 49 proteins with one outlier sample removed (r2= 0.420). a and b
highlighted parts represent the < 1 fold change difference between results
appear to have very specific responses and the level of response varies between patients.
Discussion
This study compared two commonly used methods for relative quantitative proteomics (iTRAQ and SWATH) to demonstrate the particular value of SWATH analysis when confronted with the issues often found in clinical studies. In addition, we compared the results to isotopi-cally labeled peptide standards (AQUA) using MicroLC-MS/MS which showed that accuracy of SWATH and iTRAQ are at similar level and correlated well with abso-lute concentration measured with isotopically labeled peptide standards. For studies conducted in controlled conditions with few time points, iTRAQ is useful in detecting relative changes in small samples such as tear fluid [6, 7, 28]. However, increasing numbers of patients and follow-up time points in clinical studies mean that label-free technologies such as SWATH provide a more consistent number of quantified results across all samples and thus is more suitable for the discovery of putative biomarkers.
Currently, the highest number of proteins identified from tear fluid samples is 1543. This result was obtained by using pooled samples and LC fractionation [6]. How-ever, in clinical studies such as ours, study design requires individual sample preparation and analysis. Despite these restrictions, by combining iTRAQ and SWATH data we were able to identify 1055 and quantify 959 proteins (620 with two peptides). Using iTRAQ only, we quantified a total of 667 (477 using two peptides) proteins without pooled samples and LC fractionation, which is almost double of what has been previously reported for tear fluid [20]. In addition, the average (125) and maximum (258) number of proteins quantified per patient was somewhat higher than reported previously [20, 29]. Proteome anal-ysis using SWATH has been able to relatively quantify 785 proteins from a 1 µl tear sample [9]. This technique allowed us to quantify 456 (680 including one peptide results) proteins in all of the tear fluid samples studied. Of these 477 (iTRAQ) and 456 proteins (SWATH), 283 were shared, leaving 173 proteins quantified only by iTRAQ and 173 only by SWATH. Similar difference between iTRAQ and SWATH data has been demonstrated previ-ously in other types of samples [30, 31].
In our study the maximal number of proteins quantified with iTRAQ in all samples of one patient was 258. How-ever, only 49 identical proteins were quantified in all sam-ples of the 26 patients. This feature of iTRAQ has been characterized previously also by [20, 29]. The incomplete data in this type of study is generated based on stochastic selection of peptides [11, 31]. Various normalization and
missing value imputation methods can correct variation and incomplete data to a certain extent [32, 33]. However, imputation methods in general have not gained much popularity because their validation is challenging [34]. Therefore, we chose not to use imputation algorithms to complete the data in this study.
When correlating the data obtained by using iTRAQ and SWATH we found that they were in a fairly good agreement. 70.6% of the 283 proteins quantified by both methods showed less than onefold change difference to each other and had a correlation coefficient of r2= 0.414.
Several comparisons of iTRAQ and SWATH have been reported [30, 31, 35], but their results cannot be directly compared with ours due to the differences in study design and instrumentation. Our correlation coefficient was between previous study results [31, 35], showing cor-relation of r2= 0.726 and r2= 0.312. Data variation seen
in boxplots is probably due to sample processing and instrument variation in the SWATH analysis and labeling and instrument variation in iTRAQ analyses.
The differences in fold change values between iTRAQ and SWATH suggest that there is variation in the accu-racy of the results. Overall, SWATH analysis yielded a wider range of fold change values than iTRAQ. Fold change underestimation in iTRAQ has been demon-strated previously [31, 36, 37] and is due to the mixed MS/MS in complex samples where two precursor ions are selected to the same window for MS/MS. As a result, the average of two reporter ion intensities, instead of one, determines a single peptide fold change.
MRM (multiple reaction monitoring) using AQUA peptides is considered to be the gold standard and only method for absolute quantification of proteins using
mass spectrometry [28]. Results showed that iTRAQ
and SWATH median and mean values were close to each other but standard deviation was higher in iTRAQ. When focusing on single protein results, some differ-ences between the methods were observed but it was not possible to identify a common nominator for the differ-ences. Based on AQUA peptide results we can conclude that using these peptides, both methods are equally accu-rate and are able to produce reliable relative quantifica-tion data, although SWATH can gain higher number of quantified results per sample with same reliability. Fur-ther validation of the results using western blotting or ELISA assays were not possible due to the low sample amounts.
in LYZ expression together with a decrease in S100A6 expression as expected if drug switch is beneficial for the patient. SWATH and iTRAQ both revealed similar changes and the results correlated well to MS/MS data. However, as also noted previously, iTRAQ often underes-timated fold changes [31, 36].
Conclusions
Label-free techniques are becoming accepted as suit-able tools for clinical proteomic analyses, and it has been suggested that future workflow should use DDA
methods only in the preliminary hypothesis stage [38,
39]. Our data supports this view by demonstrating
ben-efits of SWATH in a study having typical clinical study design. Although SWATH has several advantages over iTRAQ, there are still some remaining issues. SWATH analysis is time consuming and will take at least twice as much instrument time as iTRAQ analysis. SWATH requires a spectrum library to be created before analyz-ing any specific type of samples, which consumes instru-ment time and may require additional samples. Despite the additional work at the initial stages, once the library is created, it can be used afterwards for similar sam-ples. Overall the complexity of data is far greater using SWATH since it is not limited to specific study design, which allows basically unlimited number of hypotheses to be tested against the data. This highlights the impor-tance of bioinformatics as comparisons between time points, patients and patient data leads to enormous data amounts and can easily lead to false positives. On the other side wider range of comparisons means that one clinical study can provide much more information. In addition to higher data completeness and smaller % RSD variation, SWATH is showing reliable expression level changes between time points. Overall, for larger and complex clinical studies our research results support the use of label free methods.
Additional files
Additional File 1. List of all analyzed proteins and the number of pep-tides used for relative quantitation of each protein.
Additional File 2. Fold changes values for 8 proteins which were meas-ured with all three different analysis methods.
Abbreviations
SWATH-MS: sequential window acquisition of all theoretical fragment ion spectra mass spectrometry; iTRAQ: isobaric tags for relative and absolute quantitation; DDA: data dependent analysis; DIA: data independent analysis; LC-MS/MS: liquid chromatography tandem mass spectrometry.
Authors’ contributions
HU designed the clinical experiments and collected the tear samples. AJ developed the analysis methods and performed the proteomic experiments and analysed the data. AJ, JN, UA and MN contributed to the data analysis. UA,
ZL and RB contributed to the study design. All authors contributed to the writ-ing of the manuscript. All authors read and approved the final manuscript.
Author details
1 Department of Ophthalmology, SILK, The Centre for Proteomics and Per-sonalized Medicine (PPM), Faculty of Medicine and Life Sciences, University of Tampere, Arvo Ylpön katu 34, ARVO, PL 100, 33014 Tampere, Finland. 2 BioMediTech, Faculty of Medicine and Life Sciences, University of Tampere, Tampere, Finland. 3 Singapore Eye Research Institute, Singapore, Singapore. 4 Duke-NUS SRP NBD, Singapore, Singapore. 5 Department of Ophthalmology, Yong Loo Lin School of Medicine, National University of Singapore, Singapore, Singapore. 6 Ophthalmology and Visual Sciences Academic Clinical Research Program, Duke-NUS Medical School, Singapore, Singapore. 7 Tays Eye Center, Tampere University Hospital, Tampere, Finland.
Acknowledgements
Saara Lähdekorpi is thanked for the technical assistance. Petri Kouvonen is thanked for advices for the manuscript.
Competing interest
The authors declare that they have no competing interest.
Availability of data and materials
Due to amount of data (270 iTRAQ, 298 SWATH mass spectrometry runs and MS/MS data) the datasets analysed in this study are not publicly available. Instead, data is available through the corresponding author on reasonable request.
Consent for publication
No material from any other publication was used in this publication.
Ethics approval
The study was approved by the Ethics Committee at Tampere University Hospital and was registered in EU clinical trials register (EudraCT Number: 2010-021039-14). Registered 19 August 2010, https ://www.clini caltr ialsr egist er.eu/ctr-searc h/searc h?query =2010-02103 9-14.
Funding
Authors received funding from Finish Funding Agency for Innovation 66/31/2012 and Elsemay Björn Fund.
Publisher’s Note
Springer Nature remains neutral with regard to jurisdictional claims in pub-lished maps and institutional affiliations.
Received: 10 April 2018 Accepted: 23 July 2018
References
1. Rifai N, Gillette MA, Carr SA. Protein biomarker discovery and valida-tion: the long and uncertain path to clinical utility. Nat Biotechnol. 2006;24(8):971–8.
2. Picotti P, Aebersold R. Selected reaction monitoring-based proteom-ics: workflows, potential, pitfalls and future directions. Nat Methods. 2012;9(6):555–66.
3. Rosenberger G, Koh CC, Guo T, Röst HL, Kouvonen P, Collins BC, Heusel M, Liu Y, Caron E, Vichalkovski A, Faini M, Schubert OT, Faridi P, Ebhardt HA, Matondo M, Lam H, Samuel L, Bader SL, Campbell DS, Deutsch EW, Moritz RL, Tate S, Aebersold R. A repository of assays to quantify 10,000 human proteins by SWATH-MS. Sci Data. 2014;16(1):140031.
4. Parker BL, Palmisano G, Edwards AV, White MY, Engholm-Keller K, Lee A, Scott NE, Kolarich D, Hambly BD, Packer NH, Larsen MR, Cordwell SJ. Quantitative N-linked glycoproteomics of myocardial ischemia and rep-erfusion injury reveals early remodeling in the extracellular environment. Mol Cell Proteomics. 2011;10(8):110.
6. Zhou L, Beuerman RW, Chan CM, Zhao SZ, Li XR, Yang H, Tong L, Liu S, Stern ME, Tan D. Identification of tear fluid biomarkers in dry eye syndrome using iTRAQ quantitative proteomics. J Proteome Res. 2009;8(11):4889–905.
7. Zhou L, Beuerman RW. Tear analysis in ocular surface diseases. Prog Retin Eye Res. 2012;31(6):527–50.
8. Funke S, Beck S, Lorenz K, Kotterer M, Wolters D, Perumal N, Pfeiffer N, Grus F. Analysis of the effects of preservative-free tafluprost on the tear proteome. Am J Transl Res. 2016;8(10):4025–39.
9. Nättinen J, Jylhä A, Aapola U, Enríquez-de-Salamanca A, Pinto-Fraga J, López-Miguel A, González-García MJ, Stern ME, Calonge M, Zhou L, Nyk-ter M, Uusitalo H, Beuerman R. Topical fluorometholone treatment and desiccating stress change inflammatory protein expression in tears. Ocul Surf. 2018;16(1):84–92.
10. Hagan S, Martinand E, Enríquez-de-Salamanca A. Tear fluid biomarkers in ocular and systemic disease: potential use for predictive, preventive and personalized medicine. EPMA J. 2016;7:15.
11. Ross PL, Huang YN, Marchese JN, Williamson B, Parker K, Hattan S, Khainovski N, Pillai S, Dey S, Daniels S, Purkayastha S, Juhasz P, Martin S, Bartlet-Jones M, He F, Jacobson A, Pappin DJ. Multiplexed protein quanti-tation in saccharomyces cerevisiae using amine-reactive isobaric tagging reagents. Mol Cell Proteomics. 2004;3:1154–69.
12. Choe L, D’Ascenzo M, Relkin NR, Pappin D, Ross P, Williamson B, Guertin S, Pribil P, Lee KH. 8-Plex quantitation of changes in cerebrospinal fluid protein expression in subjects undergoing intravenous immunoglobulin treatment for Alzheimer’s disease. Proteomics. 2007;7:3651–60. 13. Gillet LC, Navarro P, Tate S, Röst H, Selevsek N, Reiter L, Bonner R,
Aeber-sold R. Targeted data extraction of the MS/MS spectra generated by data-independent acquisition: a new concept for consistent and accurate proteome analysis. Mol Cell Proteomics. 2012;11(6):O111.016717. 14. Datta A, Jingru QJ, Ruifen CR, Kalariac RN, Paul FP, Mitchell KP, Laia E,
Chris-topher P, Chena E, Sze SK. Novel pathophysiological markers are revealed by iTRAQ-based quantitative clinical proteomics approach in vascular dementia. J Proteomics. 2014;99(100):54–67.
15. Kristjansdottir B, Levan K, Partheen K, Carlsohn E, Sundfeldt K. Potential tumor biomarkers identified in ovarian cyst fluid by quantitative prot-eomic analysis, iTRAQ. Clin Protprot-eomics. 2013;10(1):4.
16. Mateos J, Landeira-Abia A, Fafián-Labora JA, Fernández-Pernas P, Lesende-Rodríguez I, Fernández-Puente P, Fernández-Moreno M, Delmiro A, Martín MA, Blanco FJ. Arufe MC iTRAQ-based analysis of progerin expression reveals mitochondrial dysfunction, reactive oxygen species accumulation and altered proteostasis. Stem Cell Res Ther. 2015;6:119. 17. Mikhailova A, Jylhä A, Rieck J, Nättinen J, Ilmarinen T, Veréb Z, Aapola
U, Beuerman R, Petrovski G, Uusitalo H, Skottman H. Comparative proteomics reveals human pluripotent stem cell-derived limbal epithelial stem cells are similar to native ocular surface epithelial cells. Sci Rep. 2015;5:14684.
18. An E, Lu X, Flippin J, Devaney JM, Halligan BH, Hoffman E, Csaky K, Hath-out Y. Secreted proteome profiling in human RPE cell cultures derived from donors with age related macular degeneration and age matched healthy donors. J Proteome Res. 2006;5(10):2599–610.
19. Csősz E, Borossa P, Csutakb A, Bertab A, Tótha F, Póliskac S, Töröke Z, Tőzséra J. Quantitative analysis of proteins in the tear fluid of patients with diabetic retinopathy. J Proteomics. 2012;75(7):2196–204. 20. Srinivasan S, Thangavelu M, Zhang L, Green KB, Nichols KK. iTRAQ
quantitative proteomics in the analysis of tears in dry eye patients. Invest Ophthalmol Vis Sci. 2012;53(8):5052–9.
21. Liu Y, Ruth Huttenhain R, Surinova S, Gillet L, Mouritsen J, Brunner R, Nav-arro P, Aebersold R. Quantitative measurements of N-linked glycoproteins in human plasma by SWATH-MS. Proteomics. 2013;13(8):1247–56. 22. McQueen P, Spicer V, Schellenberg J, Krokhin O, Sparling R, Levin
D, Wilkins JA. Whole cell, label free protein quantitation with data
independent acquisition: quantitation at the MS2 level. Proteomics. 2015;15(1):16–24.
23. Lombard-Banek C, Reddy S, Moody SA, Nemes P. Label-free quantification of proteins in single embryonic cells with neural fate in the cleavage-stage frog (Xenopus laevis) embryo using capillary electrophoresis elec-trospray ionization high-resolution mass spectrometry (CE-ESI-HRMS). Mol Cell Proteomics. 2016;15:2756–68.
24. Terato K, Do CT, Cutler D, Waritani T, Shionoya H. Preventing intense false positive and negative reactions attributed to the principle of ELISA to re-investigate antibody studies in autoimmune diseases. J Immunol Methods. 2014;407:15–25.
25. Mahmood T, Yang PC. Western blot: technique, theory, and trouble shoot-ing. N Am J Med Sci. 2012;4(9):429–34.
26. Stemmann O, Zou H, Gerber SA, Gygi SP, Kirschner MW. Dual inhibition of sister chromatid separation at metaphase. Cell. 2001;107:715–26. 27. Brun V, Masselon C, Garin J, Dupuis A. Isotope dilution strategies for
absolute quantitative proteomics. J Proteomics. 2009;72:740–9. 28. Tong L, Zhou L, Beuerman RW, Zhao SZ, Li XR. Association of tear proteins
with Meibomian gland disease and dry eye symptoms. Br J Ophthalmol. 2011;95(6):848–52.
29. Wong T, Zhou L, Li J, Tong L, Zhao SZ, Li XR, Yu SJ, Koh SK, Beuerman RW. Proteomic profiling of inflammatory signaling molecules in the tears of patients on chronic glaucoma medication. Invest Ophthalmol Vis Sci. 2011;52(10):7385–91.
30. Latosinska A, Vougas K, Makridakis M, Klein J, Mullen W, Abbas M, Stravodimos K, Katafigiotis I, Merseburger AS, Zoidakis J, Mischak H, Vlahou A, Jankowski V. Comparative analysis of label-free and 8-Plex iTRAQ approach for quantitative tissue proteomic analysis. PLoS ONE. 2015;10(9):e0137048.
31. Bourassa S, Fournier F, Nehmé B, Kelly I, Tremblay A, Lemelin V. Evaluation of iTRAQ and SWATH-MS for the quantification of proteins associated with insulin resistance in human duodenal biopsy samples. PLoS ONE. 2015;10(5):e0125934.
32. Karp NA, Huber W, Sadowski PG, Charles PD, Hester SV, Lilley KS. Addressing accuracy and precision issues in iTRAQ quantitation. Mol Cell Proteomics. 2010;9(9):1885–97.
33. Luo R, Colangelo CM, Sessa WC, Zhao H. Bayesian analysis of iTRAQ Data with Nonrandom Missingness: Identification of Differentially Expressed Proteins. Stat Biosci. 2009;1(2):228–45.
34. Webb-Robertson B-J, Wiberg HK, Matzke MM, Brown JN, Wang J, McDer-mott JE, Smith RD, Rodland KD, Metz TO, Pounds JG, Waters KM. Review, evaluation, and discussion of the challenges of missing value imputation for mass spectrometry-based label-free global proteomics. J Proteome Res. 2015;14(5):1993–2001.
35. Zhang F, Lin H, Gu A, Li J, Liu L, Yu T. SWATH-and iTRAQ-based quantitative proteomic analyses reveal an overexpression and biological relevance of CD109 in advanced NSCLC. J Proteomics. 2014;102:125–36.
36. Ow SY, Salim M, Noirel J, Evans C, Rehman I, Wright PC. iTRAQ underes-timation in simple and complex mixtures: “the good, the bad and the ugly”. J Proteome Res. 2009;8(11):5347–55.
37. Evans C, Noirel J, Ow SY, Salim M, Pereira-Medrano AG, Couto N, Pandhal J, Smith D, Pham TK, Karunakaran E, Zou X, Biggs CA, Wright PC. An insight into iTRAQ: where do we stand now? Anal Bioanal Chem. 2012;404(4):1011–27.
38. Tate S, Larsen B, Bonner R, Gingras AC. Label-free quantitative proteomics trends for protein–protein interactions. J Proteomics. 2013;81:91–101. 39. Megger DA, Pott LL, Ahrens M, Padden J, Bracht T, Kuhlmann K,