RESEARCH
A comprehensive overview of bull
sperm-borne small non-coding RNAs and their
diversity across breeds
Eli Sellem
1*, Sylvain Marthey
2, Andrea Rau
2, Luc Jouneau
3,4, Aurelie Bonnet
1, Jean‑Philippe Perrier
3,4,
Sébastien Fritz
1,2, Chrystelle Le Danvic
1, Mekki Boussaha
2, Hélène Kiefer
3,4, Hélène Jammes
3,4and Laurent Schibler
1Abstract
Background: Mature sperm carry thousands of RNAs, including mRNAs, lncRNAs, tRNAs, rRNAs and sncRNAs, though their functional significance is still a matter of debate. Growing evidence suggests that sperm RNAs, especially sncR‑ NAs, are selectively retained during spermiogenesis or specifically transferred during epididymis maturation, and are thus delivered to the oocyte at fertilization, providing resources for embryo development. However , a deep charac‑ terization of the sncRNA content of bull sperm and its expression profile across breeds is currently lacking. To fill this gap, we optimized a guanidinium–Trizol total RNA extraction protocol to prepare high‑quality RNA from frozen bull sperm collected from 40 representative bulls from six breeds. Deep sequencing was performed (40 M single 50‑bp reads per sample) to establish a comprehensive repertoire of cattle sperm sncRNA.
Results: Our study showed that it comprises mostly piRNAs (26%), rRNA fragments (25%), miRNAs (20%) and tRNA fragments (tsRNA, 14%). We identified 5p‑halves as the predominant tsRNA subgroup in bull sperm, originating mostly from Gly and Glu isoacceptors. Our study also increased by ~ 50% the sperm repertoire of known miRNAs and identified 2022 predicted miRNAs. About 20% of sperm miRNAs were located within genomic clusters, expanding the list of known polycistronic pri‑miRNA clusters and defining several networks of co‑expressed miRNAs. Strikingly, our study highlighted the great diversity of isomiRs, resulting mainly from deletions and non‑templated additions (A and U) at the 3p end. Substitutions within miRNA sequence accounted for 40% of isomiRs, with G>A, U>C and C>U substitutions being the most frequent variations. In addition, many sncRNAs were found to be differentially expressed across breeds.
Conclusions: Our study provides a comprehensive overview of cattle sperm sncRNA, and these findings will pave the way for future work on the role of sncRNAs in embryo development and their relevance as biomarkers of semen fertility.
Keywords: sncRNA, miRNA, isomiR, piRNA, tRNA, Sperm, Bull
© The Author(s) 2020. This article is licensed under a Creative Commons Attribution 4.0 International License, which permits use, sharing, adaptation, distribution and reproduction in any medium or format, as long as you give appropriate credit to the original author(s) and the source, provide a link to the Creative Commons licence, and indicate if changes were made. The images or other third party material in this article are included in the article’s Creative Commons licence, unless indicated otherwise in a credit line to the material. If material is not included in the article’s Creative Commons licence and your intended use is not permitted by statutory regulation or exceeds the permitted use, you will need to obtain permission directly from the copyright holder. To view a copy of this licence, visit http://creat iveco mmons .org/licen ses/by/4.0/. The Creative Commons Public Domain Dedication waiver (http://creat iveco mmons .org/publi cdoma in/ zero/1.0/) applies to the data made available in this article, unless otherwise stated in a credit line to the data.
Background
Sperm is classically seen as a transcriptionally inactive vehicle [1] that delivers the paternal haploid genome to the oocyte. Yet, an increasing number of studies in sev-eral species have shown that mature ejaculate sperm carry thousands of RNAs, including messenger RNAs (mRNAs), long non-coding RNAs, transfer RNAs
Open Access
*Correspondence: [email protected]
(tRNAs), ribosomal RNAs (rRNAs) and small non-coding RNAs (sncRNAs), especially microRNAs (miRNA), anti-sense RNAs, and Piwi-interacting RNAs (piRNA). Since transcription is mostly silenced in sperm, these RNAs are often considered to be remnant transcripts, produced during previous spermatogenesis stages [2–4]. However, a comparison of sperm and testes in horses instead sug-gested that the repertoire of sperm RNAs is not a ran-dom spermatogenesis remnant, but rather a selectively retained and functionally coherent collection of RNAs [5]. In addition, some studies in mouse have provided evidence for sncRNA regulation as sperm mature along the epididymis [6, 7], with sncRNA being transferred to sperm during post-testicular maturation, possibly through epididymosomes [8]. The functional significance of sperm sncRNAs, if any, is still a matter of debate, and future studies are required to shed light on their potential biological role. However, there is now some evidence of a role in fertilization and embryo development. Indeed, mouse sperm-borne RNAs are delivered to the oocyte at fertilization [9] and may provide essential resources for the first steps of embryo development [10]. In agree-ment with this hypothesis, sperm-borne miRNA-34c has been shown to be delivered into the mouse zygote during fertilization and play a role in the first cell division [11]. More generally, paternal miRNAs and/or endo-siRNAs have been identified as crucial for fertilization and pre-implantation embryonic development [12] and post-natal outcome [13]. In addition, involvement of sperm sncRNA has been demonstrated in epigenetic inheritance, includ-ing miRNAs [14, 15] as well as piRNAs and tRNAs [16,
17].
Unfortunately, the study of sperm sncRNAs is challeng-ing due to technical issues related to sperm RNA isola-tion, including low RNA content and resistance to lysis by detergents [9, 18]. Additionally, differences in sperm morphology and chromatin condensation may impair the interspecies use of sperm RNA isolation protocols. Consequently, highly variable sncRNA content has been obtained using different RNA extraction procedures, and until very recently only a small number of comprehensive studies were conducted. For instance, SpermBase was established in 2016 to publish RNA-seq data on mRNAs and sncRNAs in mouse, rat, rabbit, and human total sperm as well as sperm heads [19]. Among sncRNAs, 18S and 28S rRNA fragments were reported to be abundant
in sperm [20], as were tRNA-derived fragments
(tsR-NAs) [21]. Sperm tsRNAs are mainly fragments of the 5′
end of tRNA, ranging in length from 20 to 35 nt, and are produced by specific cleavage of tRNA at either D-Loop, Anticodon-Loop or T-Loop by RNase Z, Dicer or Angio-genin [21, 22]. They were recently proposed to mediate, at least in part, transgenerational effects associated with
parental diet [16, 23]. In addition, sperm tsRNAs are sub-jected to numerous RNA modifications and edits that contribute to their stability (for review see [24]). Detailed studies of the sperm miRnome have also been under-taken in several species, including humans [25], mice [26,
27], horses [28], pigs [29] and cattle [30, 31]. Extensive variations in length and sequence composition of miR-NAs were detected by deep sequencing. These so-called isomiRs are thought to be produced via imprecise and alternative cleavage by Drosha or Dicer along the miRNA biogenesis pathway [32] and do not represent
transcrip-tion or sequencing errors [33]. Shortening of miRNAs
may also arise by exonuclease trimming of the end [34]. Conversely, the post-transcriptional addition of one or more nucleotides by template-independent nucleotidyl transferases may increase miRNA length [35]. In particu-lar, seven nucleotidyl transferases have been implicated in human isomiR biogenesis, especially
uridyltrans-ferases and adenyltransuridyltrans-ferases [36], including PAPD4
which is considered to be the primary miRNA
adenylat-ing enzyme [37]. Polymorphisms within the internal
canonical sequences have also been described in isomiRs expressed at low levels [38], resulting either from genetic polymorphism or from A–I editing, i.e., the hydrolytic deamination of adenosine to inosine in double-stranded
RNA [36]. A growing body of evidence indicates that
these changes may affect isomiR stability or influence target selection [36, 37]. IsomiRs have been shown to be non-randomly distributed and expressed in a devel-opmental- and tissue-specific manner in several human tissues [39]. Their broader biological significance is yet to be fully resolved, but some studies suggest that altera-tion in isomiR profiles, rather than in the overall miRNA abundance, is of biological significance, correlating for instance with cancer progression [40]. In cattle, several miRNAs have been shown to be differentially expressed between high- and low-fertility bulls [41, 42], as well as between high- and low-motility sperm [30].
This study was thus designed to unravel the sncRNA content from frozen bull sperm, focusing on tsRNAs, miRNAs, and their structural variations (called “isomiRs” by Morin et al. [43]), as well as the diversity of their expression profiles according to breeds. To do so, we optimized a guanidinium–Trizol total RNA extraction protocol for frozen bull sperm to ensure good sample quality and reproducibility.
Results
RNA extraction and NGS sequencing
than 1 somatic cell per 1000 sperm cells) and side-scatter profiles obtained by flow cytometry (data not shown). In addition, no RNAs could be extracted from the extender used by semen production centers to dilute the sperm cells. Altogether, these results indicate that the identifi-cation of sperm sncRNA content is not jeopardized by contaminants.
On average, 57.6 ± 12.9 ng of total RNA could be pre-pared from 31.2 ± 7 million thawed sperm cells. Techni-cal variation was evaluated based on multiple analyses of a standard ejaculate, showing good reliability with a coef-ficient of variation less than 10% in the amount of total RNA prepared using the protocol. Typical electropho-retic profiles were obtained, with no evidence of 18S and 28S rRNAs. RT-qPCR was performed to validate RNA quality and concentrations on a subset of 3 samples for each extraction batch, leading to consistent amplifica-tion results (Ct in the range of 20–21 starting from 5 ng of total RNA) and single peak melt curves, indicating that a single, specific product had been produced (Additional file 1: Fig. S1).
Sequencing resulted in 1,444,722,663 total raw sequence reads. About 36.1 million reads were obtained on average (± 4.5 million, min = 28.3 and max = 49.5) for the 40 libraries. The overall data quality was good, with > 97% of the data having a Q-score over 30 (i.e., a base-calling accuracy of 99.9%). Typical examples of FastQC quality control plots are provided in Additional file 2: Fig S2a. After trimming sequencing adapters, read length distribution revealed two main peaks representing mostly microRNAs or siRNAs (~ 18–26 nt) and interme-diate sequences (28–32 nt), including piRNAs and tsR-NAs (Additional file 2: Fig S2b). About 72% of sequences could be mapped unambiguously to the cattle reference genome on average, while 15% were outmapped (i.e., mapped to abundant sequences such as polyA and polyC homopolymers or other repetitive sequences) and 13% were unmapped (Table 1).
The overall small RNA content of bull sperm
Reads were analyzed and categorized as described in the Material and Methods. First, 701 known and 2022 puta-tive miRNAs were identified using miRDeep2 (Addi-tional file 3: Table S1). The remaining reads were then annotated using several mRNA and sncRNA databases,
highlighting the diversity of sncRNA in cattle sperm
(Additional file 3: Tables S2–S6). As summarized in
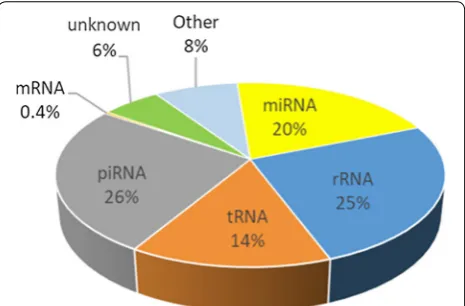
Fig. 1, sperm RNA contains mainly piRNAs (26%), rRNAs (25%), miRNAs (20%), tRNAs (14%), other sncRNAs (8%, including mainly Signal Recognition Particle (SRP) RNA, fragments of lncRNAs, Y_RNA and snRNA) and 6% of unknown sequences. In addition, about 27,655 reads (with a majority being 50 nt in length) were identified as mRNA fragments originating from 3510 genes, of which 95% were already described in human or mouse sperm (http://sperm base.org). The gene coverage was usually low (7.7 ± 3.1 different unique reads per gene on aver-age, preferentially clustered at the 5p end of the gene), but a few genes were found to be covered by well-dis-tributed unique reads (37 genes with more than 100 dif-ferent reads) and have high read counts (see for instance the AKAP1 and PRM1 IGV profiles in Additional file 4: Fig S3). A gene ontology analysis of these genes revealed several relevant enriched biological terms, including male gamete generation (GO:0048232), spermatogenesis (GO:0007283), and gamete generation (GO:0007276).
Bull sperm contains abundant rRNA‑derived small RNAs
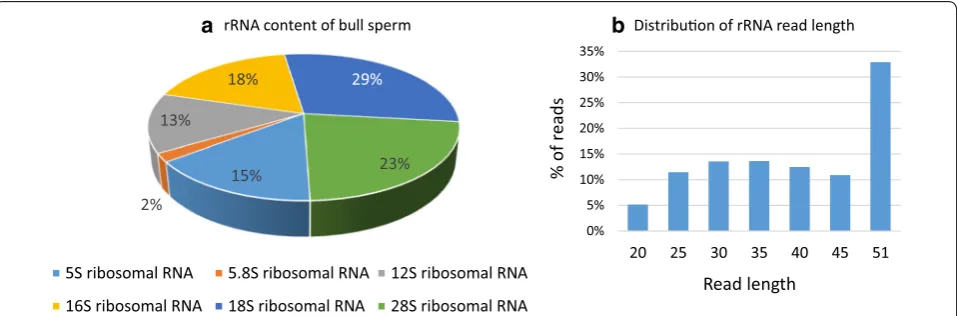
About 25% of reads were annotated as rRNAs, mainly the 16S (18%), 18S (29%) and 28S (23%) rRNAs, as illus-trated in Fig. 2a. Though highly abundant, these rRNAs
Table 1 Mapping statistics across the 40 libraries
Mapped (72%) Outmapped (15%) Unmapped (13%) Reads
Reads no. 1,038,383,839 223,342,595 181,996,229 1,443,722,663
Mean 25,959,596 5,583,565 4,549,906 36,093,067
Std. deviation 3,542,949 1,932,607 4,370,783 4,483,073
appeared to be fragmented, with two-thirds being less than 45 nt in length (Fig. 2b). In addition, the distribu-tion of reads along rRNA transcripts revealed a series of peaks and read-poor sub-regions, especially for 18S and 28S rRNAs (Additional file 5: Fig S4).
Bull sperm contains abundant piRNAs
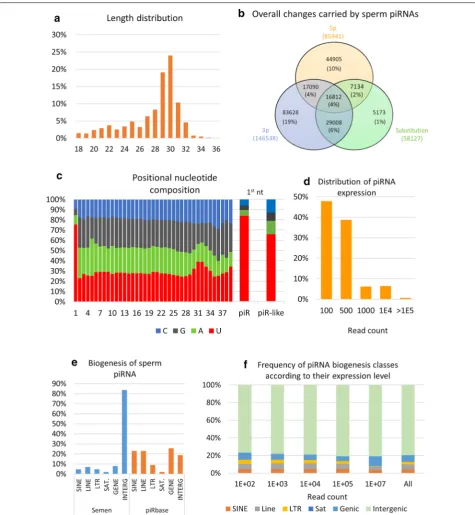
About 26% of reads were annotated by piRNAs, with a size distribution peaking at 30 nt and two-thirds of reads being in the range of 27–32 nt (Fig. 3a). Among these reads, 54% matched perfectly with a published piRNA sequence. The remaining reads were considered to be piRNA-like sequences, bearing mostly 3p and 5p changes (19% and 10% of reads, respectively) or a combination (17%) of 5p, 3p and/or substitutions (Fig. 3b). Modifica-tions of a single nucleotide at either the 5p or 3p end were the most frequent changes (81% and 67% of changes, respectively), with deletions accounting for about 85% of changes at both the 5p and 3p ends (see Additional file 3: Table S4). As expected, piRNA reads showed a typical nucleotide composition (Fig. 3c), with strong enrichment for uridine at the first position. This “1U bias” was also observed for piRNA-like sequences, although to a lesser extent (66% compared to 84% for piRNAs). No adenine enrichment at piRNA nt 10 could be observed for both
piRNA and piRNA-like sequences [44]. As shown by
the distribution of expression (Fig. 3d and Additional file 3: Table S4), about 50% of piRNAs were expressed at low levels (less than 100 mapped reads), and only 7% were very highly expressed (greater than 10,000 mapped reads). According to the piRBase biogenesis classifi-cation, sperm piRNAs were found to primarily derive from intergenic (84%), genic (8%) and LINE-rich (7%) regions (Fig. 3e). Interestingly, a highly significant four-fold enrichment was observed for sperm piRNAs derived from intergenic regions compared to the whole piRBase
database (see Additional file 3: Table S4). Conversely, all other classes were found to be highly under-represented in sperm. When computing the frequency of each bio-genesis class according to the piRNA expression level, no particular enrichment could be observed with the excep-tion of gene-derived piRNAs, which account for a larger proportion of highly expressed reads (Fig. 3f).
Bull sperm contains abundant tRNA‑derived small RNAs (tsRNAs)
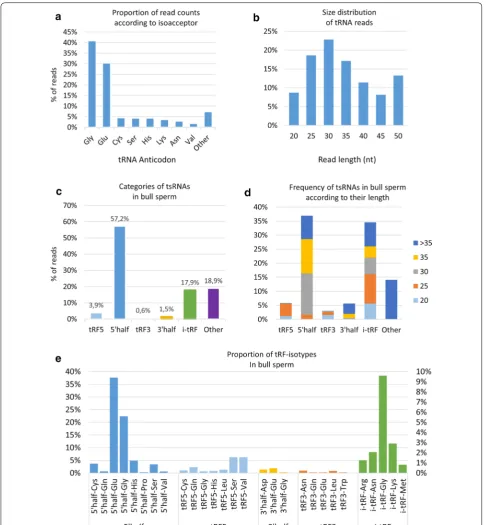
A total of 61,991 sequences were annotated as tRNAs, covering the full range of isoforms associated with the 22 amino acids. However, two isoacceptors contributed to 71% of all identified tsRNA: glycine (41% of read counts) and glutamine (30% of reads counts). As illustrated in
Fig. 4a, six tRNA isoforms each accounted for 2–5%,
with the others together accounting for about 7% of read counts. The size of these reads was in the 18–50 nt range, with a bimodal distribution peaking at 30 nt and 50 nt (Fig. 4b).
Previous studies have shown that 20–35 nt fragments do not represent random degradation products, but instead are generated by specific mechanisms producing four main categories of tsRNAs, as illustrated in Addi-tional file 6: Fig S5. As shown in Fig. 4c, 5p-tRHs were the most expressed tRFs, accounting for 57% of read counts, while i-tRFs and tRF5 accounted for 18% and 4%, respectively. Interestingly, nearly 65% of all i-tRFs (84% of expression) were found to be produced by mitochon-dria (MT) tRNAs. About 19% of reads were classified as “other” and were shown to be more than 35 nt in length (Fig. 4d). These reads were found to be mainly clustered at the 5p side of tRNAs, 75% of them starting at the 1st tRNA nucleotide. In contrast, the i-tRF group was found to be diverse in terms of size, while tRF5 and tRF3 were mainly in the 20–25 nt range. When focusing on tsRNAs
15% 2%
13%
18% 29%
23%
rRNA content of bull sperm
5S ribosomal RNA 5.8S ribosomal RNA 12S ribosomal RNA 16S ribosomal RNA 18S ribosomal RNA 28S ribosomal RNA
0% 5% 10% 15% 20% 25% 30% 35%
20 25 30 35 40 45 51
% of read
s
Read length Distribuon of rRNA read length
a
b
in the range 20–40 nt, the most abundant tRFs were 5p-tRHs, especially Glu, Gly, His and Cys isoacceptors (Fig. 4e and Additional file 7: Fig S6).
Among i-tRFs, the most abundant were i-tRF-Gly, i-tRF-Lys and i-tRF-Asn, with distinct read length dis-tributions: e.g., reads 20–25 nt and 25–30 nt in length contributed equally (~ 42%) to i-tRF-Gly, while 25–30 nt reads accounted for 60% of i-tRF-Lys (Additional file 7: Fig S6). The most abundant tRF5s were tRF-Ser and tRF5-Val, the majority of reads being 25 nt in length. Most tRF3s are short fragments (20 nt), with tRF3-Asn and tRF3-Leu being the most abundant. Interestingly, cleavage sites within the anticodon-loop were found to be biased towards the 5p-side of the anticodon for both tRHs (Additional file 8: Fig S7). The 4th nucleotide appeared to be a preferential cleavage site for 3p-tRHs, while 5p-tRHs are produced by cleavage between the 4th and 7th nucleotides.
The bull sperm miRnome Overall description
Based on miRDeep2 software, 2723 unique miRNAs were detected, belonging to 2579 miRNA precursors (pre-miRNAs). Among them, 701 (26%) were already known (550 in cattle, 60 in humans, 33 in mouse, and 58 in other species), corresponding to 635 known cattle pre-miRNAs (Fig. 5a, b). The remaining 2022 predicted miRNAs were associated with 1944 predicted pre-miRNAs (Additional file 3: Table S1). A total of 275 pre-miRNAs, including 184 known pre-miRNAs, were covered by both 5p and 3p miRNAs, while 26 predicted miRNAs may be pro-duced by 97 pre-miRNA belonging to miRNA families (ranging from two to seven members). As shown by the distribution of normalized expression (Fig. 5c and Addi-tional file 3: Table S7), the vast majority (80%) of miRNAs (6% of the known and 85% of the predicted miRNAs) were expressed at low levels (2187 miRNAs expressed with fewer than 100 mapped reads on average) and only 53 miRNAs were highly expressed (more than 10,000 mapped reads). The most highly expressed miRNA, bta-mir-100, exhibited about 1.5 M mapped reads.
The 20 most expressed miRNAs (> 35,000 mapped reads) accounted for 77% of all miRNA-associated reads
(Fig. 5d). Bta-mir-100 accounted for 40% of the mapped reads for these top twenty, and for one-third of all miRNA reads. The second most expressed miRNA (bta-mir-148) was three times less expressed, accounting for 13.6% of the mapped reads from the top twenty. Interest-ingly, these top twenty miRNAs included 18 known and 2 putative miRNAs.
Genomic distribution and correlation of expression
The half of miRNAs (52%) are located within genic fea-tures (10 kb interval), including within introns (29%), exons (9%), or other regulatory regions such as the pro-moter, TSS, TTS, 3p or 5p UTR (13%). As illustrated in
Fig. 5e, known and predicted miRNAs showed nearly
the same distribution, with known miRNAs being a lit-tle bit more frequently located within genic regions (54 vs 51% for predicted miRNAs). Based on miRBase stand-ards (10 kb windows), 216 miRNA genomic clusters could be defined along the bovine genome (Additional file 3: Table S8), containing 532 miRNAs (i.e., 20% of total sperm miRNAs).
To highlight genomically clustered miRNAs that could in fact be co-expressed on the same primary transcript, expression correlations were calculated between each pair of the top 1580 miRNAs with mean expression level greater than 10 in at least one breed. While a majority (66%) of the 1.2 million correlation coefficients clustered near zero, significant correlations were observed and are reported in Additional file 3: Table S9. Only 45 signifi-cant strongly negative correlations (r < − 0.7 and adjusted
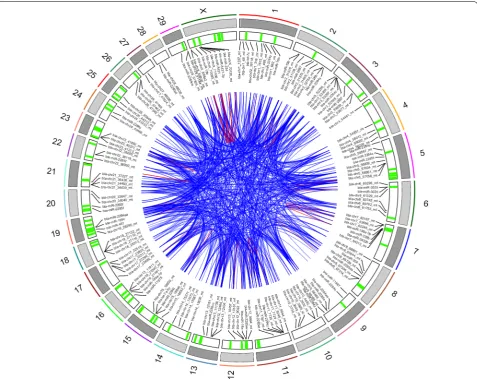
p value < 0.001) involving 59 miRNAs were observed, compared to 3357 significant strongly positive correla-tions (r > 0.75 and adjusted p-value < 0.001) involving 755 miRNAs. As illustrated by the Circos plot (Fig. 6), most correlations involved miRNA located on separate chromosomes.
Correlations between genomically clustered miR-NAs showed a distinct distribution (Additional file 3: Table S10 and Additional file 9: Fig S8), suggesting stronger correlations than for non-clustered miRNAs. However, only 77 out of 216 (about one-third) of the genomic clusters showed strong expression corre-lation between miRNAs. In particular, Cluster 170
Fig. 5 Bull sperm miRNA content. a Using miRDeep2 software, 2723 miRNAs were identified in bull sperm, including 701 (26%) known and 2022 (74%) predicted miRNAs. b Among known miRNAs, 550 were already described in cattle, 60 in human, 33 in mouse and 58 in other species. c The vast majority (80%) of miRNAs were expressed at low levels (2187 miRNAs expressed below 100 mapped reads on average), and only 53 miRNAs were highly expressed (above 10,000 mapped reads). d Twenty miRNAs account for 75% of the total miRNA mapped reads, including bta‑mir‑100, which alone accounts for 30% of miRNA expression (40% of the mapped reads for the top twenty miRNAs). (e) miRNA location within several genomic features, including intergenic or genic regions (introns, exons, and other regulatory regions, such as promoter, TSS, TTS, 3p or 5p UTR). Percentages shown on each rightmost “Pie of Pie” chart are expressed relative to the genic miRNAs. (i) Global distribution of sperm miRNAs. (ii) Distribution of known mRNAs; (iii) Distribution of predicted miRNAs
had 10 strong correlations between 12 miRNAs (bta-miRNA-381, bta-miRNA-382, bta-miRNA-134, mmu-miRNA-409-3p, bta-miRNA-409a, bta-miRNA-369-3p, bta-miRNA-410, bta-miRNA-3956, hsa-miRNA-382-3p, miRNA-323b-3p, miRNA-656, bta-miRNA-369-5p) among the 19 miRNAs located in this 22 kb cluster. Likewise, clusters 1, 3, 5 and 7 showed strong correlations between at least 4 miRNAs (miRNA-411a, miRNA-323, miRNA-543, bta-miRNA-495, bta-miRNA-411b, hsa-miRNA-329-3p for Cluster 1; miRNA-431, miRNA-127, bta-miRNA-432, mmu-miRNA-127-5p for Cluster 3; bta-miRNA-19a, bta-miRNA-20a, bta-miRNA-19b, bta-miRNA-18a, bta-miRNA-17-5p for Cluster 5; and
302b, hsa-miRNA-302a-5p, bta-miRNA-302a, bta-mir-302d for Cluster 7).
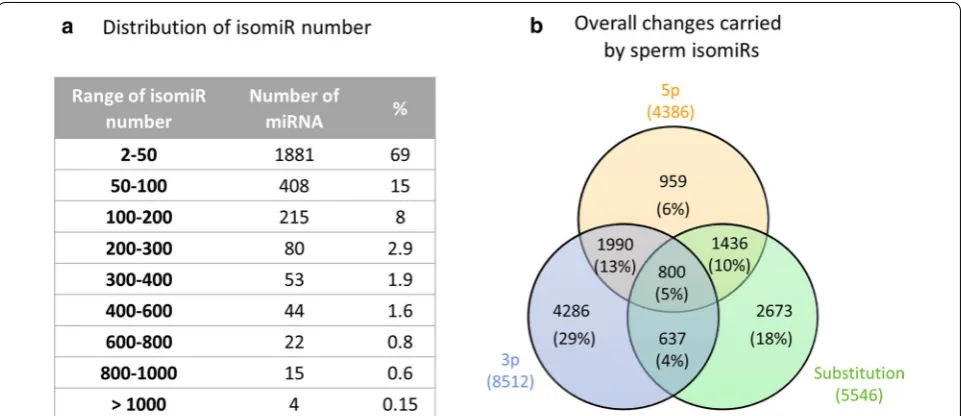
When considering correlations above |0.5|, 43 clusters of co-expressed miRNA could be defined, ranging from 2 to 16 co-expressed miRNAs (Table 2).
Intriguingly, most clusters gather either known or puta-tive miRNAs, with the exception of Clusters 169 and 211, which comprise both known and predicted miRNAs.
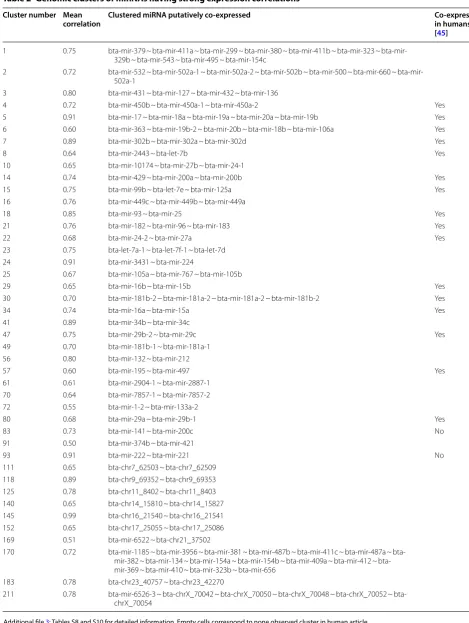
Regarding significant correlations between miRNAs that are not genomically clustered, we identified 77 cor-relation networks made up of 2 to 61 positively correlated miRNAs (Fig. 7).
Table 2 Genomic clusters of miRNAs having strong expression correlations
Cluster number Mean
correlation Clustered miRNA putatively co‑expressed Co‑expressed in humans
[45]
1 0.75 bta‑mir‑379 ~ bta‑mir‑411a ~ bta‑mir‑299 ~ bta‑mir‑380 ~ bta‑mir‑411b ~ bta‑mir‑323 ~ bta‑mir‑ 329b ~ bta‑mir‑543 ~ bta‑mir‑495 ~ bta‑mir‑154c
2 0.72 bta‑mir‑532 ~ bta‑mir‑502a‑1 ~ bta‑mir‑502a‑2 ~ bta‑mir‑502b ~ bta‑mir‑500 ~ bta‑mir‑660 ~ bta‑mir‑ 502a‑1
3 0.80 bta‑mir‑431 ~ bta‑mir‑127 ~ bta‑mir‑432 ~ bta‑mir‑136
4 0.72 bta‑mir‑450b ~ bta‑mir‑450a‑1 ~ bta‑mir‑450a‑2 Yes
5 0.91 bta‑mir‑17 ~ bta‑mir‑18a ~ bta‑mir‑19a ~ bta‑mir‑20a ~ bta‑mir‑19b Yes 6 0.60 bta‑mir‑363 ~ bta‑mir‑19b‑2 ~ bta‑mir‑20b ~ bta‑mir‑18b ~ bta‑mir‑106a Yes
7 0.89 bta‑mir‑302b ~ bta‑mir‑302a ~ bta‑mir‑302d Yes
8 0.64 bta‑mir‑2443 ~ bta‑let‑7b Yes
10 0.65 bta‑mir‑10174 ~ bta‑mir‑27b ~ bta‑mir‑24‑1
14 0.74 bta‑mir‑429 ~ bta‑mir‑200a ~ bta‑mir‑200b Yes
15 0.75 bta‑mir‑99b ~ bta‑let‑7e ~ bta‑mir‑125a Yes
16 0.76 bta‑mir‑449c ~ bta‑mir‑449b ~ bta‑mir‑449a
18 0.85 bta‑mir‑93 ~ bta‑mir‑25 Yes
21 0.76 bta‑mir‑182 ~ bta‑mir‑96 ~ bta‑mir‑183 Yes
22 0.68 bta‑mir‑24‑2 ~ bta‑mir‑27a Yes
23 0.75 bta‑let‑7a‑1 ~ bta‑let‑7f‑1 ~ bta‑let‑7d 24 0.91 bta‑mir‑3431 ~ bta‑mir‑224
25 0.67 bta‑mir‑105a ~ bta‑mir‑767 ~ bta‑mir‑105b
29 0.65 bta‑mir‑16b ~ bta‑mir‑15b Yes
30 0.70 bta‑mir‑181b‑2 ~ bta‑mir‑181a‑2 ~ bta‑mir‑181a‑2 ~ bta‑mir‑181b‑2 Yes
34 0.74 bta‑mir‑16a ~ bta‑mir‑15a Yes
41 0.89 bta‑mir‑34b ~ bta‑mir‑34c
47 0.75 bta‑mir‑29b‑2 ~ bta‑mir‑29c Yes
49 0.70 bta‑mir‑181b‑1 ~ bta‑mir‑181a‑1 56 0.80 bta‑mir‑132 ~ bta‑mir‑212
57 0.60 bta‑mir‑195 ~ bta‑mir‑497 Yes
61 0.61 bta‑mir‑2904‑1 ~ bta‑mir‑2887‑1 70 0.64 bta‑mir‑7857‑1 ~ bta‑mir‑7857‑2 72 0.55 bta‑mir‑1‑2 ~ bta‑mir‑133a‑2
80 0.68 bta‑mir‑29a ~ bta‑mir‑29b‑1 Yes
83 0.73 bta‑mir‑141 ~ bta‑mir‑200c No
91 0.50 bta‑mir‑374b ~ bta‑mir‑421
93 0.91 bta‑mir‑222 ~ bta‑mir‑221 No
111 0.65 bta‑chr7_62503 ~ bta‑chr7_62509 118 0.89 bta‑chr9_69352 ~ bta‑chr9_69353 125 0.78 bta‑chr11_8402 ~ bta‑chr11_8403 140 0.65 bta‑chr14_15810 ~ bta‑chr14_15827 145 0.99 bta‑chr16_21540 ~ bta‑chr16_21541 152 0.65 bta‑chr17_25055 ~ bta‑chr17_25086 169 0.51 bta‑mir‑6522 ~ bta‑chr21_37502
170 0.72 bta‑mir‑1185 ~ bta‑mir‑3956 ~ bta‑mir‑381 ~ bta‑mir‑487b ~ bta‑mir‑411c ~ bta‑mir‑487a ~ bta‑ mir‑382 ~ bta‑mir‑134 ~ bta‑mir‑154a ~ bta‑mir‑154b ~ bta‑mir‑409a ~ bta‑mir‑412 ~ bta‑ mir‑369 ~ bta‑mir‑410 ~ bta‑mir‑323b ~ bta‑mir‑656
183 0.78 bta‑chr23_40757 ~ bta‑chr23_42270
211 0.78 bta‑mir‑6526‑3 ~ bta‑chrX_70042 ~ bta‑chrX_70050 ~ bta‑chrX_70048 ~ bta‑chrX_70052 ~ bta‑ chrX_70054
pattern (for instance the positive correlation between bta-miR-24-3p and bta-miR-107, while bta-miR-24-3p and miR-107 are negatively correlated with bta-chr7-64527_mt suggests that bta-miR-24-3p may regu-late bta-chr7-64527_mt, which may in turn reguregu-late bta-miR-107, see Additional file 10: Fig S9).
Likewise, negatively correlated miRNAs defined 14 correlation networks, ranging from 2 to 76 miRNAs (Fig. 8). Interestingly, among these, 41 “master” miRNAs were found to be negatively correlated with 46 master miRNAs, thus defining putative regulatory networks with their host genes.
The repertoire isomiRs in bull sperm
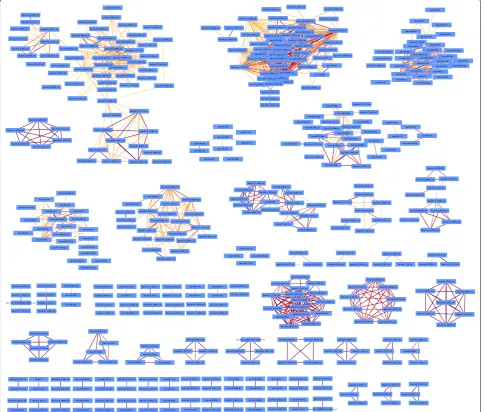
We also studied the diversity of isomiRs, i.e., changes in the mature miRNA sequence, including substitutions (Polymorphic isomiRs), cleavage variations (5p and 3p isomiRs), and additions at either the 5p or 3p end (see Additional file 11: Fig S10 for some examples of isomiRs and their nomenclature). Altogether, 192,895 isomiRs were identified among the 2723 sperm miRNA (Addi-tional file 3: Table S11). The number of isomiRs per miRNA varied greatly, ranging from 1 (bta-chr18_27604_ mt) to 1439 (chi-miRNA-34b-3p), with on average 71 ± 126 isomiRs per miRNA. As shown in Fig. 9a, the
bta-chr6_61103_mt bta-miR-378c ami-miR-215-3p bta-miR-411b bta-chr8_65772_mt bta-chr4_54509_mt bta-chr2_32372_mt hsa-miR-500a-3p bta-chr2_33106_mt bta-chr14_15087_mt
bta-chr21_35733_mt bta-miR-502a bta-miR-215
bta-chr11_6044_mt bta-chr9_68040_mt bta-miR-2285cc bta-miR-378 bta-chr22_39105_mt
bta-chr21_35745_mt bta-miR-411a bta-chr14_17073_mt
bta-chr7_64929_mt bta-chr22_38867_mt bta-chrUn_GJ059036v1_69686_mt
bta-chr1_2172_mt bta-chr17_24755_mt bta-chr14_15810_mt bta-chr10_5993_mt bta-chrX_71230_mt bta-miR-29a bta-chr7_63615_mt bta-chr22_38147_mt bta-chrX_70338_mt bta-chr17_22498_mt bta-chr5_57804_mt bta-chr9_69352_mt bta-chr11_8402_mt bta-chr25_44979_mt bta-chr15_19138_mt bta-chr22_39495_mt bta-chr17_23499_mt bta-chr19_28290_mt bta-chr11_7729_mt bta-chrX_70776_mt bta-chr29_51825_mt bta-chr21_35895_mt bta-chr8_66601_mt bta-chr4_56092_mt bta-chr5_57874_mt bta-chr15_17795_mt bta-chr1_1921_mt bta-chr20_34040_mt bta-chr23_40655_mt bta-chr1_2028_mt bta-chr19_30759_mt bta-chrX_69842_mt bta-chr5_57819_mt bta-chr1_780_mt bta-chr2_32559_mt bta-chr19_28371_mt
bta-miR-151-3p bta-chr8_66333_mt bta-chr9_67883_mt bta-chr22_38032_mt bta-chr2_31650_mt bta-chr13_12781_mt oar-miR-154a-3p bta-chr1_1237_mt bta-chr13_12464_mt bta-chr22_38950_mt bta-chr16_20746_mt bta-chr23_41114_mt bta-chr7_64213_mt bta-chr26_47023_mt bta-chr25_46400_mt bta-chr7_62167_mt bta-chr7_62246_mt bta-chr15_18525_mt bta-chr2_33151_mt bta-miR-29c bta-chr28_49994_mt bta-chr10_5488_mt bta-miR-16a bta-chr21_37449_mt bta-miR-16b bta-chr15_18693_mt bta-chr16_20638_mt bta-chr1_107_mt bta-miR-379 bta-miR-455-5p bta-miR-3956 bta-miR-10172-3p bta-miR-134 bta-miR-409a bta-miR-381 bta-miR-127 bta-miR-495 bta-chr5_56567_mt bta-chr11_7301_mt bta-chr17_23923_mt bta-chr26_47345_mt bta-chr23_40757_st bta-chr23_42270_mt bta-chr23_42181_mt bta-chr12_9821_mt bta-chr5_57267_mt bta-chr22_38428_mt bta-chr8_67569_mt bta-miR-369-3p mmu-miR-136-3p bta-miR-410 bta-miR-323 bta-miR-487b oar-miR-154b-3p bta-chr21_37227_mt bta-chr18_25631_mt bta-chr11_6217_mt bta-chr27_47968_mt bta-chr10_2883_mt bta-chr18_27292_mt bta-chr5_56909_mt bta-miR-148a bta-miR-323b-3p mmu-miR-127-5p mmu-miR-409-3p oar-miR-1185-3p bta-miR-432 bta-miR-431 hsa-miR-329-3p mmu-miR-299a-3p bta-miR-543 bta-miR-2285dd bta-chr3_53256_mt bta-chr3_52824_mt bta-chrX_70120_mt bta-miR-2284n bta-miR-11975 bta-miR-302d bta-chr23_40371_mt bta-miR-339a bta-miR-199c bta-chr10_2632_mt bta-miR-204 bta-miR-199a-3p bta-miR-211 bta-miR-339b bta-chrUn_GJ057167v1_69588_mt bta-chr19_30535_mt bta-chr11_8505_mt bta-chr13_12434_mt bta-chr20_33647_mt bta-miR-2285aj-5p bta-chr19_29172_mt bta-miR-11976 bta-chr14_15271_mt bta-miR-2285da bta-chr21_35796_mt bta-miR-11987 bta-miR-302a bta-chr11_7501_mt bta-chr5_57056_mt bta-miR-17-5p bta-chr11_8686_st bta-chr19_30571_mt bta-miR-20a bta-chr11_7787_mt bta-chr11_8691_mt bta-chr25_45077_mt bta-chr14_13830_mt bta-miR-2285f bta-chr13_11954_mt bta-chr18_25574_mt bta-chr7_63696_mt bta-chr7_64059_mt bta-chr18_26451_mt bta-chr21_37471_mt bta-chr23_41213_mt bta-chr6_61961_mt bta-chr16_21481_mt bta-chr9_69291_mt bta-chr26_46963_mt bta-chr16_21494_mt bta-chr3_52407_mt bta-chr17_25086_mt bta-chr26_46995_mt bta-chr2_32764_mt bta-chr8_67306_mt bta-miR-10167-3p bta-chr7_62747_mt bta-chr5_56701_mt bta-chr14_15332_mt bta-chr2_33044_mt bta-chr5_58306_mt bta-chr7_62509_mt bta-chr3_52028_mt bta-chr7_63775_mt bta-chr3_52702_mt bta-chr14_16916_mt bta-chr15_18027_mt bta-chr10_2553_mt bta-chr5_58731_mt bta-chr17_23308_mt bta-chr5_59075_mt bta-chr9_69004_mt bta-chr3_53309_mt bta-chr18_27119_mt bta-chr21_34450_mt bta-chr8_65825_mt bta-chr11_7041_mt bta-chr15_19300_mt bta-chr7_63189_mt bta-chr23_42131_mt bta-chr19_29169_mt bta-chr8_66647_mt bta-chr21_37739_mt bta-chr11_6939_mt bta-chr7_63663_mt bta-chr29_51740_mt bta-chr12_8939_mt bta-chr10_4235_mt bta-chr3_53105_mt bta-chr12_10046_mt bta-chr23_40565_mt bta-chr21_34439_mt bta-chr6_60782_mt bta-chr25_45848_mt bta-chrX_71100_mt bta-chr21_35406_mt bta-chr6_61329_mt bta-chr2_31128_mt bta-chr5_58861_mt bta-miR-486 bta-chr11_8686_mt bta-chr1_1615_mt bta-chr2_31691_mt bta-chr3_53013_mt bta-chr13_12786_mt bta-chr5_57004_mt bta-miR-664b bta-miR-29b bta-miR-15a bta-miR-106b bta-chr12_10528_mt bta-chr18_26998_mt bta-chr6_61407_st bta-chr18_27122_mt bta-chr18_27788_mt bta-chr5_58423_st bta-chr28_49920_mt bta-chr11_8231_mt bta-chr12_10161_mt bta-miR-1246 bta-chr14_13362_st bta-chr26_47462_mt bta-chr23_40334_mt bta-chr7_62285_mt bta-chr19_30352_mt bta-chr13_12359_mt bta-chr27_48274_mt bta-chr15_18021_mt bta-chr12_10124_mt bta-miR-451 bta-chr14_15057_mt bta-chr17_23107_mt bta-chr14_16577_st bta-chr23_42309_mt bta-chr26_47525_mt bta-miR-2285au bta-chr10_3649_mt bta-miR-2284h-5p bta-miR-148b bta-miR-2284m bta-miR-2284y bta-miR-2284x bta-chr6_62018_mt bta-miR-2284j bta-chrX_69838_mt bta-chr13_11138_mt bta-chr28_48638_mt bta-chr1_316_mt bta-chr9_69285_mt bta-miR-2887 bta-chr4_56012_mt bta-chr3_52935_mt bta-chr6_60993_mt bta-chr5_57806_mt bta-chr8_65729_mt bta-miR-205 bta-chr11_6248_mt bta-chr18_25605_mt bta-chr5_58065_mt bta-chr11_8055_mt hsa-miR-361-3p bta-chr4_54957_mt bta-chr5_60107_mt bta-chr23_40454_mt bta-miR-18a bta-miR-93 mmu-miR-200a-5p bta-chr6_60742_mt bta-chr25_45297_mt bta-chr1_682_mt bta-chr2_33069_mt bta-chr8_67851_mt bta-chr17_22296_mt bta-chr3_53877_mt bta-chr20_33654_mt bta-chr16_20676_mt bta-chr13_12084_mt bta-chr18_26425_mt bta-chr28_48790_mt bta-chr16_20643_mt bta-chr21_35370_mt bta-chr16_21502_mt bta-chr18_27116_mt mdo-miR-449a-3p bta-miR-30b-5p bta-miR-2284k bta-miR-2284o bta-miR-2284a bta-miR-34b bta-chr11_8346_mt bta-chr24_43466_mt bta-miR-2285bo bta-miR-2285av bta-miR-2284b bta-miR-34c bta-chr14_13799_mt bta-chrX_70589_mt bta-chr3_53367_mt bta-chr19_30165_mt bta-chr13_12902_mt bta-chr10_6004_mt bta-chr12_9531_mt bta-chr13_12861_mt bta-chr21_36436_mt bta-chr16_21884_mt bta-chr4_56228_mt bta-chrX_71516_mt bta-chr19_30203_mt bta-chr6_60296_mt bta-chr16_21540_mt bta-chr25_44843_mt bta-chrX_70869_mt bta-chr18_26669_mt bta-chr13_11911_mt chi-miR-3431-3p bta-miR-224 bta-miR-135a bta-let-7b mmu-miR-221-5p bta-miR-429 mmu-miR-10b-3p ami-miR-10a-3p bta-miR-1298 bta-miR-652 bta-miR-374b bta-miR-200a bta-chr16_20911_mt bta-chr11_7510_mt
bta-chr13_11685_mt bta-chr10_3803_mt bta-chr17_22613_mt
bta-chrX_70019_mt bta-miR-3431 bta-chr17_22045_mt bta-miR-26b bta-miR-222 bta-miR-10a ssc-miR-374a-3p hsa-miR-148a-5p bta-miR-30f bta-miR-197 bta-miR-21-5p bta-miR-19a mmu-miR-140-5p bta-miR-101 bta-miR-19b bta-miR-449a bta-miR-10b bta-miR-221 bta-miR-1307 bta-miR-361 bta-miR-1296 bta-miR-200c mmu-miR-99b-3p bta-miR-345-3p bta-miR-26a bta-miR-200b bta-miR-141 bta-miR-374a bta-chr15_18959_mt bta-chr1_2288_mt bta-miR-2284v bta-chr6_61753_mt bta-chr19_28891_mt bta-chr1_495_mt bta-chr12_9022_mt bta-chrX_70450_mt bta-chr11_6884_mt bta-chr16_20753_mt bta-chr1_1006_mt bta-chr5_60134_mt bta-chr17_22311_mt bta-chr25_44313_mt bta-chr19_30241_mt bta-chr2_31379_mt bta-chrX_70837_mt bta-chr18_25513_mt bta-chrUn_GJ059918v1_69779_mt bta-chr19_29090_mt bta-chr2_31469_mt bta-chr7_62736_mt bta-chr11_7735_mt bta-chr11_8179_mt bta-chr15_18846_mt bta-chr8_65644_mt bta-miR-2285at bta-chr19_30763_mt bta-chr9_68466_mt bta-miR-2285e bta-chr18_26579_mt bta-chr10_5469_mt bta-chrX_70821_mt bta-chr1_1921_st bta-chr12_9994_mt bta-chr22_38118_mt bta-chrX_70085_mt bta-miR-2285bn bta-miR-3432b bta-chr2_31019_mt bta-chr3_53858_mt bta-chr7_64684_mt bta-miR-3432a bta-chr7_64373_mt bta-miR-2285ce bta-chr12_10646_mt bta-chr4_54461_mt bta-chr29_51184_mt bta-chr27_47624_mt bta-chr23_41882_mt bta-chr23_42094_mt cgr-miR-29c-5p
bta-chr3_52559_mt bta-chr10_3609_st bta-miR-2285br bta-chr10_3730_mt bta-miR-2285bz bta-chr18_27423_mt bta-chr25_46151_mt bta-chr15_17841_mt bta-chr3_53135_mt bta-miR-10174-3p bta-miR-2284z bta-miR-23b-3p bta-miR-2284aa bta-chr12_10457_mt bta-chr19_30132_mt bta-chr1_68_mt bta-chr6_61774_st bta-chr8_67314_mt bta-chr26_47466_mt bta-let-7a-5p bta-chr27_48098_mt bta-chr17_22515_mt bta-chr10_4492_mt bta-let-7c bta-miR-29d-5p bta-chr24_43233_mt
majority (1882, i.e., 69%) of miRNAs were represented by fewer than 50 isomiRs, and only 4 miRNAs (0.15%) exhibited more than 1000 isomiRs. No correlation between the number of isomiRs and the expression level of miRNAs was observed.
In agreement with the levels of miRNA expression, most isomiRs were found to be expressed at low levels (Additional file 3: Table S12): only 2329 isomiRs (1.2%) exceeded a mean normalized expression of 100 mapped reads in at least one breed, and about 35,785 isomiRs (20%) showed expression levels between 1 and 100 Fig. 8 Correlation networks of negatively correlated miRNAs. Partially oriented correlation networks of miRNA pairs with significant negative
correlations less than − 0.7 (any pair) or less than − 0.5 (any miRNA paired with a miRNA located within its target genes), as drawn by Cytoscape. Nodes are colored according to the mean correlation level (from − 0.5 (light blue) to − 0.9 (dark blue)). Purple arrows indicate correlated pairs made up of a given miRNA (arrow start) and another miRNA located within a target gene of the first (arrow end). Grey edges without arrows indicate that linked miRNA are correlated, without any known functional interaction
reads. The vast majority of isomiRs accounted for only a small proportion of miRNA expression: 167,776 isomiRs (87%) contributed less than 1% to total miRNA expres-sion, while only 2916 isomiRs (3%) from 2445 miRNAs contributed more than 25% of total miRNA expression. Of note, 101 canonical sequences described in miRBase (14% of known expressed miRNAs) were not detected at all in our data. In addition, the defined canonical sequence was found to be the most highly expressed for only 1269 miRNAs (47%), while the most expressed isomiR differed from either the canonical miRNA pub-lished in miRBase or the predicted canonical sequence identified by mirDeep2 in 75% and 46% of cases, respec-tively. For instance, the published canonical form of bta-miRNA-100 (AAC CCG TAG ATC CGA ACT TGTG) accounted for only 10% of the miRNA read count, while bta-miRNA-100 isomiR AAC CCG TAG ATC CGA ACT TGT (deletion of G in 3p) accounted for 30%. Overall, on average the most expressed sequences were found to account for 51% of total miRNA expression, ranging from 7 to 100%. The 20 most expressed isomiRs accounted for 49% of the total isomiR expression and are related to 10 miRNAs, including bta-miRNA-100 (6 isomiRs in the top twenty), the most abundant miRNA in bull sperm cells. On average, isomiRs accounted for 4.5% of the expression for each miRNA, ranging from 0.06 to 100%.
To avoid bias due to sequencing errors (0.1% of sequencing errors may produce up to 30,000 isomiR artifacts), we focused on 14,765 isomiRs accounting for more than 1% of each miRNA’s expression and expressed in at least half of the animals of at least one breed
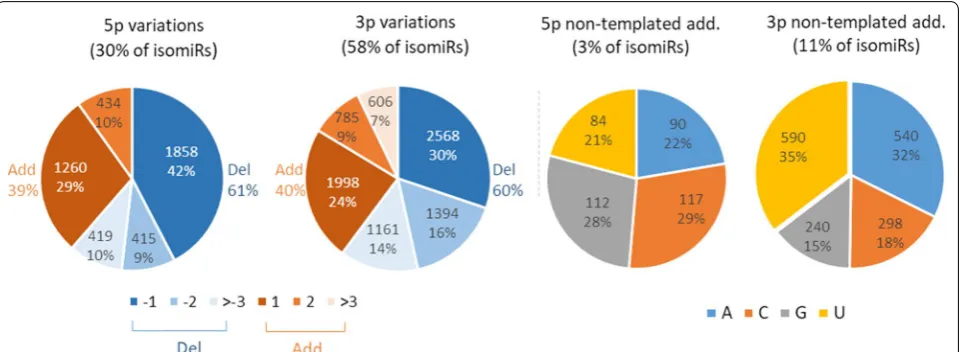
(Additional file 3: Table S13). Production of multiple iso-forms appeared to be a general mechanism, as only 1984 sequences were identified as the canonical miRNAs: 3p, 5p and substitutions within the canonical sequence were detected for 81%, 57% and 77% of miRNAs, respectively. Altogether, 58% and 30% of isomiRs showed changes at their 3p and 5p ends, respectively, while 38% exhibited at least one substitution within the canonical sequence. Single 3p changes and substitutions were the most fre-quent variations (29% and 18% of isomiRs, respectively). About 5% of isomiRs were found to carry both 5p and 3p changes as well as substitutions (Fig. 9b).
As illustrated in Fig. 10, deletions accounted for ~ 60% of variations affecting 5p and 3p ends, with the addition or deletion of one nucleotide representing altogether 71% and 54% of 5p and 3p changes, respectively. Additions were usually consistent with the reference sequence, but 2071 isomiRs (14%) showed a non-templated nucleotide addition at either 5p (403) or 3p (1668) locations. Among them, only 86 substitutions (4%) may result from known genetic polymorphisms (Ensembl release 94). Addition of cytidine (C) or guanosine (G) were observed frequently at 5p (29% and 28%, respectively), whereas addition of adenosine (A) and uridine (U) were the most frequent 3p variations (32% and 35%, respectively).
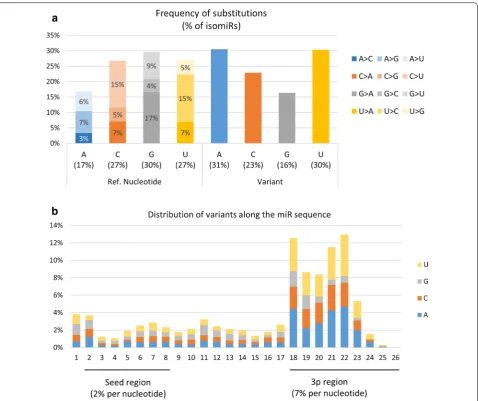
Regarding polymorphic isomiRs, about 6% of varia-tions may be related to known genetic polymorphisms, the remaining 94% likely being produced by miRNA edit-ing. As shown in Fig. 11a, G nucleotides were on aver-age more frequently modified (30% of isomiR counts) than C/U (27%) or A (17%). However, when accounting
for nucleotide usage within miRNAs (i.e., frequency of nucleotides within miRNA sequences), substitutions involving C and U appeared to be 50% and 10% more frequent than expected by chance. In contrast, G sub-stitutions appeared 20% less frequently than expected (Additional file 12: Fig S11). Nucleotides were mainly replaced by A or U (Fig. 11a). Altogether, G>A, U>C and C>U substitutions were the most frequent polymor-phisms, each accounting for ~ 15% of all polymorphisms.
The distribution of variations along the miRNA sequence (see Fig. 11b) clearly showed that substitutions
are more likely to occur within the 3p region (61% of isomiRs, ~ 7% substitution per nucleotide) than the first 5p nucleotide (4%) or the seed region (16% of isomiRs, ~ 2% substitution per nucleotide). Distinct pat-terns of variation were observed when comparing 5p and 3p regions: substitutions at 5p were prone to be G or U nucleotides (33% and 28%, respectively), whereas substi-tutions to A or U nucleotides were observed more fre-quently at 3p (34% and 33%, respectively).
Diversity of sncRNAs across breeds
Differential expression analysis was used to explore the expression patterns of sncRNAs (miR, piRNA, tRNA and rRNA) across breeds (Additional file 3: Table S14). Fig-ure 12 provides, for each sncRNA class, the number of differentially expressed features (adjusted p-value < 0.05) observed for each comparison of breeds.
Many sequences were found to be differentially expressed in each pairwise breed comparison, regard-less of the sncRNA class. The Monbeliarde breed showed the highest number of differentially expressed sncRNAs, whatever the class and breed comparison. For instance, 63 miRNAs and 2089 rRNAs were found to be differentially expressed on average when con-sidering comparisons between the Montbéliarde and other breeds, whereas only 22 and 720 differentially expressed miRNAs and rRNAs, respectively, were iden-tified on average for other comparisons. In contrast, the Belgian Blue vs Charolais as well as the Holstein vs Nor-mand comparisons yielded the smallest number of dif-ferentially expressed sncRNAs, whatever the class. For instance, no differentially expressed miRNAs and only one differentially expressed isomiR could be identified
between Holstein and Normand. Likewise, only a few differential sequences were identified between Belgian Blue and Charolais, with only 8 miRNAs and 4 isomiRs (compared to 15 miRNAs and 76 isomiRs on aver-age). A subset of five miRNA was chosen to perform a biological validation by qRT-PCR: two miRNA chr4_54509 and bta-mir-148b) and two isomiRs (bta-isomir-26a-1_1 and bta-isomir-26a-1_2) differentially expressed between Abondance and Normande breeds, as well as one miRNA differentially expressed between Charolais and Normande (bta-chr16_21053). Five additional bulls, which were not included in the RNA-Seq study, were chosen for each breed. On these five miRNA, three confirm statistically the RNA-Seq results, one showed the same trend but failed to produce a sta-tistically significant result and no differential expres-sion was observed for the last one (Additional file 3: Table S15). Altogether, NGS results were confirmed in 80% of cases (60% with statistical significance).
Consistent with the observed differential expression, breeds could be distinguished by hierarchical clustering on miRNA, with Holstein and Normande being clus-tered close together, while in contrast the Abondance
and Normande breed belong to the most distant clusters (Fig. 13). The Belgian Blue breed appeared to be more diverse, with 2 bulls close to the Charolais breed and 3 bulls close to the Monbeliarde breed.
Noteworthy, breed-specific expression patterns could be observed, with several groups of miRNA being differ-entially expressed between one (or a few) breed and the others. Altogether, about half of differentially expressed miRNA could be associated to such specific patterns. Interestingly, these miRNAs were found to cluster in the previously described correlation networks (Fig. 7), with miRNA having a similar pattern clustering within the same correlation networks, as illustrated by the node color code in each network (Fig. 14). Thus positive corre-lations between miRNA are, at least in part, indicative of coordinated expression in each breed.
Putative targets of differentially expressed known miR-NAs were identified using Targetscan 7.2 and filtered on “weighted context ++ score percentile” (≥ 95%), resulting in a set of 2826 targets used for a gene ontology analysis. Several enriched biological terms were identified, includ-ing animal organ morphogenesis, cell development, ana-tomical structure morphogenesis, and regulation of gene expression. Surprisingly, by focusing on the two most highly enriched terms (organ morphogenesis and cell development), 71% of the annotated genes with signifi-cantly differential expression among breeds were charac-terized by highly specific expression in the Montbéliarde breed compared to another. Moreover, the majority of miRNAs targeting these same genes were found to be under-expressed in the Montbéliarde sperm cells (about 90% of the cases).
Noteworthy, semen quality parameters were shown to vary across breeds, especially parameters related to motility such as curvilinear velocity (VCL, μm/s), amplitude of lateral head displacement (ALH, μm) and progressive motility (%) (Fig. 15 and Additional file 3: Table S16).
Since a previous study reported differentially expressed miRNA and piRNA between high and low
motile spermatozoa [30], association between quality
parameters and breed differentially expressed miRNA and piRNA was assessed. Firstly, among the 196 dif-ferentially expressed sequences described in Capra et al. [30], 156 were also identified in our dataset, cor-responding to 121 different miRNA. On these, 22 (18%) were also differentially expressed between breeds (Additional file 3: Table S17). Then correlations were computed between quality parameters and miRNA/ piRNA expression level in each breed (Additional file 3: Table S18). With only five sample per breed, it was not possible to take inter-individual variation into account and evaluate whether variation among breeds
is larger than individual variation within each breed. Thus, the mean expression level was computed per breed for each miRNA/piRNA and correlations were estimated between the mean expression level and the mean of each functional parameter. When considering parameters related to motility (VCL, ALH, motility), 833 miRNA were found to be correlated to either VCL, ALH, motility, 129 being also differentially expressed between breeds and 91 being differentially expressed in Abondance breed, which shows significant difference in VHL and ALH parameters compared to the other breeds. In addition, 38 miRNA belong to miRNA differ-entially expressed between High and Low motile sper-matozoa identified by Capra et al. [30]. Likewise, 5464 piRNAs were found to be correlated to motility related parameters, 259 being differentially expressed between breeds and 250 being differentially expressed in Abon-dance breed. These piRNA belong to all clusters asso-ciated to High motile (64 clusters) and Low motile spermatozoa (15 clusters) identified by Capra et al. [30].
Discussion
The study of sperm RNAs is challenging, as spermato-zoa harbor low amounts of highly fragmented RNA and are to some extent resistant to lysis using conventional methods. As a consequence, numerous procedures have been developed, often leading to highly variable RNA content and making it difficult to compare between sam-ples or studies, especially across species. In our hands, the published protocols led to partial lysis of cattle sperm (evaluated by microscopic examination) and low RNA yield. In contrast, we were able to reproducibly apply our novel protocol to 40 sperm samples. On average, about 60 ng of total RNA can be recovered from about 30 million spermatozoa (2 straws), i.e., about 2 fg on aver-age per frozen spermatozoa. This is consistent with the published estimate of 5 fg/sperm in swine [46], 2–20 fg/ sperm in stallions [47], and 5–15 fg/sperm in humans [9,
48]. In agreement with previous studies, no 18S and 28S rRNA peaks could be detected by electrophoretic assay, indicative of low contamination by somatic cells [49]. Most importantly, the conditions for RNA extraction and sequencing enabled us to establish a comprehensive rep-ertoire of cattle sperm-borne sncRNA, which could serve as reference for later studies focusing on sperm quality characteristics and fertility.
The overall small RNA content of bull sperm
finding contrasts with Spermbase data, where tsRNA account for more reads than any other sncRNAs. Our findings also agree with previous reports suggesting that piRNAs are highly abundant sncRNAs in sperm [57].
Reads annotated as mRNA (0.4% of reads) represented degraded transcript fragments from 3250 genes, of which a substantial portion is involved in spermatogenesis. This information supports the hypothesis that these mRNA fragments are remnants from earlier stages of spermato-genesis rather than derived from contaminating somatic cells in our preparation.
Though no 18S and 28S rRNA peaks could be detected by electrophoretic assay, about 25% of reads
were annotated as rRNAs, mainly 18S (29%) and 28S (23%) rRNAs. However, consistent with a previous report in humans, they appeared to be fragmented, with particular patterns of peaks and read-poor regions, sug-gesting that this degradation is achieved by a selective
RNA cleavage [20]. Of note, mature spermatozoa are
rRNA fragments may also play a role at fertilization or during zygote development warrants future study.
Together with rRNAs, we identified piRNAs as a major constituent of sperm sncRNAs and observed a great diversity of piRNA-like sequences. In a previous study on cattle gonads, gametes, and embryos, Russel et al. [50] reported a distinct population of slightly shorter, 24–27 nt piRNA-like RNAs exhibiting many of the canonical characteristics of piRNAs but having weak or absent 1U bias. Consistent with these findings, piRNA-like RNAs identified in our study also appeared to be shorter, result-ing mainly from a deletion at either ends. However, we still observed a 1U bias, although weaker than for piR-NAs. No particular expression profile and no associa-tion with particular biogenesis classes could be observed. Thus, with the exception of their length, these piRNA-like RNAs showed all the same features of piRNAs and likely represent isoforms of piRNAs. Recently, different length variations of piRNAs have been discovered in sev-eral studies, and sevsev-eral exonucleases have been found to be required for piRNA end trimming in different species [51–53]. To our knowledge, no bioinformatic resource is yet available for the detection and annotation of piRNA isoforms, with the exception of IsopiRBank [54], which unfortunately does not cover the bovine species. How-ever, consistent with statistics from IsopiRBank and gen-eral mechanisms of RNA editing, we found that length variations at the 3′ end were the most frequent changes affecting piRNA isoforms.
Besides their established role in repressing transpos-able elements and protecting the integrity of the genome in germ cells [55], growing evidence suggests that piR-NAs also function in regulating protein-coding genes in germ cells and early embryo development [56] and play
a role in sperm fertility [57]. A noteworthy result of our study was the overwhelming majority of reads annotated as intergenic-derived piRNAs, with a significant fourfold enrichment compared to the whole piRBase database. In addition, the sperm piRNAs were predominantly 29–31 nt in length; showed preference for uracil at their 5p ter-minus; had no adenine enrichment at nucleotide 10; and appeared to derive from transposons in very small num-ber (only 5%). Altogether, this suggests that the piRNA population identified in bull mature sperm is mainly produced by the PIWIL1-directed production pathway rather than the PIWIL2/PIWIL4-directed secondary pathway in which piRNAs are typically produced from transposons or other repeat-associated regions. This is consistent with previous findings in mice, where studies showed that (i) in contrast to primordial testis, piRNAs are produced in adult testis independent of the
ping-pong mechanism [58]; and (ii) cauda spermatozoa were
enriched in piRNAs apparently derived from the primary PIWIL1-directed production pathway and possibly gen-erated in situ in maturing spermatozoa [7]. Elucidating the role of bull sperm piRNA and piRNA-like in sperm fertility and early embryo development warrants further investigation.
Regarding tsRNAs, we identified 5p-tRHs as the pre-dominant subgroup in bull sperm, in good agreement with results in human, mouse and rabbit sperm data [19]. Altogether, 5p-derived fragments represented 63% of all bull sperm tsRNAs, with tRF3s and 3p-tRHs being
expressed at low levels (30× less expressed than 5p
derived fragments). A similar pattern was also described
in bull sera [59], but with a larger contrast, where
5p-derived fragments were 4000× more expressed than
differences between tissues, as suggested by the exten-sive differences in tRF expression observed between human biofluids [60]. Alternatively, they may also reflect sperm changes in response to stress induced by the cryo-preservation process. Indeed, tRHs are produced by spe-cific cleavage in the anticodon-loop of mature tRNA by angiogenin under various cellular stress conditions, and changes in tRF relative expression have been described under pathological conditions [61]. In addition, oxidative stress has been shown to promote tRNA fragmentation [62], and altered 5p tRHs profiles have been observed in mouse sperm after a high-fat diet [16]. Whether tRFs expression profiles could be relevant biomarkers for sperm quality or bull management will require further work. Unlike many other studies, we identified i-tRFs as the second contributor (18%) to sperm tsRNAs, with more than 84% of these reads being produced by MT tRNAs, a disproportionately high contribution consider-ing that there are only 22 MT tRNA sequences. Similar results have already been described in prostate cancer tumors, where i-tRFs derived from MT tRNAs are par-ticularly abundant [63]. In our data, Gly and Glu isoac-ceptors were predominant in ejaculated bovine sperm cells, in good agreement with results obtained on cauda epididymis sperm cells in mice [64]. Interestingly, these isoacceptors have also been reported as over-represented
in seminal plasma exosomes [65] and epididymosomes
[64], which can transfer their tsRNA content to the sperm [66]. This epididymal cell–sperm communication mecha-nism has been proposed to link the paternal environment (i.e., nutrient availability) to the mature sperm, providing an adaptive metabolic advantage to the offspring [67]. Whether sperm tsRNAs derive from this mechanism or from the intrinsic ability of sperm to cleave tRNA is still unclear. Regarding the biological role of these sperm tsR-NAs, several groups have provided compelling evidence in mice that they are involved in paternal epigenetic inheritance and early embryonic development through modification of embryonic gene expression [64, 68]. For instance, tRF5- Gly-CCC, -TCC, and –GCC were shown to repress MERVL, an endogenous retro-element active in the preimplantation embryo and regulating the expres-sion of genes involved in totipotency and zygote genome
activation [69]. Likewise, tRF- Gly-GCC and
tRF-Glu-TTC were found to be downregulated in human sperm
producing low-quality embryo in vitro [70]. Whether
mis-regulation of some tsRNAs in sperm might contrib-ute to poor sperm quality, abnormal early embryo devel-opment, and reduced fertility in cattle warrants future investigation.
The bull sperm miRnome
Based on miRBAse, we identified 635 miRNAs, increasing by ~ 50% the known miRNA repertoire present in sperm. Indeed, 376 miRNAs have been identified in either human,
mouse or rat sperm according to SpermBase [19], from
which 216 have also been detected in the present study. Our results partly overlap those of previous studies on cat-tle sperm, both in terms of identified miRNAs and expres-sion levels. For instance, 28 out of the 30 most expressed miRNA published by Stowe et al. [71] are also expressed at high levels in the present study, with the exception of bta-miRNA-199a-5p, which is weakly expressed. Likewise, expression levels of 404 shared miRNAs were also in good agreement with those measured by Capra et al. [30] (Addi-tional file 3: Table S19).
Based on miRDeep2, 2022 additional miRNAs were predicted, associated with 1944 pre-miRNAs. Among these predicted miRNAs, 68 were also previously iden-tified by Capra et al., and 5% were covered by both 5p and 3p miRNAs, increasing the likelihood of being true novel miRNAs. Of note, we report numerous known and predicted miRNA expressed at moderate and low levels. Our efficient extraction procedure, as well as the high sequencing depth in our study (35 M reads vs ~ 4.5 M per sample in previous studies), probably accounts for the wider panel of known and novel miRNAs detected in this study. Alternatively, discrepancies between studies may also be explained by different miRBase release versions or the use of different breeds. In particular, about 100 out of the 232 predicted miRNAs published by Capra et al. have been added to the latest miRBase release.
Regarding the genomic location of bovine sperm miRNAs, their distribution appears to be similar to the known distribution of cattle miRNAs published in miR-Base and in good agreement with results in other species [72, 73], showing that miRNAs are frequently located within introns of protein-coding genes.
clusters were not expressed in sperm. Our study thus expands the list of known polycistronic pri-miRNA clus-ters, adding in particular 5 large clusters ranging from 4 to 16 miRNAs. Interestingly, 8 clusters comprise pre-dicted miRNAs alone, and two clusters comprise both known and predicted miRNA, strengthening their likeli-hood to be genuine miRNAs. Surprisingly, many strong positive and negative correlations were also observed between non-clustered miRNA pairs. Such correlations may correspond to regulatory networks, including for instance miRNAs co-regulated by shared regulatory fea-tures (positive correlation), as well as miRNAs hosted by transcripts targeted by other miRNAs (negative cor-relation). Regarding positive correlations, our analysis highlighted 77 correlation networks that mostly gather miRNAs differentially expressed between breeds, sug-gesting that they reflect mainly inter-breed genetic dif-ferences. Regarding negative correlation networks and assuming that intragenic miRNAs are transcribed in parallel with their host transcripts, we also identified putative miRNA–miRNA regulatory networks, encom-passing 41 “master” miRNAs negatively correlated with other miRNAs hosted within their predicted targets. In support of this hypothesis, co-expression of miRNAs and their host genes has already been shown by expres-sion studies [74, 75], as well as eQTL studies that show a substantial fraction of eQTLs shared between intragenic
miRNAs and their host genes [76]. This mechanism is,
however, far from general; many intronic miRNAs pos-sess their own promoter and are transcribed indepen-dently of their hosting genes [77]. Additional data will be required to further explore in cattle whether miRNAs and their host genes are co-expressed, and in vitro trans-fection studies may be helpful in validating some of the putative miRNA–miRNA regulatory networks identified in this study.
A large number and an impressive diversity of isomiRs were also observed, with the number of isomiRs per miRNA varying greatly, ranging from a few up to one thousand. Some miRNA, such as 100, miRNA-146a, miRNA-151-3p, miRNA-143, miRNA-331-3p, 23b, 24, 222 and miRNA-199a-3p, have been proposed to be more prone to varia-tions in human tissues [35]. Interestingly, these miRNAs also display a high number of isomiRs in our data (531 on average, compared to 97 for the whole miRNome). This suggests that common sequence features or con-served molecular mechanisms contribute to the isomiR profile across species. Surprisingly, published canonical sequences were found to be the most expressed in only half of the cases, and 14% of them were not detected at all in our data. Evolution of the criteria used to define
canonical miRNAs throughout time [78], as well as
tissue- and species-specific expression, may account for this situation.
IsomiRs: an underexplored diversity
Focusing on 14,765 relevant isomiRs in terms of expres-sion levels and representation across breeds, 3p varia-tions appeared twice as frequently as 5p variavaria-tions, both in terms of isomiR counts and expression. More than half of isomiRs are produced by a single 3p change (34%) or substitution within the miRNA sequence (21%), while single 5p changes account for only 8% and 38% result from a combination of several changes. These findings are consistent with previous reports, showing for instance that a vast majority of observed miRNA carried changes at their ends, in agreement with the hypothesis of cleav-age variations by either Drosha or Dicer [43]. However, the high frequency of 3p changes, especially deletions, suggests that other mechanisms also contribute to the variation pattern. In particular, crystallographic stud-ies have shown that 5p ends are tethered to Argonaute through multiple interactions and packed within the MID domain, whereas 3p ends may extend from the PAZ domain and may therefore be susceptible to 3′–5′ exonu-cleolytic activities [79]. We also described non-templated nucleotide additions, such as mono uridylation and ade-nylation, especially at 3p ends. This finding is consistent with other studies, showing that post-transcriptional modification of RNA and miRNA by 5p–3p nucleotidyl transferases, especially poly(A) polymerase and termi-nal uridylyl transferases, is a common mechanism, con-served in a variety of species [37, 80]. In cattle sperm, although mono-uridylation and adenylation affect a simi-lar proportion of miRNA (32–35%), mono-uridylation seems to be the predominant mechanism, accounting for 34% of expression of isomiRs carrying 3p non-templated additions, compared to only 25% for mono adenylation.
Consistent with these data, our results showed an ele-vated frequency of C > U changes, the C substitution being 50% more frequent than expected based on nucleo-tide usage within miRNA sequences. A > G substitutions were also observed at lower frequency, suggesting that cytosine deamination is more frequent in bull sperm than adenine deamination. In our data, G > A and U > C transi-tions were observed at similar frequencies as A > G and C > U transitions. This suggests that in addition to clas-sic A > I and C > U editing events, some other molecular mechanisms also significantly shape the sperm miRnome, making the editing paradigm much more complicated than initially thought. In line with our results, G > A and U > C changes have been reported in B lymphocytes [81], and G > A editing of WT1 transcripts has been associated with the APOBEC3A protein, a member of the APOBEC/ ADAR protein family [82]. Interestingly, APOBEC3A has been shown to be expressed at high levels in mouse sperm
heads [19] as well as human sperm, with upregulation
between sperm achieving pregnancy and those that do not in intrauterine insemination [83]. Whether the rela-tive frequency of classic vs non-classic editing in sperm may also be associated with APOBEC3A and impact bull fertility in cattle warrants future investigation. Further-more, ADAR A > I editing has been previously described as the major driver of seed polymorphisms in the mouse brain, accounting for about 40% of changes within the seed [84]. This finding seems to be far from general, and in bull sperm G > A and C > U transitions are the most frequent changes within the seed. Polymorphisms within the seed and 5p variations together account for only 24% of isomiR expression. However, since polymorphisms as well as the seed region shift due to 5p variation may
change the set of target mRNAs [39], these changes
may be of functional importance, especially for isomiRs accounting for a large proportion of miRNA expression (e.g., 74 isomiRs polymorphic within the seed as well as 94 5p isomiRs having a relative expression above 50%). Overall, our findings on bull sperm support the notion that the diversity of expressed isomiRs should be consid-ered instead of focusing on canonical miRNAs [78].
Diversity of sncRNA profiles among breeds
Many sequences belonging to all sncRNA classes showed breed specific expression patterns ad were found to be differentially expressed between breeds. For instance, the Abondance and Monbeliarde breeds showed the high-est number of differentially expressed sncRNAs, what-ever the sncRNA class and the breed comparison, while only a few differential sequences could be identified between Holstein and Normande. The origin of these dif-ferences remains elusive and several hypothesis can be drawn. Indeed, breeds in this study differ in many aspects
including genetic background (breed effect), local envi-ronment, nutrition and management, many of which may influence gene expression, making it difficult to decipher the breed and environment effect.
Consistent with a genetic origin of miRNA and piRNA differential expression between breeds, we observed changes in miRNA and piRNA expression according to sperm production parameters, which are under genetic control and are known to differ between breeds. In par-ticular, Abondance bulls showed significant differences for motility related parameters and a large number of miRNA (833) and piRNA (5464) were found to be asso-ciated with these parameters, including miRNA [87] and piRNA (250) differentially expressed between Abondance and other breeds. Interestingly, a previous study already reported differentially expressed miRNA and piRNA
between high and low motile spermatozoa [30]. About
25% of these miRNAs and 13% of piRNA located in these piRNA clusters were shown to be also associated with motility parameters in this study. This apparently low overlap between studies may result either from low sta-tistical power or from physiological differences. Indeed Capra et al. compared two populations of high/normal and extremely low motile spermatozoa (i.e., VCL 100 vs 50 µm/s, ALH 3 vs 2.15 µm, Motility 48 vs 3.8%), whereas our study analyzed semen in a normal range of variation (i.e., VCL 280-150 µm/s, ALH 10-6 µm, Motility 90-25%).
Alternatively, environmental conditions may also influ-ence sncRNA expression. In this respect, it is worth to note that Holstein and Normande bulls, which were housed in the same semen production center, also showed the lowest number of differentially expressed sncRNAs. Likewise, Charolais and Abondance bulls were housed in the same center and cluster close together based on miRNA expression despite differences in terms of semen functional parameters.
Disentangling genetic and environmental effect will require a large number of bulls form several breeds to be raised altogether in the same semen production center to evaluate the breed effect, and to duplicate this design in several semen production center to measure the environ-mental effect.
Methods
Semen collection
following the routine protocol. Freshly ejaculated semen was diluted in egg yolk extender (Optidyl, IMV Technol-ogies) before freezing using the DigitCool program (IMV Technologies).
Total RNA isolation
Two straws per ejaculates (30–40 million sperm cells) were thawed and pooled for RNA extraction. Sperm quality was assessed after thawing using IVOS (Hamilton Thorne Inc) and flow cytometry (Easycyte 6HT, Guava Technologies Inc). Motility, kinetics, viability, mitochon-drial potential activity and oxidation sensitivity were measured. A search for somatic cells was also performed using both visual examination under microscope (count-ing about 1000 sperm cells/sample) and flow cytometry (forward- and side- scatters), showing that contamination was below detectable levels. Remaining seminal plasma and extender were removed by washing the semen twice in 1 ml of Phosphate Buffered Saline solution (PBS), fol-lowed by centrifugation 5 min at 2400×g.
RNA extraction was performed according to an optimized guanidinium–Trizol total RNA extraction protocol, based on a guanidinium thiocyanate–phenol– chloroform extraction protocol [85]. Sperm pellets were homogenized in 100 µl of RLT buffer (Qiagen) supple-mented with 1 µl beta-mercaptoethanol and incubated 15 min at room temperature. Then, 1 ml of Trizol (Inv-itrogen) was added and samples were incubated 5 min at room temperature. Complete lysis was ascertained by microscopic examination of 10 µl aliquots. After addi-tion of 100 µl of chloroform and vigorous shaking for 15 s, samples were incubated 2 min at room temperature and centrifuged at 12,000×g during 15 min at 4 °C. The aqueous phase was transferred to a new collection tube and mixed with 100 µl of chloroform by vigorous shak-ing. After incubation for 2 min at room temperature and centrifugation at 12,000×g during 15 min at 4 °C, the aqueous phase was recovered and nucleic acids were precipitated overnight at − 20 °C using 1 volume of iso-propanol supplemented with 25 µl glycogen (Ambion AM9510, 5 mg/ml). After centrifugation at 12,000 g dur-ing 15 min at 4 °C, pellets were washed with 75% ethanol and dried under vacuum. Dried pellets were then re-sus-pended in 12 µl of RNase free water and incubated 1 h at 4 °C before quality control assessment.
RNA quality controls and sequencing
RNA concentration was assayed using the Qubit® Fluo-rometer (Molecular Probes by Life Technologies) using
the Qubit® RNA HS Assay Kits (Q32852 Molecular
Probes), according to the manufacturer’s recommen-dations. During protocol development, quality and
concentration were also evaluated by electrophoretic assays on an Agilent Bioanalyzer 2100, using standard procedures.
In addition, RT-qPCR was used to quantify the expres-sion of miRNA-125b-5p, which has been shown to be highly expressed in sperm [41]. Total RNAs (5 ng) were reverse transcribed in 10-μl reactions using the
miR-CURY LNA™ Universal RT microRNA PCR Starter kit
(Exiqon). RNA spike-in control (Usp6) was also added during the RT-step. Triplicates were assayed in 10-μl qPCR reactions following the miRCURY LNA kit proto-col, using a StepOnePlus Real time PCR System (Applied biosystems). Amplification curves were analyzed using the StepOne software v2.3 both for determination of Ct values and for melting curve analysis.
Library preparation and sequencing was done by the Exiqon service provider. Briefly, miRNA libraries were
constructed using the NEBNext® Multiplex Small RNA
Library Prep Set for Illumina® kit, including a size selec-tion and quality control by Bioanalyzer. Deep sequencing was performed on Illumina HISeq2000, targeting 40 M single-reads (50 bp) per sample.
Sequence analysis
Low-quality sequences were removed and adaptors were trimmed (Cutadapt). Sequences shorter than 17 nt were filtered and remaining sequences were then grouped by unique sequences to obtain total read counts for each.
A workflow mostly based on miRDeep2 [86, 87] was
used to identify and quantify known as well as predicted miRNAs. The unique sequences were mapped to the reference bull genome (Btau8, UMD3.1.1). Precursors and miRNAs were identified using the miRDeep2 core module, miRDeep2.pl. Potential miRNA datasets were created by adding known miRNA in bull (miRBase v22, March 2018) to miRNA associated with predicted pre-cursors with a miRDeep2 score ≥ 0. The same operation was performed to create a data set of potential precur-sors. The quantifier.pl miRDeep2 module was then used to map unique reads, the set of potential miRNAs and all known miRNAs (miRBase v22) on the set of poten-tial precursors enabling the annotation of miRNAs. The quantification results produced by the quantifier.pl mod-ule were then filtered with a custom perl script “parse_ miRDeep2_outputs.pl” (https ://githu b.com/Smart BioIn f/PAQmi R) to eliminate any redundancy between known and predicted miRNAs.