RESEARCH
PRC2 is required for extensive
reorganization of H3K27me3 during epigenetic
reprogramming in mouse fetal germ cells
Lexie Prokopuk
1, Jessica M. Stringer
1, Kirsten Hogg
1, Kirstin D. Elgass
2and Patrick S. Western
1*Abstract
Background: Defining how epigenetic information is established in the germline during fetal development is key to understanding how epigenetic information is inherited and impacts on evolution and human health and disease. Results: Here, we show that Polycomb Repressive Complex 2 is transiently localized in the nucleus of mouse fetal germ cells, while DNA methylation is removed from the germline. This coincides with significant enrichment of tri-methylated lysine 27 on histone 3 near the nuclear lamina that is dependent on activity of the essential PRC2 catalytic proteins, Enhancer of Zeste 1 and/or 2.
Conclusions: Combined, these data reveal a role for Polycomb Repressive Complex 2 and trimethylated lysine 27 on histone 3 during germline epigenetic programming that we speculate is required to repress target sequences while DNA methylation is removed.
Keywords: Epigenetics, Germ cells, Epigenetic reprogramming, Histone modifications, H3K27me3
© The Author(s) 2017. This article is distributed under the terms of the Creative Commons Attribution 4.0 International License (http://creativecommons.org/licenses/by/4.0/), which permits unrestricted use, distribution, and reproduction in any medium, provided you give appropriate credit to the original author(s) and the source, provide a link to the Creative Commons license, and indicate if changes were made. The Creative Commons Public Domain Dedication waiver (http://creativecommons.org/ publicdomain/zero/1.0/) applies to the data made available in this article, unless otherwise stated.
Background
The sperm and oocyte convey epigenetic information to the offspring that is essential for development and post-natal life. To ensure that appropriate epigenetic infor-mation is transmitted, germ cells undergo extensive reprogramming during fetal development. This allows existing parent-specific information to be reset and potential epigenetic errors to be removed from the ger-mline. The most evident change during germline epige-netic reprogramming is the extensive removal of DNA methylation between embryonic day (E) 8.0 and E13.5, after which new DNA methylation is established in the male and female germlines in a sex-specific manner. Removal of germline DNA methylation occurs during two developmental stages. The first occurs during prolif-eration and migration of germ cells in the early embryo and involves reduction of DNA methylation levels from
70 to 30% [1]. This is followed by further reductions in DNA methylation as the germ cells enter the developing gonads and initiate sex-specific development. Combin-ing this extensive epigenetic reprogrammCombin-ing results in global DNA methylation levels of ~14 and 7% in male and female germ cells at E13.5, respectively [1].
During this later period of reprogramming, DNA methylation is removed from imprint control regions (ICRs) of maternally and paternally imprinted genes, non-imprinted genes, intergenic and intronic sequences, and from the inactive X-chromosome in XX germ cells [2]. DNA methylation is also lost from many endogenous retroviral elements (ERVs), although relatively new ERVs are protected and retain relatively high levels of DNA methylation [1–6].
In addition to DNA demethylation, germline repro-gramming involves extensive reorganization of histone modifications [7, 8]. At E8.5, dimethylated lysine 9 on histone 3 (H3K9me2) is exchanged for trimethylated lysine 27 on histone 3 (H3K27me3), which is maintained in the germ cell nucleus until at least E12.5 [9], although
Open Access
*Correspondence: patrick.western@hudson.org.au
1 Department of Molecular and Translational Science, Centre for Genetic Diseases, Hudson Institute of Medical Research, Monash University, Clayton, VIC 3168, Australia
transient loss of H3K27me3 has been reported at E11.5 [7].
H3K27me3 is catalyzed by Polycomb Repressive Com-plex 2 (PRC2) and leads to epigenetic repression of target sequences. PRC2 is comprised of three core com-ponents: Enhancer of Zeste 1 or 2 (EZH1 and EZH2); Suppressor of Zeste 12 (SUZ12); and Embryonic Ecto-derm Development (EED). While EZH2 is the primary catalytic component of PRC2 [10–12], EED is critical for physically binding H3K27me3 via five tandemly repeated WD motifs, thereby playing an essential role in PRC2 assembly [13, 14]. Inactivation of any one of the three core PRC2 protein subunits severely compromises the functional activity of the complex and results in the loss of H3K27me3. Complete loss of PRC2 function in mice is embryonic lethal [15–17], while low function (hypo-morphic) mutations [18, 19] or tissue-specific deletion leads to growth and skeletal malformations [20], heart and immune cell defects [21] and increased susceptibil-ity to tumorigenesis [22]. Conditional deletion of Eed in the male germline from around birth results in complete male infertility demonstrating an essential role for PRC2 in male germline development [23]. Although deletion of
Ezh2 in growing oocytes is compatible with normal fertil-ity, offspring are born underweight, indicating that PRC2 acts as a maternal factor in oocytes [24]. However, PRC2 is required for germline development in Drosophila
oocytes, where it regulates cell cycle progression during oocyte specification [25]. Moreover, PRC2 is required in the Caenorhabditis elegans germline to regulate the bal-ance between H3K27me3 patterning catalyzed by MES 2, 3 and 6 (C. elegans PRC2), and MES4 which catalyzes H3K36me3 [26]. Despite these observations, the function of PRC2 in male and female in mammalian fetal germ cells remains unknown.
H3K27me3 is enriched at the promoter regions of many PRC2 target genes and plays an essential role in cell differentiation [27, 28]. In fetal germ cells, H3K27me3 is enriched at developmental genes [29–31] and is also enriched on nucleosomes that are retained at the pro-moters of developmental genes in mature sperm, indicat-ing that PRC2 may regulate epigenetic information that is transmitted to offspring [32–34].
In this study, we identify a key period of transient PRC2 enrichment in gonadal germ cells as they undergo epi-genetic reprogramming. Moreover, we demonstrate that PRC2 is required for significant transient enrichment of H3K27me3 near the nuclear lamina, specifically dur-ing the developmental period in which germline DNA methylation levels are at their lowest. We propose that PRC2 and H3K27me3 are required for epigenetic repro-gramming in fetal germ cells and may provide a tran-sient mechanism that protects certain sequences from
aberrant expression during the period of reduced DNA methylation in the developing germline.
Results
H3K27me3 is highly enriched in fetal germ cells undergoing epigenetic reprogramming
Initially, we used quantitative flow cytometric analy-ses to determine the overall cellular levels of H3K27me3 in E11.5, E13.5 and E15.5 male and female germ cells as they undergo epigenetic reprogramming. Germ cells were identified based on germ cell-specific expression of an Oct4-eGFP transgene [35–38] (Fig. 1A). At E11.5, XX and XY germ cells contained high levels of H3K27me3 (Fig. 1A, B), with no evidence in either sex of a germ cell population in which H3K27me3 was low or negative (Fig. 1B). Relative to E11.5 germ cells, H3K27me3 levels were moderately reduced in E13.5 germ cells of both sexes and then maintained until E15.5 (Fig. 1A). At all stages, germ cells contained substantially higher H3K27me3 levels than the gonadal somatic cells, which maintained relatively constant, lower levels of H3K27me3 (Fig. 1A). No H3K27me3 staining was detected in oocytes in which
Eed had been conditionally deleted through expression of
Zp3-Cre, confirming that the H3K27me3 antibody used specifically detects H3K27me3 (Additional file 1: Fig. S1).
PRC2 is transiently expressed in fetal germ cells undergoing epigenetic reprogramming
H3K27me3 is enriched near the nuclear lamina in fetal germ cells undergoing epigenetic reprogramming
Consistent with previous studies [7, 9, 39], H3K27me3 was detected relatively uniformly throughout the nucleus of E10.5 XX and XY germ cells (Fig. 5a). Although
H3K27me3 was readily detected in E11.5 XX and XY germ cells, it was enriched close to the nuclear lamina, with little or no staining detected in the center of the nucleus (Fig. 5a). By E12.5, H3K27me3 staining was more obviously localized near the nuclear lamina in both XX XX Gonadal cells
Germ cells
Somatic cells
Alex
a4
88
Forward scatter
XX Germ cells
Forward scatter
Alex
a6
47
XX Somatic cells
Forward scatter
H3K27me3
XY Gonadal cells
Germ cells
Somatic cells
Alex
a4
88
Forward scatter
XY Germ cells
Forward scatter
Alex
a
647
XY Somatic cells
Forward scatter
H3K27me3
E11.5 flow cytometry
Relative
intensit
y
0 10000 20000 30000 40000
A
B (i)
(ii)
a
b
c c
c c
d
Germ cells Male Female
Somatic cells Male Female H3K27me3
Fig. 1 H3K27me3 is highly enriched in E11.5–E15.5 XX and XY germ cells. A Relative H3K27me3 antibody fluorescence intensities were measured using flow cytometry of dissociated and stained male (XY) and female (XX) fetal gonads at E11.5, E13.5 and E15.5. Germ cells were separated from
somatic cells based on Oct4-eGFP expression (shown in B) and average ± SEM H3K27me3 levels measured in each population (n= 4). B Flow
cyto-metric scatter plots showing gating of Oct4-eGFP positive germ cells and Oct4-eGFP negative somatic cells in XY (i) and XX (ii) E11.5 fetal gonads.
E10.5
E11.5
E12.5
E13.5
E15.5
DAPI GFP EED EED
Male (XY)
DAPI GFP EED EED
Female (XX)
Fig. 2 EED is enriched in E11.5–E12.5 male and female germ cells. Confocal images of EED immunofluorescence in sections of XX and XY E10.5–
E11.5 bipotential gonad and E12.5–E15.5 developing ovaries and testes. Left panels are merged images: eGFP marking germ cells (green), EED (red)
and DAPI nuclear stain (DNA; blue). Right panels are single-channel grayscale images showing EED staining. White arrowheads indicate Oct4
DAPI GFP EZH2 EZH2
E13.5
E15.5
DAPI GFP EZH2 EZH2
E10.5
E1
1.5
E12.5
Male (XY)
Female (XX)
Fig. 3 EZH2 protein is enriched in the nucleus of E11.5–E15.5 male and female germ cells. Confocal images of EZH2 immunofluorescence in
sec-tions of XX and XY E10.5–E11.5 bipotential gonad and E12.5–E15.5 developing ovaries and testes. Left panels are merged images: eGFP marking
germ cells (green), EZH2 (red) and DAPI (DNA; blue). Right panels are single-channel grayscale images showing EZH2 staining. White arrowheads
DAPI GFP SUZ12 SUZ12
E10.5
E1
1.5
E12.5
E13.5
E15.5
DAPI GFP SUZ12 SUZ12
Male (XY)
Female (XX)
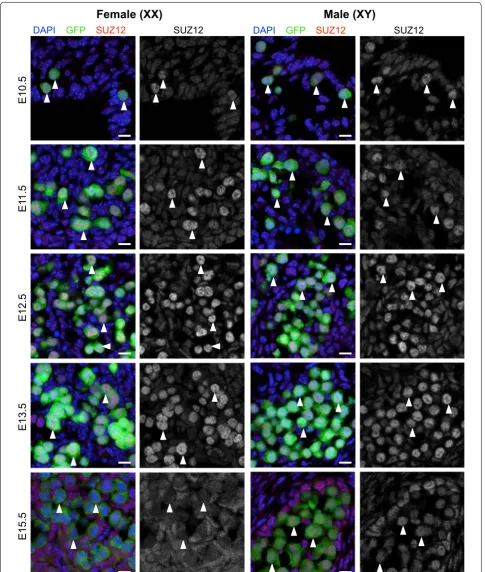
Fig. 4 SUZ12 is enriched in the nucleus of E10.5–E13.5 male and female germ cells. Confocal images of SUZ12 immunofluorescence in sections of
XX and XY E10.5–E11.5 bipotential gonad and E12.5–E15.5 developing ovaries and testes. Left panels are merged images: eGFP marking germ cells
in green, SUZ12 (red) and DAPI (DNA; blue). Right panels are single-channel grayscale images showing SUZ12 staining. White arrowheads indicate
and XY germ cells. H3K27me3 nuclear staining remained enriched close to the nuclear lamina in XX and XY germ cells at E13.5, but by E15.5 H3K27me3 was distrib-uted throughout the nucleus in a pattern similar to that observed in E10.5 germ cells (Fig. 5a).
To quantify the proportion of germ cells that under-went a change from staining throughout the nucleus (uniform nuclear localization; UNL) to staining located toward the nuclear lamina (peripheral nuclear localiza-tion; PNL), we assessed the proportions of cells that had UNL and PNL at E10.5, E11.5, E12.5 and E15.5 in male and female gonads based on confocal images. At E10.5, H3K27me3 staining conformed to the UNL pattern in 75/90% of XX and XY germ cells (Fig. 5b). However, at E11.5 this pattern was significantly different, with 85/95% cells with H3K27me3 staining in the PNL pat-tern in XX and XY germ cells, and this patpat-tern was main-tained in E12.5 XX and XY germ cells. However, by E13.5 H3K27me3 staining returned to the UNL pattern in around 40% of XY germ cells but not in XX germ cells. By E15.5, 90/94% of XX and XY germ cells contained UNL, rather than PNL localization (Fig. 5b).
To obtain greater resolution mapping of H3K27me3 localization in developing germ cells, we performed immunofluorescent super-resolution dSTORM imaging of H3K27me3 in E10.5, E11.5, E12.5 and E15.5 germ cells. Consistent with our observations using confocal imaging, H3K27me3 was distributed throughout the nucleus in both XX and XY germ cells at E10.5 (Fig. 6). This pattern changed dramatically at E11.5, with H3K27me3 located in a broadband around the periphery of the nucleus and by E12.5 H3K27me3 was typically detected in a relatively tight band around the nuclear periphery (Fig. 6). Remark-ably, by E15.5 this pattern had completely reverted, and H3K27me3 was again localized throughout the nucleus in both XX and XY germ cells (Fig. 6). At this stage, XX and XY germ cells either have entered meiotic prophase or are mitotically arrested, respectively [36–38, 40–42].
To quantify the distribution of H3K27me3 located from the center to the outer edge of the nuclei of E10.5, E11.5, E12.5 and E15.5 germ cells, we developed an expanding circular quantification algorithm to measure blink intensity in the super-resolution images. Briefly, H3K27me3-derived pixels were counted in concentric circles increasing in 0.1 μm increments from the center of each nucleus to the nuclear lamina. At E10.5, H3K27me3 staining detected by dSTORM imaging was evenly dis-tributed from the center of the nucleus to the nuclear lamina (Fig. 7). However, at E11.5 and E12.5 this pattern was strikingly different, with almost all enrichment for H3K27me3 staining located within 0–2 μm of the nuclear lamina in both sexes (Fig. 7). By E15.5, H3K27me3 was evenly distributed from the center of the nucleus to the nuclear lamina (Fig. 7). This confirmed a highly sig-nificant change in H3K27me3 from the UNL pattern at E10.5 to the PNL pattern during E11.5–E13.5 and again to the UNL pattern at E15.5.
EZH1/2 is required for H3K27me3 enrichment near the nuclear lamina in fetal germ cells undergoing epigenetic reprogramming
Our examination of EED, EZH2 and SUZ12 protein expression revealed that all three core PRC2 proteins were present in XX and XY germ cells between E11.5 and E12.5, coincident with the enrichment of H3K27me3 near the nuclear lamina (Figs. 2, 3, 4; Table 1). To determine whether PRC2 function was required for H3K27me3 enrichment near the nuclear lamina dur-ing this period of germ cell development, we blocked EZH1/2 function using the highly specific EZH1/2 inhibitor GSK126 [43]. Initially, we validated the ability of GSK126 to block enrichment of H3K27me3 in germ cells. E11.5 whole gonad–mesonephros complexes were isolated from developing XX and XY embryos and cul-tured for 48 h on an organ culture membrane in medium containing increasing doses of GSK126 or vehicle con-trol (DMSO). Flow cytometric analysis of GSK126 and control-treated gonads confirmed that GSK126 dose-dependently reduced H3K27me3 levels in germ cells in a 48-h period (Additional file 1: Fig. S2A). GSK126 was very well tolerated in these cultures, with even the high-est dose having no effect on germ cell viability (Addi-tional file 1: Fig. S2B). Moreover, we observed no impact on proliferation of either germ cells or somatic cells after 48-h treatment from E11.5 (Additional file 1: Fig. S2C, males shown). Similarly, in E12.5 fetal gonads cultured with 10 μm GSK126 for 72 h, germ cells entered mitotic arrest normally and somatic cell proliferation was nor-mal, both in the Sertoli cell compartment and in the interstitial compartment (Additional file 1: Fig. S2D). This provided high confidence that GSK126 was well
Table 1 Relative staining intensities for PRC2 proteins in E10.5–E15.5 germ cells
E10.5 E11.5 E12.5 E13.5 E15.5
Female XX
EED – ++ +++ – –
EZH2 – ++ ++ ++ ++
SUZ12 + ++ +++ +++ –
Male XY
EED – ++ +++ ++ –/+ Cyto
EZH2 –/+ ++ +++ +++ +++
E10.5
E1
1.5
E12.5
E13.5
E15.5
Male (XY)
Female (XX)
a
b
H3K27me3 H3K27me3
DAPI GFP
H3K27me3 H3K27me3DAPI GFP
Embryonic day (E
)
E15.5 E13.5 E12.5 E11.5 E10.5
Female: E10.5-E15.5
% Cells
0 50 100
Male: E10.5-E15.5
% Cells
UNL
PNL
0 50 100
Female (XX)
Merge (wide-field) dSTORM
E10.5
E11.5
E12.5
E15.5
Merge (wide-field) dSTORM
GF
P
H3K27me3
GF
P
H3K27me3
GF
P
H3K27me3
GF
P
H3K27me3
E10.5
E11.5
E12.5
E15.5
Male (XY)
Fig. 6 H3K27me3 is transiently relocated to the germ cell nuclear periphery in E11.5–E13.5 male and female germ cells. dSTORM super-resolution
images in sections of XX and XY E10.5–E11.5 bipotential gonad and E12.5–E15.5 developing ovaries and testes. Left panels are merged wide-field
(×160) images: eGFP marking germ cells (green), and H3K27me3 (red). White dotted boxes indicate super-resolved germ cell. 10 μm scale bars. Right
panels dSTORM super-resolution of H3K27me3 antibody (grayscale). 1 μm scale bars. Representative images chosen from 3 to 8 super-resolved
images in three biological replicates for each time point (See figure on previous page.)
Fig. 5 H3K27me3 is enriched in the nucleus of E10.5–E15.5 male and female germ cells. a Confocal images of H3K27me3 immunofluorescence in
sections of XX and XY E10.5–E11.5 bipotential gonad and E12.5–E15.5 developing ovaries and testes. Left panels are merged images: eGFP
mark-ing germ cells in green, H3K27me3 (red) and DAPI (DNA; blue). Right panels are single-channel grayscale images showing H3K27me3 staining. White
arrowheads indicate Oct4-eGFP-expressing germ cells. Representative images chosen from 3 to 4 biological replicates for each time point. 10 μm
scale bars. b Quantification of H3K27me3 localization in E10.5–E15.5 male and female germ cells from wild-type fetal testis and ovary sections.
Percentages of cells with uniform nuclear localization (UNL; black bars) and peripheral nuclear localization (PNL; gray bars) analyzed using ImageJ Cell
Counter are shown in the stacked histogram. Data represent 3–6 biological replicates for each sex, at each stage (XX/XY cells counted: n= 16/19 at
Male E10.5-E15.5
-1.0 0.0 1.0 2.0 3.0 4.0 5.0 6.0
0.0 1.0 2.0 3.0 4.0 5.0
E10.5 E11.5 E12.5 E15.5
Relative H3K27me3 intensity
Relative H3K27me3 intensity
Radial distance (μm)
Radial distance (μm)
Female E10.5-E15.5
-1.0 0.0 1.0 2.0 3.0 4.0 5.0 6.0 7.0
0.0 1.0 2.0 3.0 4.0 5.0
E10.5 E11.5 E12.5 E15.5
Fig. 7 H3K27me3 is significantly enriched near the nuclear lamina in fetal germ cells undergoing epigenetic reprogramming. Radial histogram quantification of H3K27me3 localization of dSTORM super-resolution immunofluorescent images in wild-type male and female germ cells E10.5
(blue), E11.5 (green), E12.5 (pink) and E15.5 (yellow). Left image of each colored panel (×160) represents merged channels, green marking germ cells
(eGFP), and H3K27me3 (red). 10 μm scale bars. Right-hand image of each panel shows dSTORM super-resolution images of germ cells (H3K27me3 in
grayscale). 1 μm scale bars. Data represent 3–8 super-resolved images from three biological replicates. The Y-axis shows relative H3K27me3 intensity,
tolerated in fetal gonad cultures and demonstrated highly efficient, GSK126-dependent, depletion of H3K27me3 in germ cells within the 48- and 72-h culture periods.
We next blocked EZH1/2 activity in E11.5 fetal gonads cultured with GSK126 for 48 h. Confocal imaging and analysis of H3K27me3 staining intensity using ImageJ demonstrated that H3K27me3 was reduced by 75 and 73% in germ cells of GSK126-treated male and female gonads compared to the germ cells of male and female control-treated gonads, respectively (P < 0.0001; Addi-tional file 1: Fig. S3, Fig. 8a). Moreover, while H3K27me3 was detected in the periphery of the germ cell nucleus in control gonads, it was detected throughout the germ cell nucleus in GSK126-treated gonads (Fig. 8a), indi-cating a failure of this epigenetic mark to be enriched near the nuclear periphery when EZH1/2 function was blocked. Quantification of UNL and PNL staining revealed PNL staining in 89/75% of XX and XY germ cells in gonads treated with vehicle control, but only 15/4% in XX and XY germ cells of gonads treated with GSK126 for 48 h (Fig. 8c). To obtain a higher-resolution analysis of H3K27me3 localization in GSK126-treated germ cells, we performed super-resolution imaging on the same GSK126-treated and control gonads. In control-treated gonads, H3K27me3 staining was restricted to the periphery of the germ cell nucleus (Fig. 8b) in a pattern that was very similar to that observed in vivo in wild-type E12.5 germ cells (Fig. 6). However, in GSK126-treated gonads, remaining H3K27me3 was distributed through-out the germ cell nucleus (Fig. 8b) in a pattern that was indistinguishable from that observed in vivo at E10.5 and E15.5 (Fig. 6). Quantitative analysis of the localiza-tion of this staining demonstrated that the remaining H3K27me3 in germ cells of GSK126-treated gonads was evenly distributed throughout the nucleus and was not different from the pattern detected in untreated E10.5 and E15.5 germ cells. H3K27me3 was not enriched near the nuclear periphery of germ cells in GSK126-treated gonads, and its distribution was significantly differ-ent from the H3K27me3 enrichmdiffer-ent observed near the
nuclear lamina in normally developing E11.5 and E12.5 germ cells (Fig. 9). Interestingly in XY control gonads cultured for 48 h, H3K27me3 staining extended to ~3 μm from the nuclear periphery but was absent or low in the center of the nucleus. This pattern was comparable to the staining pattern observed by confocal micros-copy in many E13.5 XY germ cells (Fig. 5b), indicating that H3K27me3 had already begun to relocate through-out the nucleus of control-treated gonads. We therefore examined XY gonads cultured for 24 h with control and GSK126 medium (Additional file 1: Fig. S4A). H3K27me3 levels were reduced by 57% in samples treated with GSK126 for 24 h compared to controls (P < 0.0001; Addi-tional file 1: Fig. S4B). Quantification of UNL and PNL staining in confocal images revealed PNL staining in 85% of XY germ cells in gonads treated with vehicle control, but only 20% in XY germ cells of gonads treated with GSK126 for 24 h (Additional file 1: Fig. S4C). Super-res-olution imaging of germ cells in these gonads revealed peripheral staining of H3K27me3 in control gonads and complete loss of peripheral staining in GSK126-treated gonads (Additional file 1: Fig. S5).
H3K27me3 enrichment is associated with the repres-sion of many developmentally important genes, perhaps most notably the Hox genes. To identify genes for which depletion of H3K27me3 enrichment might alter expres-sion, we treated male E12.5 fetal gonads for 72 h with GSK126. This covers a period during which many devel-opmental genes are highly regulated in germ cells as they undergo early male germline differentiation. Initially, we confirmed efficient depletion of H3K27me3 using flow cytometric analysis of 10% of the gonadal cells collected for the GSK126 and vehicle control-treated cultures (Fig. 10a). This revealed an 80% decrease in H3K27me3 in germ cells isolated from GSK126-treated gonads compared to gonads treated with vehicle control. The remaining 90% of cells from the cultured gonads were subject to fluorescence-activated cell sorting (FACS), allowing purification of the germ cells and global expres-sion analysis using microarrays. Surprisingly, analysis of
(See figure on next page.)
Fig. 8 Transient enrichment of H3K27me3 near the nuclear lamina is lost when EZH1/2 is blocked. Confocal and dSTORM super-resolution
images of immunofluorescence staining at E11.5 XX and XY gonads cultured for 48 h with either DMSO (control) or 10 μm GSK126. a Confocal
images (×80) showing efficacy of H3K27me3 depletion by GSK126, eGFP (germ cells; green) and H3K27me3 (red). 10 μm scale bars. The reduction
in H3K27me3 in GSK126-treated samples is quantified in Supp. Figure 3. b Super-resolution dSTORM images. Left panels show merged wide-field
(×160) images: eGFP (germ cells: green) and H3K27me3 (red). White dotted boxes indicate super-resolved germ cells. 10 μm scale bars. Right panels
show dSTORM super-resolution images of H3K27me3 (grayscale) control and GSK126-treated germ cells. 1 μm scale bars. Representative images
chosen from 3 to 5 super-resolved images in three biological replicates for each time point. c Quantification of H3K27me3 localization in E11.5 XX
and XY gonads cultured for 48 h with either DMSO (control) or 10 μm GSK126. ×80 confocal immunofluorescent images were analyzed by ImageJ
Cell Counter. Percentages of cells with uniform nuclear localization (UNL; black bars) and peripheral nuclear localization (PNL; gray bars) are shown
in the stacked histogram. Data represent 3–6 biological replicates for each sex, for each treatment group. (XX/XY cells counted: vehicle control
E11.5 + 48 h culture
DMSO
Male: E11.5 +48h
% Cells GSK126
0 50 100
DMSO
Female: E11.5 +48h
% Cells GSK126
0 50 100
UNL
PNL
GSK126
Contro
l
Female (XX)
GSK126
Contro
l
Confocal
a
b
c
Super-resolution
Wide-field dSTORM
X80
GFP
H3K27me3
GFP
H3K27me3
Male (XY)
Female E11.5 +48h
-1.0 0.0 1.0 2.0 3.0 4.0 5.0 6.0 7.0
0.0 1.0 2.0 3.0 4.0 5.0
E11.5 Ctrl GSK126
E11.5 Ctrl: E11.5 +48h GSK126: E11.5 +48h
Relative H3K27me3 intensity
Radial distance (μm) -1.0
0.0 1.0 2.0 3.0 4.0 5.0 6.0
0.0 0.5 1.0 1.5 2.0 2.5 3.0 3.5 4.0 4.5
E11.5 GSK126
Male E11.5 +48h
Relative H3K27me3 intensity
Radial distance (μm) Ctrl
Ctrl: E11.5 +48h GSK126: E11.5 +48h
E11.5
Fig. 9 Blockage of EZH1/2 significantly reduces H3K27me3 enrichment near the nuclear lamina in fetal germ cells undergoing epigenetic repro-gramming. Radial histogram quantification of dSTORM super-resolution immunofluorescent images of sections from E11.5 fetal testes and ovaries
cultured for 48 h. E11.5 wild-type control is shown in green, E11.5 + 48 h vehicle control (DMSO) is shown in blue, and E11.5 + 48 h of GSK126
treatment (10 μm) shown in red. Left image of each colored panel (×160) represents merged channels, with green marking germ cells (eGFP) and
H3K27me3 shown in the red channel. 10 μm scale bars. The right-hand image of each panel shows dSTORM super-resolution images of germ cells
(H3K27me3 in grayscale). 1 μm scale bars. 3–8 super-resolved images from three biological replicates. Y-axis shows relative H3K27me3 intensity, and
global gene expression patterns using GeneSpring GX software revealed no significant differences in germ cell gene expression in gonads treated with GSK126 and vehi-cle control. In addition to global GeneSpring analysis, we used validated reference genes Sdha, MapK1 and Canx
[44] to normalize the raw array hybridization signals of known germ cell development, PRC2-regulated genes and genes encoding PRC2 proteins, and compared their relative expression in GSK126 and vehicle-treated sam-ples. Consistent with the GeneSpring analysis, homeobox genes of the A, B, C and D clusters (Fig. 10b; Hoxb clus-ter shown), known male germ cell development genes (Fig. 10c), pluripotency genes (Fig. 10c), and PRC2 genes
Ezh1, Ezh2, Eed and Suz12 (Fig. 10d) were not signifi-cantly different in germ cells isolated from gonads treated with GSK126 or vehicle control for 72 h. In all cases, the expression of these genes was similar to what is expected for during normal germ cell development, with generally very low signals for the Hox genes and pluripotency genes
Nanog and Sox2, moderate expression of Oct4, which is
maintained in male germ cells at E15.5, high expression of Dppa4, Piwil2, Tdrd5, Tdrd7, Nanos2, Dnmt3l and
Mvh which are upregulated in male germ cells by E15.5 and high expression of Eed and Ezh1, but relatively low expression of Ezh2 and Suz12.
Discussion
With the exception of DNA methylation, reprogramming of epigenetic information in the developing germline is poorly understood. Here, we demonstrate that the epi-genetic modifier complex PRC2, which catalyzes H3K27 methylation, is transiently expressed in germ cells soon after they enter the gonad and undergo the final phase of DNA demethylation [3]. Coincident with increased PRC2 protein localization to the nucleus of germ cells, we observed substantial enrichment of H3K27me3 near the nuclear lamina in the gonadal germ cell population. This peripheral nuclear enrichment of H3K27me3 occurred during E11.5–E13.5, coinciding with the final phase of DNA demethylation and the lowest levels of DNA
H3K27me3 mean staining
intensity (x1000)
10 0 20 30
E12.5+72h Germ Cells
a
b
c
d
Average probe intensit
y
Average probe intensit
y
Average probe intensit
y
0 100 200 300 400 500 600 700 800 900
HoxbLocus
DMSO GSK126
0 5000 10000 15000 20000 25000 30000 35000
Eed Ezh1 Ezh2 Suz12 Genes encoding PRC2
DMSO GSK126 0
5000 10000 15000 20000 25000 30000 35000
Germ cell differentiation genes
DMSO GSK126 ****
Fig. 10 Gene expression profiles remained normal after H3K27me3 enrichment was reduced in fetal male germ cells. a Average H3K27me3
intensi-ties were measured using flow analysis of FACS sorted E12.5 germ cells cultured for 72 h with a vehicle control (DMSO; green) or 10 μm GSK126
(blue). b–d Expression microarray relative probe signal intensities normalized to Sdha, Canx and Mapk1 for genes expressed in E12.5 germ cells
cul-tured for 72 h with DMSO or 10 μm GSK126: bHoxb locus. c A selection of male germ cell development genes; Sox2, Pou5f1, Nanog, Dppa2, Dppa4,
methylation in germ cells. By E15.5, H3K27me3 was again uniformly localized throughout nucleus in XX and XY germ cells. These findings demonstrate significantly three-dimensional reorganization of chromatin in the germ cell nucleus that is likely to be important for epige-netic reprogramming. In addition, we provide evidence that H3K27me3 enrichment near the nuclear lamina in E11.5–E13.5 germ cells is dependent on EZH1/2 activ-ity, which comprise the essential catalytic proteins that mediate PRC2 activity. Combined, these data indicate that H3K27me3 mediates global reorganization of chro-matin toward the nuclear lamina during the critical period during which germ cell DNA methylation levels are at their lowest. However, despite depletion of 80% of the H3K27me3 in male fetal germ cells, development of these cells was not altered within the 72-h culture win-dow, and neither genes that mark male germline differen-tiation, nor known H3K27me3 targets, were altered.
A previous study reported reorganization of germ cell chromatin soon after germ cells enter the gonad [7]. This led to the proposal that H3K27me3 is removed and replaced in gonadal germ cells to ensure that epi-genetic information is reset in the fetal germline [7]. However, another study concluded that H3K27me3 is maintained at relatively constant levels in gonadal germ cells, but fluctuates with cell cycle progression [9]. In the present study, we used flow cytometry to quantify H3K27me3 levels per cell and directly assess the varia-tion in H3K27me3 levels in gonadal germ cells at E11.5, E13.5 and E15.5. In addition, we examined H3K27me3 in sections of gonads using both standard confocal imag-ing and super-resolution imagimag-ing at E10.5, E11.5, E12.5, E13.5 and E15.5. Using flow cytometry, we detected high levels of H3K27me3 in E11.5 germ cells, which moder-ately declined in E13.5 and E15.5 germ cells. H3K27me3 levels in germ cells were fourfold to sevenfold higher than those detected in the gonadal somatic cells at all stages analyzed. Consistent with this, confocal and super-resolution imaging revealed higher levels of H3K27me3 in germ cells than in somatic cells at all stages analyzed. Using these combined approaches, we found no evidence of extensive loss of H3K27me3 in either XX or XY germ cell after they entered the gonad. This is consistent with the conclusions of Kagiwada et al. [9], who also observed relatively constant levels of H3K27me3 in gonadal germ cells, although levels fluctuated with cell cycle. It remains possible that H3K27me3 is removed and replaced in a very short temporal window. However, based on our findings we conclude that widespread loss of H3K27me3 is unlikely to occur as part of epigenetic reprogramming in mouse germ cells in the few days after they enter the developing gonads.
Rather than loss of H3K27me3 from germ cells at E11.5, we observed substantial transient enrichment of H3K27me3 near the germ cell nuclear lamina. This per-sisted until E13.5, but by E15.5 H3K27me3 was again localized throughout the germ cell nucleus in both XX and XY germ cells. In male germ cells, the redistribu-tion of H3K27me3 back through the nucleus at E15.5 coincided with the initiation of de novo DNA methyla-tion in mitotically arrested male germ cells. However, H3K27me3 was also distributed throughout the nucleus by the time female germ cells exit the cell cycle and have entered meiotic prophase by E15.5 [37].
The redistribution of H3K27me3 toward the nuclear lamina in E11.5–E13.5 male and female germ cells is both striking and intriguing. One possibility is that H3K27me3 regulates specific gene expression programs in the male and female germlines during this time. However, our analysis of global gene expression patterns in which H3K27me3 was depleted by 80% revealed no differences in gene expression in the 72-h window analyzed. Markers of male germline development were expressed normally, and there was no evidence that known targets of PRC2/ H3K27me3 were de-repressed. This was surprising as previous studies have identified genes that are enriched for H3K27me3 in male and female germ cells during this period, suggesting that PRC2-mediated H3K27me3 enrichment might substantially regulate sex-specific germ cell development [29–31]. One caveat for the cur-rent study is that around 20% of the global H3K27me3 levels remained in germ cells after drug treatment, and this may be sufficient to maintain normal regulation of gene expression. However, dSTORM imaging clearly demonstrated that the H3K27me3 that remained in GSK126-treated cells was no longer localized toward the nuclear lamina, demonstrating that at least this function was compromised in the drug-treated gonads. Moreo-ver, as we observed similar enrichment of H3K27me3 near the nuclear lamina in both sexes, and inhibition of EZH1/2 and depletion of H3K27me3 affected this equally in both sexes, it is unlikely that the global reorganization of H3K27me3 we observed can explain the regulation of sex-specific programs. It is more likely that H3K27me3 mediates a repressive activity that affects sequences com-mon to both male and female germ cells.
consider this unlikely for two reasons. Firstly, blocking EZH1/2 which catalyzes H3K27me3 prevented enrich-ment of H3K27me3 at the germ cell nuclear periphery in gonads cultured from E11.5 for 24 or 48 h. Secondly, studies in other cell systems provide substantial evidence that localization of chromatin to the nuclear periphery is associated with transcriptional repression [45, 46].
Indeed, it is highly plausible that transcriptional repres-sion plays an essential role in maintaining genomic integ-rity during epigenetic reprogramming. DNA methylation is at its lowest level soon after germ cells enter the gonad. This is considered to involve a period during which germ cells may be vulnerable to aberrant expression of sequences such as ERVs that would otherwise contain DNA methylation and be repressed [2, 6, 47–49]. Previ-ous studies have demonstrated enrichment of H3K27me3 at ERVs including young LTR and LINE elements, and at intergenic regions, introns and ICRs in male and female gonadal germ cells undergoing epigenetic reprogram-ming [6, 31]. Although repression of ERVs is in part achieved by SETDB1 through its catalysis of H3K9me3 in E13.5 fetal germ cells, this activity does not account for the repression of all ERVs, indicating that other mecha-nisms also repress ERVs during this period [6]. Moreover, recent work has demonstrated a role for H3K27me3 in ERV repression in embryonic stem cells in which DNA methylation levels are reduced by treatment with 5-aza-cytidine and vitamin C [50].
Interestingly, although H3K27me3 was enriched near the nuclear lamina in germ cells undergoing reprogram-ming, EZH2, EED and SUZ12 staining was consist-ently detected throughout the nucleus. Yet blocking EZH2 activity prevented enrichment of the remaining H3K27me3 near the nuclear lamina. This implies that although PRC2 is required for catalyzing H3K27me3 in the nucleus at this stage, the complex is not relocated toward the nuclear lamina with H3K27me3-enriched chromatin. One possible explanation is that relocali-zation of H3K27me3 may depend on an additional mechanism(s) in the germ cell nucleus.
In this study, we demonstrate PRC2-dependent enrich-ment of H3K27me3 near the nuclear lamina when DNA methylation is at its lowest level in germ cells, but no change in expression of protein coding genes, with the caveat that EZH1/2 was blocked and H3K27me3 depleted in a limited 72-h window. However, EZH1/2-depend-ent reorganization of H3K27me3 in both sexes suggests that H3K27me3 plays roles other than repressing coding genes during this developmental period. One possibility may be that PRC2 and H3K27me3 play a transient role in repressing ERVs during epigenetic reprogramming of the germline through a mechanism that involves their
relocalization to the nuclear periphery and sequestration into repressive chromatin structures. However, further work is required to determine whether this is the case.
Conclusions
We have identified substantial nuclear reorganization of the repressive histone modification H3K27me3 in germ cells as they undergo epigenetic reprogramming and reach their lowest DNA methylation levels. This occurs during a transient period of PRC2 enrichment in germ cells of both sexes and is dependent on EZH2 activity, the enzyme that catalyzes H3K27 methylation. Determining the repressive mechanisms that regulate germline epige-netic state during germline reprogramming is essential for understanding how altered epigenetic function in the germline contributes to inherited disease. It is therefore imperative that further work seeks to understand the mechanisms that regulate epigenetic and genetic integ-rity in the germline prior to fertilization.
Methods
Mouse strains, animal housing, breeding and ethics
Mice were housed at Monash Medical Centre Animal Facility using a 12-h light–dark cycle. Food and water were available ad libitum, and room temperature was 21–23 °C with controlled humidity. With the exception of breeding pairs and neonatal mice (up to three weeks old), males and females were weaned at 21 days and kept in cages of up to five individuals. All animal work was undertaken in accordance with Monash University Ani-mal Ethics Committee (AEC) approvals. Temporal and spatial profiling of PRC2 components and H3K27me3 was carried out on embryos collected from Oct4
[Pou5f1]-eGFP on 129svJ background males crossed with Swiss females (obtained from Monash Animal Services). Females were checked for vaginal plugs daily, and detec-tion of a plug was noted as E0.5. Embryos E12.5 or older were sexed by the presence (male) or absence (female) of testis cords in gonads. Embryos younger than E12.5 were sexed using PCR as described [51].
Flow cytometry
[53] with germ cells identified by their expression of mouse vasa homologue (MVH) and somatic cells iden-tified by anti-Mullerian hormone (AMH) staining. Cells were stained with 20 μg/ml propidium iodide, allowing quantitation of cellular DNA content. Proliferation was measured by gating EdU-positive cells against propidium iodide to identify cells actively in S-phase. Cells in G1 and G2/M were identified by their DNA content and the absence of S-phase activity. All flow cytometry was per-formed on a FACS Canto instrument and data analyzed in FlowJo and GraphPad Prism. For all analyses, 3–9 biological replicates were analyzed and statistical signifi-cance determined using one-way ANOVA with Tukey’s multiple comparison or t test as appropriate. P values <0.05 were considered significant.
Tissue fixation and embedding
Gonads were fixed in 4% paraformaldehyde (PFA) in PBS for IF and confocal imaging, or 2% PFA plus 0.02% glutaraldehyde (GA) in PBS (dSTORM super-resolution microscopy) for 20–90 min according to embryo age (Additional file 1: Table S1). Samples were then washed twice in PBS and left in 30% sucrose in PBS overnight at 4 °C. Samples were then placed in disposable cryostat molds (Sakura Finetek, 4565) filled with OCT (Sakura Finetek, 4583) and frozen in dry ice. Blocks were and stored at −80 °C.
Immunofluorescence
Eight-micron sections were cut from OCT-embedded gonads fixed in 4% PFA, mounted on SuperFrost Plus slides and dried for 5 min before immersing in 1× PBS. Sections were then permeabilized by incubation in 1% Triton × 100 (Sigma, T8787) in PBS for 10 min at room temperature (RT). Slides were washed three times for 5 min each in PBS. Sections were blocked in PBS con-taining 5% BSA (Sigma, A9647) and 10% donkey serum (Sigma, D9663) and incubated for 45 min at RT. Block-ing solution was replaced by PBS containBlock-ing 1%BSA and appropriately diluted primary antibodies (Additional file 1: Table S2) and incubated for 1 h at RT. Slides were washed three times for 5 min in PBS and secondary anti-bodies diluted in 1% BSA in 1 x PBS according to antibody dilutions outlined in Additional file 1: Table S3. Second-ary antibody incubation was carried out in a dark box for 1 h at RT. Slides were washed three times in PBS (5 min each wash) and mounted in ProLong Gold® containing DAPI (Life Technologies, P36931) and left in a dark box over night to dry. For control slides, only a secondary antibody was applied. Confocal images were taken as sin-gle optical sections using a Nikon® C1 inverted confocal microscope. All pictures were taken at 80×, using a 40× oil immersion lens. Nuclear localization of H3K27me3
was assessed in 3–6 biological replicates per embryonic stage. Each germ cell was visually assessed for UNL or PNL staining based on the presence of staining through-out the nucleus or only around the nuclear periphery, respectively. Cell counts were recorded using ImageJ Plugin Cell Counter. Data were expressed as the percent-age of cells with UNL and PNL staining and analyzed for statistically significant differences between stages using one-way ANOVA with Tukey’s multiple comparison test or differences between treatments using Student’s t test with P ≤ 0.05 considered significant. H3K27me3 mean intensity was measured in three biological replicates for each culture period (E11.5 +48 h male and females, >119 cells analyzed; E11.5 +24 h males, >68 cells analyzed). ImageJ ROI manager was used to calculate the mean intensity for H3K27me3, and unpaired t tests were used to statistically analyze treatments groups, with P ≤ 0.05 considered significant.
dSTORM super‑resolution imaging
Two-micron sections were cut from OCT-embedded gonads fixed in 2% PFA and 0.02% GA (Additional file 1: Table S1) and mounted on poly-l-lysine (Sigma) coated #1.5 Coverslips (Grale HDS) enclosed within 8-well sticky chambers (Ibidi, 80828) and stained.
Super-resolution images were recorded using a cus-tom-built (Monash Micro Imaging) dSTORM instrument based on an Olympus IX-71 microscope equipped with Plan ApoChromat oil immersion 100× 1.4NA objective (Olympus part #N1480900), 1.6× magnification changer, Toptica 488 nm laser (200 mW), Gem 561 nm laser (500 mW), and Oxxius 637 nm laser (150 mW), suitable Olympus fluorescence filter cubes and Andor iXon Ultra 897 High Speed EMCCD camera with single-photon sensitivity for single-molecule detection. The final exci-tation steering mirror and beam expansion lenses were mounted on a translation stage for free adjustment of the total internal reflection fluorescence (TIRF) angle. The system was operated at a TIRF angle appropriate for the respective sample to concentrate excitation power and reduce background fluorescence. Samples were mounted on a manual x,y translation stage to minimize sample drift.
The acquired data were reconstructed to super-resolved images of 10-nm pixel size using the open-source software rapidSTORM version 3.3.1. Blinks with a local signal-to-noise ratio (SNR) <80 were discarded. Images were first color coded for temporal appearance of blinks to detect sample drift, then (if necessary) cor-rected for drift using the linear drift correction available in rapidSTORM and exported as 8-bit grayscale images.
Analysis of H3K27me3 staining in dSTORM super‑resolution images
Radial histogram analysis was carried out for all repre-sentative super-resolution images for each embryonic time point and treatment group. This involved the use of an algorithm (macro was installed and analyzed on ImageJ) to measure staining intensity of H3K27me3, beginning at the center of the cell nucleus out to the nuclear periphery. H3K27me3 intensity was measured in ever-increasing concentric circles (radial diameter) expanding in at 0.1 μm increments from the center of the nucleus until the nuclear lamina was reached. Values on each radial diameter line were collated and averaged to provide values ± standard error of the mean across 3–6 biological replicates. Data were processed and graphed in Microsoft Excel.
Organ culture
All culture reagents were purchased from Life Technolo-gies unless otherwise stated. Embryos were collected at E11.5 from Swiss females mated to 129T2svJ Oct4-eGFP transgenic males. Gonad plus mesonephros was cultured on 30-mm organotypic cell culture inserts (Merck Mil-lipore; PICM03050) in 1200-μl culture media (250 μm sodium pyruvate, 15 mM Hepes, 1X nonessential amino acids (Life Technologies, 11140), 1 mg/ml N-acetyl-cysteine (Sigma, A9165), 55 μm β-mercaptoethanol (Life Technologies, 21985) and 10% FCS in DMEM/F12 with Glutamax (Life Technologies, 10565) containing either DMSO (vehicle control) or 10 μm GSK126 (EZH1/2 inhibitor; SelleckChem, S7061). Media preparations also contained 1× penicillin/streptomycin (Life Technologies, 15070). Gonads were randomly allocated to each culture treatment condition and cultured for 48 h in 37 °C/5% CO2 conditions. Culture media was refreshed daily. Gonads were processed for flow cytometry, FACS, IF and dSTORM super-resolution imaging.
FACS and cell viability
Four to six cultured gonads were collected, pooled together and dissociated with 0.25% trypsin as previously described. The reaction was stopped by adding 500 μl of culture media containing 10% fetal calf serum, and cells were collected by centrifugation. Cells were resuspended
in 300 μl culture media containing 10% fetal calf serum and propidium iodide added to a final concentration of 2 μg/ml. Cells were run on an Influx 2 cell sorter. Non-viable cells were quantified and excluded as a percentage of the whole single cell population based on propidium iodide staining. Oct4-eGFP positive (germ) and negative (somatic) cells separated based on eGFP fluorescence and collected in separate tubes. Cells were collected by cen-trifugation and snap frozen for RNA extraction.
RNA preparation and expression microarray analysis RNA was extracted from FACS-purified cells (~20,000 cells per sample, n = 3 for vehicle and GSK126 treat-ments, respectively) using TRIzol reagent, treated with Turbo DNAse 1 (Ambion) according to the manufactur-er’s instructions and resuspended in RNAase-free water. RNA quantity and quality were assessed using a Qubit instrument and a Bioanalyzer. Total RNA (100 ng/sam-ple) was labeled using Agilent One Colour Low Input Quick Amp Labelling Kit v.6.6, and dye incorporation assessed using a NanoDrop ND-1000 Spectrophotom-eter. In total, 600 ng of Cy3-labeled cRNA (specific activ-ity >6 pmol Cy3/μg) was fragmented at 60 °C according to the Agilent protocol and hybridized to Agilent SurePrint G3 Mouse Gene Expression 8 × 60K Arrays for 17 h at 67 °C according to manufacturer’s instructions. Arrays were washed and immediately scanned on an Agilent C, DNA microarray scanner using one-color scan set-tings for 8 × 60K arrays. The scanned images were ana-lyzed with Feature Extraction Software 11.0.1.1 (Agilent) using default parameters (protocol GE1-1100_Jul11 and Grid: 028005_D_F_20120201) to obtain background sub-tracted and spatially detrended Processed Signal intensi-ties. Data were analyzed using GeneSpring GX software using the proprietary analysis pathway. In addition, raw signal intensities for a selection of genes were indepen-dently normalized against validated reference genes for fetal germ cells using intensities across all probes for
Sdha, Canx and MapK1 and the data expressed as nor-malized signal intensities.
Abbreviations
AMH: anti-Mullerian hormone (also known as Mullerian inhibitory substance); Cyto: cytoplasm; EED: Embryonic Ectoderm Development; E: embryonic day; eGFP: enhanced GFP; ERVs: endogenous retroviral elements; ERV1: Class I; ERVK: Class II; EZH1: Enhancer of Zeste 1; EZH2: Enhancer of Zeste 2; FACS: fluorescence-activated cell sorting; GSK126: EZH1/2 inhibitor; H3K9me2: dimethylated lysine 9 on histone 2; H3K9me3: trimethylated lysine 9 on histone 3; H3K27me3: trimethylated lysine 27 on histone 3; IAPs: Additional file
intracisternal-A-particles; LINE: long interspersed nuclear elements; LINE1: LINE subgroup 1; MVH: mouse vasa homologue (also known as DDX4); PNL: periph-eral nuclear localization; PRC2: Polycomb Repressive Complex 2; SETDB1: SET domain, bifurcated 1; SINE: short interspersed elements; SUZ12: Suppressor of Zeste 12; TEs: transposable elements; UNL: uniform nuclear localization.
Authors’ contributions
PW conceived the project. PW, LP, JS and KH designed the experiments. LP, KH, KE and JS performed the experiments. LP, KE, KH, JS and PW analyzed the data. LP, JS and PW wrote the paper. All authors read and approved the final manuscript.
Author details
1 Department of Molecular and Translational Science, Centre for Genetic Diseases, Hudson Institute of Medical Research, Monash University, Clayton, VIC 3168, Australia. 2 Monash Micro Imaging, Monash University, Clayton, VIC 3800, Australia.
Acknowledgements
This work was supported by National Health and Medical Research Grants GNT1043939 and GNT1051223 awarded to PSW, funding from the Monash University Faculty of Medicine, Nursing and Health Sciences funding granted to PW and the Victorian Government’s Operational Infrastructure Support Program. LP was supported by an Australian Postgraduate Award. We thank Monash Animal Research Platform staff for assistance with mouse care, Cam-den Lo (Monash Micro Imaging) for imaging advice and Jodee Gould (Monash Health Translational Precinct Medical Genomics Facility) for assistance with micro-array studies.
Competing interests
The authors declare that they have no competing interests.
Availability of data and materials
The expression array datasets generated and analyzed during the current study are available from the corresponding author on reasonable request. All other data generated or analyzed during this study are included in this published article and its supplementary information files.
Ethics approval and consent to participate
All experiments in involving were performed under ethical approval and in accordance with guidelines and regulations of Monash University Animal Ethics Committee.
Received: 9 December 2016 Accepted: 1 February 2017
References
1. Seisenberger S, Andrews S, Krueger F, et al. The dynamics of genome-wide DNA methylation reprogramming in mouse primordial germ cells. Mol Cell. 2012;48(6):849–62.
2. Hackett JA, Sengupta R, Zylicz JJ, et al. Germline DNA demethylation dynamics and imprint erasure through 5-hydroxymethylcytosine. Sci-ence. 2013;339(6118):448–52.
3. Hajkova P, Erhardt S, Lane N, et al. Epigenetic reprogramming in mouse primordial germ cells. Mech Dev. 2002;117(1–2):15–23.
4. Guibert S, Forne T, Weber M. Global profiling of DNA methylation erasure in mouse primordial germ cells. Genome Res. 2012;22(4):633–41. 5. Kobayashi H, Sakurai T, Miura F, et al. High-resolution DNA methylome
analysis of primordial germ cells identifies gender-specific reprogram-ming in mice. Genome Res. 2013;23(4):616–27.
6. Liu S, Brind’amour J, Karimi MM, et al. Setdb1 is required for germline development and silencing of H3K9me3-marked endogenous retrovi-ruses in primordial germ cells. Genes Dev. 2014;28(18):2041–55. 7. Hajkova P, Ancelin K, Waldmann T, et al. Chromatin dynamics
dur-ing epigenetic reprogrammdur-ing in the mouse germ line. Nature. 2008;452(7189):877–81.
8. Seki Y, Yamaji M, Yabuta Y, et al. Cellular dynamics associated with the genome-wide epigenetic reprogramming in migrating primordial germ cells in mice. Development. 2007;134(14):2627–38.
9. Kagiwada S, Kurimoto K, Hirota T, Yamaji M, Saitou M. Replication-coupled passive DNA demethylation for the erasure of genome imprints in mice. EMBO J. 2013;32(3):340–53.
10. Cao R, Wang L, Wang H, et al. Role of histone H3 lysine 27 methylation in Polycomb-group silencing. Science. 2002;298(5595):1039–43. 11. Czermin B, Melfi R, Mccabe D, Seitz V, Imhof A, Pirrotta V.
Dros-ophila enhancer of Zeste/ESC complexes have a histone H3 meth-yltransferase activity that marks chromosomal Polycomb sites. Cell. 2002;111(2):185–96.
12. Muller J, Hart CM, Francis NJ, et al. Histone methyltransferase activ-ity of a Drosophila Polycomb group repressor complex. Cell. 2002;111(2):197–208.
13. Denisenko O, Shnyreva M, Suzuki H, Bomsztyk K. Point mutations in the WD40 domain of Eed block its interaction with Ezh2. Mol Cell Biol. 1998;18(10):5634–42.
14. Margueron R, Li G, Sarma K, et al. Ezh1 and Ezh2 maintain repressive chromatin through different mechanisms. Mol Cell. 2008;32(4):503–18. 15. Pasini D, Bracken AP, Jensen MR, Lazzerini Denchi E, Helin K. Suz12 is
essential for mouse development and for EZH2 histone methyltrans-ferase activity. EMBO J. 2004;23(20):4061–71.
16. Faust C, Schumacher A, Holdener B, Magnuson T. The eed muta-tion disrupts anterior mesoderm producmuta-tion in mice. Development. 1995;121(2):273–85.
17. O’carroll D, Erhardt S, Pagani M, Barton SC, Surani MA, Jenuwein T. The polycomb-group gene Ezh2 is required for early mouse development. Mol Cell Biol. 2001;21(13):4330–6.
18. Rinchik EM, Carpenter DA. N-ethyl-N-nitrosourea-induced prenatally lethal mutations define at least two complementation groups within the Embryonic Ectoderm Development (EED) locus in mouse chromosome 7. Mamm Genome. 1993;4(7):349–53.
19. Rinchik EM, Carpenter DA, Selby PB. A strategy for fine-structure functional analysis of a 6- to 11-centimorgan region of mouse chro-mosome 7 by high-efficiency mutagenesis. Proc Natl Acad Sci USA. 1990;87(3):896–900.
20. Schumacher A, Faust C, Magnuson T. Positional cloning of a global regu-lator of anterior-posterior patterning in mice. Nature. 1996;384(6610):648. 21. Sauvageau M, Sauvageau G. Polycomb group genes: keeping stem cell
activity in balance. PLoS Biol. 2008;6(4):e113.
22. Lessard J, Schumacher A, Thorsteinsdottir U, Van Lohuizen M, Magnu-son T, Sauvageau G. Functional antagonism of the Polycomb-Group genes eed and Bmi1 in hemopoietic cell proliferation. Genes Dev. 1999;13(20):2691–703.
23. Mu W, Starmer J, Fedoriw AM, Yee D, Magnuson T. Repression of the soma-specific transcriptome by Polycomb-repressive complex 2 pro-motes male germ cell development. Genes Dev. 2014;28(18):2056–69. 24. Erhardt S, Su IH, Schneider R, et al. Consequences of the depletion of
zygotic and embryonic enhancer of zeste 2 during preimplantation mouse development. Development. 2003;130(18):4235–48.
25. Iovino N, Ciabrelli F, Cavalli G. PRC2 controls Drosophila oocyte cell fate by repressing cell cycle genes. Dev Cell. 2013;26(4):431–9.
26. Gaydos LJ, Rechtsteiner A, Egelhofer TA, Carroll CR, Strome S. Antagonism between MES-4 and Polycomb repressive complex 2 promotes appropri-ate gene expression in C. elegans germ cells. Cell Rep. 2012;2(5):1169–77. 27. Bracken AP, Dietrich N, Pasini D, Hansen KH, Helin K. Genome-wide map-ping of Polycomb target genes unravels their roles in cell fate transitions. Genes Dev. 2006;20(9):1123–36.
28. Bernstein BE, Mikkelsen TS, Xie X, et al. A bivalent chromatin struc-ture marks key developmental genes in embryonic stem cells. Cell. 2006;125(2):315–26.
29. Lesch BJ, Dokshin GA, Young RA, Mccarrey JR, Page DC. A set of genes critical to development is epigenetically poised in mouse germ cells from fetal stages through completion of meiosis. Proc Natl Acad Sci USA. 2013;110(40):16061–6.
• We accept pre-submission inquiries
• Our selector tool helps you to find the most relevant journal
• We provide round the clock customer support
• Convenient online submission
• Thorough peer review
• Inclusion in PubMed and all major indexing services
• Maximum visibility for your research
Submit your manuscript at www.biomedcentral.com/submit
Submit your next manuscript to BioMed Central
and we will help you at every step:
31. Ng JH, Kumar V, Muratani M, et al. In vivo epigenomic profiling of germ cells reveals germ cell molecular signatures. Dev Cell. 2013;24(3):324–33.
32. Erkek S, Hisano M, Liang CY, et al. Molecular determinants of nucleosome retention at CpG-rich sequences in mouse spermatozoa. Nat Struct Mol Biol. 2013;20(7):868–75.
33. Brykczynska U, Hisano M, Erkek S, et al. Repressive and active histone methylation mark distinct promoters in human and mouse spermatozoa. Nat Struct Mol Biol. 2010;17(6):679–87.
34. Hammoud SS, Nix DA, Zhang H, Purwar J, Carrell DT, Cairns BR. Distinctive chromatin in human sperm packages genes for embryo development. Nature. 2009;460(7254):473–8.
35. Szabo PE, Hubner K, Scholer H, Mann JR. Allele-specific expression of imprinted genes in mouse migratory primordial germ cells. Mech Dev. 2002;115(1–2):157–60.
36. Western PS, Miles DC, Van Den Bergen JA, Burton M, Sinclair AH. Dynamic regulation of mitotic arrest in fetal male germ cells. Stem Cells. 2008;26(2):339–47.
37. Miles DC, Van Den Bergen JA, Sinclair AH, Western PS. Regulation of the female mouse germ cell cycle during entry into meiosis. Cell Cycle. 2010;9(2):408–18.
38. Western PS, Ralli RA, Wakeling SI, et al. Mitotic arrest in teratoma suscepti-ble fetal male germ cells. PLoS ONE. 2011;6(6):e20736.
39. Seki Y, Hayashi K, Itoh K, Mizugaki M, Saitou M, Matsui Y. Extensive and orderly reprogramming of genome-wide chromatin modifications associ-ated with specification and early development of germ cells in mice. Dev Biol. 2005;278(2):440–58.
40. Hilscher B, Hilscher W, Bulthoff-Ohnolz B, et al. Kinetics of gametogenesis. I. Comparative histological and autoradiographic studies of oocytes and transitional prospermatogonia during oogenesis and prespermatogen-esis. Cell Tissue Res. 1974;154(4):443–70.
41. Adams IR, Mclaren A. Sexually dimorphic development of mouse primor-dial germ cells: switching from oogenesis to spermatogenesis. Develop-ment. 2002;129(5):1155–64.
42. Bullejos M, Koopman P. Germ cells enter meiosis in a rostro-caudal wave during development of the mouse ovary. Mol Reprod Dev. 2004;68(4):422–8.
43. Mccabe MT, Ott HM, Ganji G, et al. EZH2 inhibition as a therapeu-tic strategy for lymphoma with EZH2-activating mutations. Nature. 2012;492(7427):108–12.
44. Van Den Bergen JA, Miles DC, Sinclair AH, Western PS. Normalizing gene expression levels in mouse fetal germ cells. Biol Reprod. 2009;81:362–70. 45. Bickmore WA, Van Steensel B. Genome architecture: domain organization
of interphase chromosomes. Cell. 2013;152(6):1270–84.
46. Croft JA, Bridger JM, Boyle S, Perry P, Teague P, Bickmore WA. Differences in the localization and morphology of chromosomes in the human nucleus. J Cell Biol. 1999;145(6):1119–31.
47. Walsh CP, Chaillet JR, Bestor TH. Transcription of IAP endogenous retroviruses is constrained by cytosine methylation. Nat Genet. 1998;20(2):116–7.
48. Kato Y, Kaneda M, Hata K, et al. Role of the Dnmt3 family in de novo methylation of imprinted and repetitive sequences during male germ cell development in the mouse. Hum Mol Genet. 2007;16(19):2272–80. 49. Bourc’his D, Bestor TH. Meiotic catastrophe and retrotransposon
reactiva-tion in male germ cells lacking Dnmt3L. Nature. 2004;431(7004):96–9. 50. Walter M, Teissandier A, Pérez-Palacios R, Bourc’his D. An epigenetic
switch ensures transposon repression upon dynamic loss of DNA meth-ylation in embryonic stem cells. eLife. 2016;5:e11418.
51. Mcfarlane L, Truong V, Palmer J, Wilhelm D. Novel PCR assay for determin-ing the genetic sex of mice. Sex Dev. 2013;7(4):207–11.
52. Wakeling SI, Miles DC, Western PS. Identifying disruptors of male germ cell development by small molecule screening in ex vivo gonad cultures. BMC Res Notes. 2013;6(1):168.