APPENDIX 4. Additional comparisons of the hierarchical Bayesian (HB3) and maximum likelihood (ML) models, including comparisons of the number of species with trend estimates and the classification of species trends into the categorical assessments of population status used in Environment Canada’s Status of Birds in Canada website (Environment Canada 2011).
Comparing the number of species with trend estimates.
Methods
Each model has specific criteria for the minimum data required to estimate a trend for a particular area. These different criteria mean that the list of species and regions with trend estimates will, to some extent, depend on the model being used. We contrasted the number of species with trend estimates for each model for each of the assessed regions (i.e., at the national, BCR, and single stratum scales). We provided lists of the unique species for the national and New Brunswick regions, as examples of the types of species included or excluded based on these criteria. At the limits imposed by either set of minimum data criteria, trend and annual index estimates will almost certainly be of low quality. However, we have included this comparison here to document the newly included and excluded species, and to explain some of the factors leading to the changed list of species with estimated trends.
Results
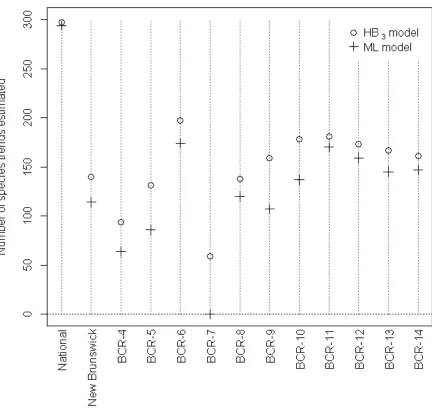
TABLE A4.1. Lists of Canadian BBS species trends uniquely estimated by each of two models: the previously used maximum likelihood (ML) model, and the new hierarchical Bayesian (HB3) model. Lists are presented in taxonomic order at two scales: 1) the national scale and 2) for New Brunswick, which serves as an example of a smaller region where the difference in the number of species trends estimated is greater than at the national level (Figure A4.1).
Maximum Likelihood (ML) Hierarchical Bayes (HB3) National Trumpeter Swan (Cygnus
buccinator)
Spruce Grouse (Falcipennis canadensis)
Red-throated Loon (Gavia stellata) Northern Goshawk (Accipiter gentilis)
Burrowing Owl (Athene cunicularia) Great Gray Owl (Strix nebulosa) Northern Saw-whet Owl (Aegolius acadicus)
Prairie Falcon (Falco mexicanus)
Pacific Loon (Gavia pacifica) Black Oystercatcher (Haematopus bachmani)
Least Sandpiper (Calidris minutilla) Black-legged Kittiwake (Rissa tridactyla) Black Guillemot (Cepphus grille)
Pigeon Guillemot (Cepphus columba) Marbled Murrelet (Brachyramphus marmoratus)
White-throated Swift (Aeronautes saxatalis)
Black-chinned Hummingbird (Archilochus alexandri)
Carolina Wren (Thryothorus ludovicianus) Western Bluebird (Sialia mexicana) New
Brunswick
Merlin (Falco columbarius) American Wigeon (Anas Americana) Mallard (Anas platyrhynchos)
Blue-winged Teal (Anas discors) Northern Pintail (Anas acuta) Green-winged Teal (Anas crecca) Ring-necked Duck (Aythya collaris) Common Eider (Somateria mollissima) Common Goldeneye (Bucephala clangula) Ring-necked Pheasant (Phasianus
colchicus)
Pied-billed Grebe (Podilymbus podiceps) Black-crowned Night-Heron (Nycticorax nycticorax)
Bald Eagle (Haliaeetus leucocephalus) Sora (Porzana carolina)
Common Tern (Sterna hirundo) Great Horned Owl (Bubo virginianus) Barred Owl (Strix varia)
White-breasted Nuthatch (Sitta carolinensis)
Eastern Bluebird (Sialia sialis) Brown Thrasher (Toxostoma rufum) Pine Warbler (Setophaga pinus)
Nelson's Sparrow (Ammodramus nelson) Fox Sparrow (Passerella iliaca)
Comparing the categorical assessments of population status.
Methods
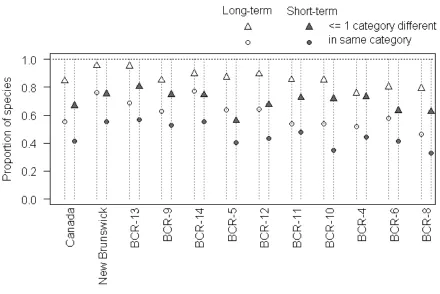
We also compared how each model would classify species into the five population status categories used for Environment Canada’s “Status of Birds in Canada” assessment (i.e., “Large Decrease”, “Moderate Decrease”, “Little Change”, “Moderate Increase”, and “Large Increase” Environment Canada 2011). We estimated the proportion of species that would be classified into the same categories according to the trend estimates from the two models, as well as the
proportion that would be classified into categories that were, at most, one category apart in the ranking.
Results
Figure A4.2. The proportion of species with BBS trend estimates that fall into the same “Status of Birds in Canada” (Environment Canada 2011) population status category (upper plot) or within 1 population status category (lower plot), when estimated by the previously used maximum likelihood (ML) model and the new hierarchical Bayesian (HB3) model. BCRs are sorted in descending order of the ratio of the square root of sample size to area. These
Environment Canada. 2011. Status of Birds in Canada – 2011. Environment Canada, Ottawa,
Ontario, Canada. www.ec.gc.ca/soc-sbc.
Geissler, P. H., and B. R. Noon. 1981. Estimates of avian population trends from the North