Measuring the sensitivity of parameters estimates to evaluate the
tractive force model
S. O. Nkakini
(Department of Agricultural and Environmental Engineering, Rivers State University of Science and Technology, Port Harcourt, Nigeria) Abstract: Sensitivity measured parameters were used to evaluate a better tractive efficiency and tractor forward speeds. The predictive models for tractive force were developed using dimensional analysis. A disc ploughing tillage operations in a loamy sand soil, at tractor forward speeds of 1.94 m/s, 2.22 m/s and 2.5 m/s were conducted, using trace tractor techniques. The dependent and independent variables involved in the models were measured. The wheel tractors tractive force models have sensitivity coefficients ranging from -0.004394 to 2.353,-6.25E.05 to 1.0877 and -1.32E-07 to 1.00 for ploughing, with all the independent variables at 1,94 m/s,2.22 m/s and 2.5 m/s forward speeds respectively. The results obtained in this disc ploughing tillage operation showed that independent variable (U1) caused a negligible change in dependent variables (N). This shows that the sensitivity coefficients obtained in the developed predicted models as variables change are insignificants. Thus, sensitivity coefficients of the tractive force models developed fitted experimental data. Therefore the developed predicted models could be applied.
Keywords: Tractive force, predictive, disc ploughing, loamy, sand, soil, sensitivity measurement
Citation: S. O. Nkakini. 2015. Measuring the sensitivity of parameters estimates to evaluate the tractive force models. Agric Eng Int: CIGR Journal, 17(3): 43-60.
1 Introduction
1Agricultural operations must be carried out within a time frame to achieve maximum yield and operational efficiency (Sale et al., 2013). In the report of Ajav and
Adewoyin (2012), it was opined that profit making is critical to the success and sustainability of any business venture and it is pertinent that agricultural mechanization follow the same trend for a meaningful economic and environmental impact. Tillage is the mechanical
manipulation of the soil, for crop production in agriculture. A good tillage operation provides suitable soil pulverization (Nwokedi, 1992). Agricultural tillage involves soil cutting, turning and pulverization, therefore requires high tractive force to pull the tillage tool through the soil during tillage operations (Nkakini and Akor, 2012). Tillage is a practice that is significant to the soil
Received date: 2014-03-04 Accepted date: 2015-07-15 *Corresponding author: S. O. Nkakini, Department of Agricultural and Environmental Engineering, Rivers State University of Science and Technology, Port Harcourt, Nigeria. E-mail: [email protected]
quality, and has important effects on many soil characteristics (Ahaneku and Dada, 2013). The aim of tillage is to create a soil environment and good surface
configuration for favourable plant growth (Nail et al., 2007; Nkakini and Akor, 2013; Nkakini et al., 2008). Primary (ploughing) tillage is the initial reduction of soils strength which cuts deeper into the soil, leaving a rougher surface relative to secondary tillage operation.
Al-Suhaibani and Ghaly (2010) investigated the effect of ploughing depth and forward speed on the performance of a medium size chisel plow operating in a sandy soil and observed that ploughing depth and forward speeds affect the average fuel consumption for different kinds of farm tractors operating in the same zone. Traction is required
to pull the tillage tool through the soil during tillage operations. It is another name for grip. Grip is the driving force developed by a wheel. A wheel tyre generates tractive force by reacting (pushing) against the soil. The traction of the tyre is achieved by its good grip with the surface over which tractor moves. When
reduction in speed, which can be achieved by increasing traction (Ghosal and Das, 2008). Soil strength is often
represented by the cone index, CI, which is the average force per unit area required to force a cone –shape probe vertically into the soil at a steady rate. Cone index of agricultural soils is a very important factor that is measured in most tillage studies, and it indicates the resistance of soil to penetration. Fasinmirin and
Olorunfemi (2013) reported from the findings of other researchers that cone index of an agricultural soil affects the penetration of plant roots. Cone index is extensively used in assessing soil compaction (Canillas and Solakhe, 2012), soil traffic ability (Goering et al., 2003) and the effectiveness of tillage operations (Canarache, 1990).
Drawbar pull is the total thrust minus the total resistance to vehicle motion. It is the lateral forward force a wheel can develop when moving and indicates the force the wheel or the tractor can generate over the main force resisting to movement consisting of rolling, obstacle, slope steering resistances (Saarilahti, 2002).
The rolling resistance increases as a function of sinkage, being lower on hard surface and higher on softer soils (Saarilahti, 2002; Georing et al., 2003).
The operational parameters such as depth and speed influence draft and energy requirements of tillage implements. The relationship between draft and speed
has been reported as linear, second-order polynomial, parabolic and exponential by some researchers. Ale et al. (2013) reported a polynomial relationship between speed and draught and stated that draught increased in forward speed of the tractor, and later decreased with
increase in forward speed at average moisture content of 4.9%.
Likewise according to the reports of Al-Janobi and Al-Suhaibani(1998) the effect of depth on draught, also varies linearly, while the effect of speed on draught shows increases with increase in speed in most of the
tillage implements. This may be due to rapid acceleration of any soil that is moved appreciably.
According to Yousef et al. (2006) the draught force increased as the forward speed increased in all soil types.
However, the tillage depth had the greatest effect on the draught and drawbar power than the tractor forward speed (Ahaneku et al., 2011). Tractive force, plays a vital role in tillage operations, therefore the need to determine the appropriate tractive force models becomes necessary in order to balance the variables in operations (Nkakin and
Fubara-Manuel, 2012; Nkakini and Douglas, 2013). Tractive force is the force measured in the drawbar of a tractor. The tractive effort of a vehicle, otherwise known as tractive force refers to the pulling or pushing force that a vehicle holds. This is the force that allows a vehicle to move forward. Thrust (gross tractive effort,
gross traction, traction and wheel torque) is a friction force between a tyre and soil or the grip a tyre can generate from the soil surface to overcome the forces resisting the movement. The prediction of tractive force is an essential part of the requirements for vehicle performance stimulation (Young et al., 1984).
Thangaradivelu and Colvin (1990) and Nkakini and Douglas (2013) reported in their findings, that field operations is largely affected by the moisture content and traffic ability of the field in question.
If the soil moisture is too high, working the soil leads to paddling compaction, soil deterioration and
reduction in soil quality. For mechanised operations, this leads to increasing wheel slip, traction and time spent in tillage. This research has much of its roots in the need for improving the energy- efficiency, and tractive performance of agricultural tractor in field operations. It
is necessary to be able to predict how a machine and implements perform a given task under a given condition. Thus, the need to improve on the efficiency of tillage operations in order to increase productivity in mechanized agriculture becomes obvious. Such positive effects can only be realized through the use of appropriate
contact pressure and tractor operational speeds of the earlier tillage models which do not include variables such
as, depth and width of cuts.
The assessment of developed models for field operations using sensitivity analysis is important in creating a condition that allows for the optimization of the involved variables (Nkakini, 2014). The developed tractive force models were verified using sensitivity of
measured parameters. Hence, sensitivity analysis of any developed model makes the relative role of each variable to that model known. This is done by taking notice of the change of dependent variable in the model with respect to the change in each of the several independent variables (Simonyan, 2006). Sensitivity measured
parameters, is defined as the rate of change in the output of the model with respect to the change in the value of the parameter while keeping other parameters constant (Nkakini, 2014). In recent years the sensitivity analysis of ordinary differential equations (ODES) and
differential-algebraic equations (DAES ) have attracted
much research (Eberhard and Bischop, 1999; Li et al., 2000). The principal motivation comes from mathematical models used to investigate physical phenomena where some parameters may not be accurately known and, therefore, sensitivity analysis becomes a useful tool (Roberto,2006).
Dynamic traction ratio (DTR) was predicted using the Brixius (1987). Gonzalez et al. (2004) used Brixius model to predict traction of heavy sugarcane machinery. Empirical methods for traction performance modeling are mainly based on the soil cone index (CI) as the single soil
strength parameter to be measured. Semi- empirical model was used for predicting tractive and motion resistance forces, but has limited practical application (Georing et al., 2006). Canillas and Salokhe (2001) developed a soil compaction prediction equations using regression analysis. Dimensional analysis has been used
for prediction of the traction driving force for a wheel moving on a soil. Kazam and Alper (2012) used artificial neural network (ANN) model and non-linear
regression analysis to investigate the relationship between input parameter(travel reduction) and output parameters
(net traction ratio and tractive efficiency). It was found that the ANN model consistently gave better predictions compared to the non linear regression-based model. The objective of the study is to evaluate the degree at which developed tractive force models change to varying independent variables in ploughing operation
using sensitivity analysis, optimising the variables.
2 Materials and methods
2.1 Description of site
Experiments were conducted in the field (in-situ) using trace tractor technique. It was conducted at National Root Crops Research Institute (NRCRI) experimental farm, in Umudike, Umuahia, Abia State of
Nigeria. Umudike is under the derived tropical humid ecological zone of Nigeria, and is 122 m above sea level and lies on latitude 050 291N and longitude 070 331E. Soil particle size distribution analysis showed the soil to be loamy sand (clay-11.04%, silt-4% and sand-84.96%.
2.2 Experimental procedure
The parameters: cone index, tractive force, drawbar pull, rolling resistance, wheel slip, moisture content, speed, width and depth of plough were determined using two tractors of the Massey Ferguson
435 is of model: P4000, Gross Power: 72 hp:52.7 kw,PTO power:62.5hp:46.6kw, operating weight : 2870 kg,tyre type/size : 8 ply rating, front 12.4-24 rear 18.4-30, cone penetrometer having an enclosed angle of 300, with a base area of 323mm2 mounted on a shaft of 2.03mm, EDjunior Dynamometer 0-10,000ibf/5000kgf ID No.
OEDJ1510046, measuring tape, disc plough : 3furrows weight,2950 kg, Model: N4D-26F, auger, stop watch and instrument for measuring weight of tractor (static hydraulic press). All field tests were conducted in a loamy sand soil for which the physical properties were determined. Prior to the starting of field experiment,
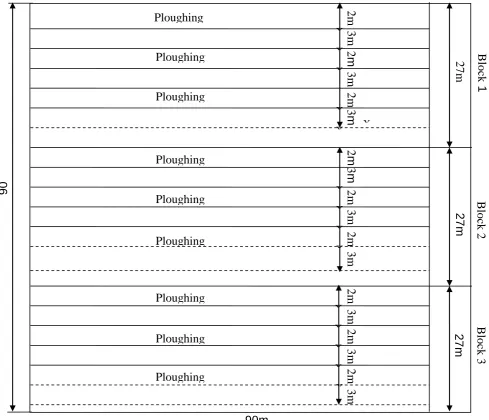
block was divided into 9(nine) strips of 90 m by 2 m wide with a space of 3m between each strip. Disc ploughing
operation was carried out on each of the blocks twenty four (24) hours after each rainfall event. Three replications of ploughing operations were conducted after every rainfall event. There were altogether 20 rainfall events. Therefore, the total treatments were 9x20 rainfall events. The order of tillage operation was:
Rainfall event 1, disc ploughing on block 1, strip 1; block 2, strip 1; and blocks 3, strips 1. Rainfall event 2, disc
plough on block 1, strip 2; block 2 strip 2 and block 3 strip 2. Rainfall event 3, disc plough on block 1 strip 3; block 2 strip 3 and block 3, strip 3. This pattern was followed for the remaining days up to the last day when minimum moisture content was achieved.
27m
27m
27m
90m
90
m
B
lock
1
B
lock 2
B
lock 3
Ploughing
Ploughing
Ploughing
2m
3m
3m
2
m
Ploughing
Ploughing
Ploughing
Ploughing
Ploughing
Ploughing
Figure 1 Experimental field layout
2m
3
m
2
m
3
m
3m
2m
2m
3m
2m
3m
3m
2m
2m
3m
Soil data were collected to the depths of 50 mm, 150 mm and 200 mm respectively using soil auger, core sampler
and a hand-operated soil cone penetrometer (ASAE, 2001) having an enclosed angle of 300, with a base area of 323 mm2 mounted on a shaft of 2.03 mm for the determination of moisture content, bulk density and soil resistance before tillage operation. During the sampling process, cone penetrometer was positioned between the operator’s two legs and pressed down the soil until the
marked point on the shaft was reached, before readings were taken. The bulk density was measured using core sampler. Soil moisture content was determined using gravimetric method (oven dry method). The tractor wheel load was measured using static hydraulic press.
The tractor with mounted disc plough implement was driven into station’s weighing platform (single point load
cell) positioned with its rear wheels and weighed. The record was taken and recorded. This is the static load. The dynamic load was measured as the tractor was put in motion with and without disc plough implement mounted
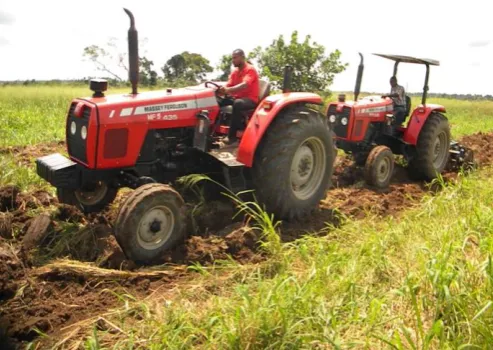
on the tractor and the weight taken and recorded respectively. However, in this study, static load was used in computation for purpose of accuracy. The towing force and drawbar-pull forces were determined using trace- tractor technique. (Appendix E, shows the measured parameters and predicted tractive forces).
That is, two Massey Ferguson 435 model tractors of 72- horse power (hp) were used. The tractor carrying the implement with its engine disengaged (neutral gear) was coupled to another tractor which towed it with the
dynamometer in between them. The first tractor pulled the second tractor coupled to the implement (disc plough).
The dynamometer reading was taken to determine the towing force. The drawbar-pull force was the difference between the towing force in neutral gear without implements in tillage operation and towing force when the implement was engaged in tillage operations. Width and depth of cuts were measured with a steel tape. The
speeds of operations were obtained by setting the tractor at a suitable gears of a gear reduction unit for targeted speed of 1.94 m/s a negligible change, 2.22 m/s and 2.5 m/s. Simultaneously, the time taken to cover a fixed distance of 90 m was recorded using a stopwatch to calculate the operating speed of the tractor and implement
combination. Figure 2 shows the tractor-dynamometer, tractor-implement combination in action.
Figure 2 A photograph depicting tractor- dynamometer, implement mounted position during disc ploughing
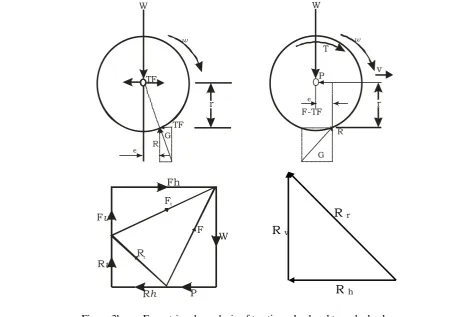
Dv = Pull of the implement upon the tractor, Dx =
Horizontal Component of D
Dz = Vertical Component of D, Rf & Rr = Vertical
support soil reactions upon the front and rear wheels
respectively, Te = Tractive effort of the tractor, Wt =
Force of gravity on the tractor contributed by the weight, r = Rolling radius, M = Motion Resistance
Figure 3a Depicts the force diagram of implement mounted position during disc ploughing operations
r
TF W
TF
G R
w
e
r v
P T
F-TF W
G R
w
e
Fv
Rv
Rh
Rt
P F Ft
Fh
W
Figure 3b Force triangle analysis of traction wheel and towed wheel (Source: Ghosal and Das, 2008)
R r
R v
2 Theory
There is the need to identify accurate parameters
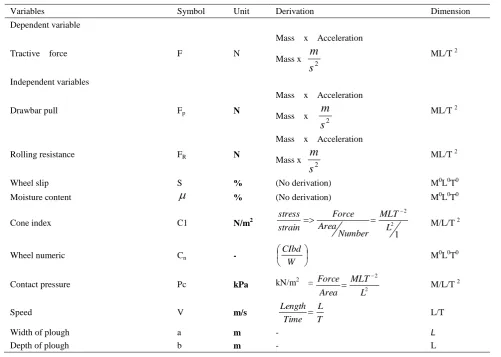
that represent the soil and device factors to determine the functional relations between the parameters. Table 1
shows the dependent and independent variables involved in traction determination and their units, derivations and
basic dimensions,
3 Model development
In evaluating the traction requirements of a driven wheel tractor, the soil-wheel interactions were considered.
The mathematical tool employed in this work was dimensional analysis.
3.1 Theoretical background of dimensional analysis
Dimensional analysis is a mathematical tool used for balancing the fundamental dimensions, mass, length and time (Banga et al., 1991). Buckingham’s theory is based
on the knowledge that if there are n basic dimensions and m variables, then there are n-m dimensionless parameters. Basic dimensions are mass (M), length (L) and time (T)
Sn = n - b (1)
where, Sn = the number of Pi terms, n = the total number of variables, b = the number of basic
dimensions.
The pertinent variables that affect the traction performance of the wheel tractor in loamy sand soil during tillage are twelve variables, which are presented in Table 1 with their corresponding dimensions. Among which are three dimensionless parameters: moisture
content
, wheel slip S and wheel numeric Cn.Thus, traction force F, may be expressed as a function of the other seven variables
F
F
CI
Pc
V
a
b
f
F
p,
R,
,
,
,
,
(2)This equation may be re-written as
Table 1 Variables affecting traction requirement
Variables Symbol Unit Derivation Dimension
Dependent variable
Tractive force F N
Mass x Acceleration Mass x 2
s
m
ML/T 2Independent variables
Drawbar pull Fp N
Mass x Acceleration Mass x
2
s
m
ML/T 2Rolling resistance FR N
Mass x Acceleration Mass x
2
s
m
ML/T 2Wheel slip S % (No derivation) M0L0T0
Moisture content
% (No derivation) M0L0T0Cone index C1 N/m2
1
2 2
L MLT
Number Area
Force strain
stress
M/L/T 2
Wheel numeric Cn -
W CIbd
M0L0T0
Contact pressure Pc kPa kN/m2 =
2 2
L MLT Area
Force
M/L/T 2
Speed V m/s
T L Time Length
L/T
Width of plough a m - L
F
,
F
F
,
CI
,
Pc
,
V
,
a
,
b
0
f
p R (3)Therefore the number of variables are, n = 8, but since the
basic dimensions are
MLT, = 3. Then, number of dimensionless - terms,
will be
Sn = n – b Sn = 9 – 3 = 5
Hence, five
i - terms say, 1, 2, 3, 4, and 5 will begenerated.
Thus, F = f (1, 2, 3, 4, 5 ) (4)
where f = functional notation for traction force
The Equation (4) may be written as f1 (1, 2, 3, 4, 5)
= 0 (5)
3.2 Determination of -Terms
From Equation (5) above, five -terms (1, 2, 3, 4
and 5) are required to develop a general prediction
equation for traction force in wheel-tractor tillage operation (ploughing), on loamy sand soil.
The repeating variables involved are cone index (CI), tractor forward speed (V), and width of plough (a). According to Tarham and Carman (2004) the repeating variables themselves should not form a dimensionless term. They must contain jointly all fundamental dimensions equal to “b” number of basic dimensions.
And also no dimensionless group is formed by them
(Barenblat, 1987).
CI = M/L/T2, V = L/T1, a = L
Each - term, is b + 1 variables and is written as
F
a
V
C
a
b
c
1 1 11
1
(6a)p c b a
F
a
V
C
2 2 22
1
(6b)R c b a
F
a
V
C
3 3 33
1
(6c)c c b a
P
a
V
C
4 4 44
1
(6d)b
a
V
C
a
b
c
5 5 55
1
(6e)Wheel slip (s), wheel numeric Cn and moisture
content are already dimensionless hence excluded from
the dimensionless terms determination exercise, but to be added when the other dimensionless terms had been
formed.
After transformation some existing -terms were
eliminated, then dimensionless pi terms obtained are as follows:
s
a
CI
S
C
b
P
F
F
F
R c np
1
,
2
2 3,
3
The developed tractive force models for ploughing at different tractor forward speeds after substituted coefficients are:
For ploughing at 1.94 m/s
,
334
.
2
145
.
3
001457
.
0
72
.
4489
2 3p n c R p
F
s
Fp
a
CI
S
C
b
P
F
F
F
(7)For ploughing at 2.22 m/s
p p n c R p
F
s
F
a
CI
S
C
b
P
F
F
F
15259
.
1
000543
.
0
309
.
2
1
.
3322
2 3
(8)For ploughing at 2.5 m/s
p p n c R p
F
s
F
a
CI
S
C
b
P
F
F
F
433855
.
2
8405
.
0
000297
.
0
419
.
1151
2 3
(9)The concept of sensitivity measured parameters, as applied generally according to the theories of Mc Cueu, (1973) as reported by Simonyan (2006), is defined as the
rate of change in the output of the model with respect to the change in the value of the parameter while keeping other parameters constant. Sensitivity analysis was done by mathematically differentiating the developed models (7, 8 and 9) using error equation whereby Equation (10) was obtained as below.
N = 1 1
1
.
U
N
U
u
N
(10)
The bracketed terms become dimensionless
the models solutions. Calculation of sensitivity equation (also called error equation) is in Appendix A.
4 Results and discussion
Analyses of variances were conducted to find out if there are significant differences between tractive forces
and tractor forward speeds during ploughing operations.
Table 2 shows existence of the relationship between the measured forces and various tractor forward speeds of 1.94 m/s, 2.22 m/s and 2.5 m/s during ploughing operations. There is highly significant difference (p≤0.05)
between the measured forces at different tractor forward speeds. That is an indication that different tillage speeds will produce different forces, thus force is the dependant of tractor forward speed.
These tables, shows the statistical significance comparism on forces at different tractor forward speeds of 1.94 m/s,
2.22 m/s, 1.94 m/s and 2.5 m/s respectively. Tables 3-5, depicted the regression of forces on the various tractor forward speeds during ploughing operations. The analysis of variance between tractive forces and their
respective three forward speeds indicated no significant differences (p<0.05) between them. However,
coefficient of determinations of R2=0.5845 for ploughing at 1.94 m/s R2=0.5774, ploughing at 2.22 m/s and R2=0.5758, ploughing at 2.5 ms1 became clear that the best forward speed for ploughing operation is 1.94 m/s
Table 2 Analysis of variance for combined measured forces on various ploughing forward speeds
of 1.94m/s, 2.22m/sand 2.5m/s
Source of Variation SS df MS F P-value F crit
Between Groups 45335126 2 22667563 30.58463 9.46E-10 3.158843 ** highly significant
Within Groups 42245105 57 741142.2
Total 87580231 59
Fcal>Fcrit: P<0.05
Table 3 Analysis of variance between tractive force and ploughing forward speed of 1.94 m/s Source of
Variation df SS MS F P-value Significance F
Regression 1 0.080247 0.080247 25.31789 1.53E-05 8.67E-05 NS
Residual 18 0.057052 0.00317
Total 19 0.137299
Fcal>Fcrit: P<0.05 R2 = 0.5844
Table 4 Analysis of variance between tractive force and ploughing forward speed of 2.22 m/s Source of
Variation df SS MS F P-value Significance F
Regression 1 0.081949 0.081949 24.60286 2.03E-05 0.000101 NS
Residual 18 0.059956 0.003331
Total 19 0.141905
Fcal>Fcrit: P<0.05 R2=0.5774
Table 5 Analysis of variance between tractive force and ploughing forward speed of 2.25 m/s Source of
Variation df SS MS F P-value Significance F
Regression 1 0.087313 0.087313 24.43939 2.38E-05 0.000105 NS
Residual 18 0.064308 0.003573
Total 19 0.151621
having the highest value of coefficient of determination R2=0.5845.
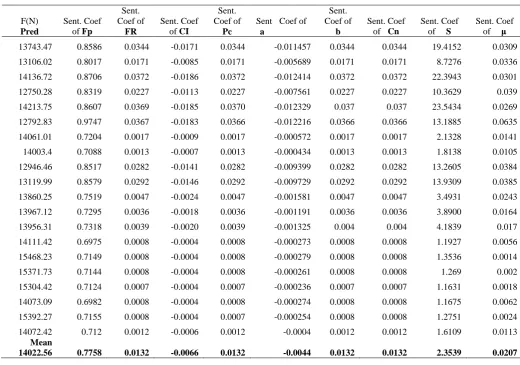
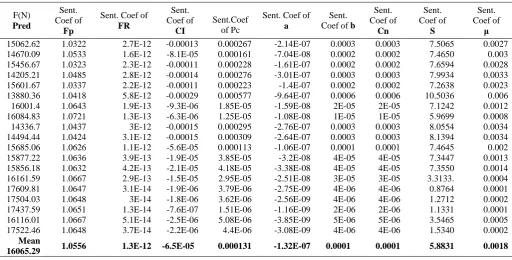
The sensitivity coefficients of the field measured parameters to the wheel tractor tractive force model were determined. Tables 6-8, depicted the predicted tractive forces (F(N) Pred), independent variables and their respective sensitivity coefficients. The sensitivity coefficient showed their rate of changes in the predicted
models with respect to changes in the parameters while
keeping other parameters constant. The Tables also shows the means values of sensitivity coefficients for
each of the independent variables for ploughing at various tractor forward speeds. The results so far obtained, depicted consistence low sensitivity coefficient values in the three tractor forward speeds. This indicates that the tractive force models developed fitted experimental data. The differences in the mean values of sensitivity
coefficient are though not significant
Table 6 Sensitivity coefficients of independent variables to the rate of change to tractive force as other variables remains constant at 1.94 m/s
F(N) Pred
Sent. Coef of Fp
Sent. Coef of
FR
Sent. Coef of CI
Sent. Coef of
Pc
Sent Coef of a
Sent. Coef of
b
Sent. Coef of Cn
Sent. Coef of S
Sent. Coef of μ 13743.47 0.8586 0.0344 -0.0171 0.0344 -0.011457 0.0344 0.0344 19.4152 0.0309
13106.02 0.8017 0.0171 -0.0085 0.0171 -0.005689 0.0171 0.0171 8.7276 0.0336 14136.72 0.8706 0.0372 -0.0186 0.0372 -0.012414 0.0372 0.0372 22.3943 0.0301 12750.28 0.8319 0.0227 -0.0113 0.0227 -0.007561 0.0227 0.0227 10.3629 0.039 14213.75 0.8607 0.0369 -0.0185 0.0370 -0.012329 0.037 0.037 23.5434 0.0269 12792.83 0.9747 0.0367 -0.0183 0.0366 -0.012216 0.0366 0.0366 13.1885 0.0635 14061.01 0.7204 0.0017 -0.0009 0.0017 -0.000572 0.0017 0.0017 2.1328 0.0141 14003.4 0.7088 0.0013 -0.0007 0.0013 -0.000434 0.0013 0.0013 1.8138 0.0105 12946.46 0.8517 0.0282 -0.0141 0.0282 -0.009399 0.0282 0.0282 13.2605 0.0384 13119.99 0.8579 0.0292 -0.0146 0.0292 -0.009729 0.0292 0.0292 13.9309 0.0385 13860.25 0.7519 0.0047 -0.0024 0.0047 -0.001581 0.0047 0.0047 3.4931 0.0243 13967.12 0.7295 0.0036 -0.0018 0.0036 -0.001191 0.0036 0.0036 3.8900 0.0164 13956.31 0.7318 0.0039 -0.0020 0.0039 -0.001325 0.004 0.004 4.1839 0.017 14111.42 0.6975 0.0008 -0.0004 0.0008 -0.000273 0.0008 0.0008 1.1927 0.0056 15468.23 0.7149 0.0008 -0.0004 0.0008 -0.000279 0.0008 0.0008 1.3536 0.0014 15371.73 0.7144 0.0008 -0.0004 0.0008 -0.000261 0.0008 0.0008 1.269 0.002 15304.42 0.7124 0.0007 -0.0004 0.0007 -0.000236 0.0007 0.0007 1.1631 0.0018 14073.09 0.6982 0.0008 -0.0004 0.0008 -0.000274 0.0008 0.0008 1.1675 0.0062 15392.27 0.7155 0.0008 -0.0004 0.0007 -0.000254 0.0008 0.0008 1.2751 0.0024 14072.42 0.712 0.0012 -0.0006 0.0012 -0.0004 0.0012 0.0012 1.6109 0.0113
Mean
The results obtained in this disc plough tillage operations, indicated sensitivity coefficients within the range of -0.004394 to 2.353, -6.35E-05 to 1.0877 and -1.32E-07 to 1.00 at forward speeds of 1.94 m/s, 2.22 m/s and 2.5 m/s respectively. It becomes clear that changes
in independent variables (U1) caused negligible changes
in predicted tractive forces (F(N) Pred). These indicate that the sensitivity of developed predicted model to changes in the constituent independent variables is negligible and insignificant.
Table 7 Sensitivity coefficients of variables to the rate of change to tractive force as other variables remains constant at 2.22 m/s
F(N) Pred
Sent. Coef of
Fp
Sent. Coef of FR
Sent. Coef of
CI
Sent. Coef of Pc
Sent. Coef of
a
Sent. Coef of
b
Sent. Coef of
Cn
Sent. Coef of
S
Sent. Coef of
μ 14108.88 0.7951 0.00039 -0.0002 0.000394 -0.000131 0.0004 0.0004 22.54808 0.0143 13743.57 0.7914 0.00023 -0.00012 0.00023 -7.67E-05 0.0002 0.0002 12.18837 0.0155 14485.09 0.7999 0.00035 -0.00017 0.000349 -0.000116 0.0003 0.0003 21.20892 0.0139 13342.23 0.7912 0.00042 -0.00021 0.000425 -0.000142 0.0004 0.0004 20.14012 0.0182 14630.05 0.7988 0.00032 -0.00016 0.000316 -0.000105 0.0003 0.0003 20.43567 0.0124 13012.1 0.8155 0.00083 -0.00042 0.000832 -0.000277 0.0008 0.0008 30.25029 0.0308 14994.18 0.7907 2.6E-05 -1.3E-05 2.59E-05 -8.65E-06 3E-05 3E-05 3.413255 0.0061 15074.57 0.7886 1.8E-05 -9.2E-06 1.85E-05 -6.16E-06 2E-05 2E-05 2.751812 0.0045 13442.39 0.7933 0.00049 -0.00025 0.000491 -0.000164 0.0005 0.0005 23.30543 0.0183 13587.83 0.7951 0.00046 -0.00023 0.00046 -0.000153 0.0005 0.0005 22.37387 0.0181 14707.02 0.796 8.8E-05 -4.4E-05 8.75E-05 -2.92E-05 9E-05 9E-05 6.786779 0.0107 14882.84 0.7913 5.8E-05 -2.9E-05 5.78E-05 -1.93E-05 6E-05 6E-05 6.63769 0.0072 14863.43 0.7915 6.1E-05 -3.1E-05 6.12E-05 -2.04E-05 6E-05 6E-05 6.799479 0.0074 15142.26 0.7853 6.4E-06 -3.2E-06 6.43E-06 -2.14E-06 6E-06 6E-06 0.998688 0.0024 16512.64 0.7999 5.5E-06 -2.7E-06 5.48E-06 -1.83E-06 5E-06 5E-06 0.93724 0.0006 16412.97 0.7992 5.2E-06 -2.6E-06 5.24E-06 -1.75E-06 5E-06 5E-06 0.900777 0.0009 16349.72 0.7982 6.3E-06 -3.1E-06 6.25E-06 -2.08E-06 6E-06 6E-06 1.087907 0.0008 15100.00 0.7853 1.1E-05 -5.5E-06 1.1E-05 -3.68E-06 1E-05 1E-05 1.670244 0.0027 16430.84 0.7997 6.5E-06 -3.2E-06 6.47E-06 -2.16E-06 6E-06 6E-06 1.143585 0.001 15056.59 0.7891 1.8E-05 -8.9E-06 1.78E-05 -5.95E-06 2E-05 2E-05 2.541234 0.0049
Mean
14793.96 0.7948 0.0002 -9.5E-05 0.0099 -6.35E-05 0.0002 0.0002 1.0877 0.0095
Table 8 Sensitivity coefficients of independent variables to the rate of change to tractive force as other variables remains constant at 2.5 m/s
F(N) Pred
Sent. Coef of
Fp
Sent. Coef of FR
Sent. Coef of
CI
Sent.Coef of Pc
Sent. Coef of a
Sent. Coef of b
Sent. Coef of
Cn
Sent. Coef of
S
Sent. Coef of
μ 15062.62 1.0322 2.7E-12 -0.00013 0.000267 -2.14E-07 0.0003 0.0003 7.5065 0.0027 14670.09 1.0533 1.6E-12 -8.1E-05 0.000161 -7.04E-08 0.0002 0.0002 7.4650 0.003 15456.67 1.0323 2.3E-12 -0.00011 0.000228 -1.61E-07 0.0002 0.0002 7.6594 0.0028 14205.21 1.0485 2.8E-12 -0.00014 0.000276 -3.01E-07 0.0003 0.0003 7.9934 0.0033 15601.67 1.0337 2.2E-12 -0.00011 0.000223 -1.4E-07 0.0002 0.0002 7.2638 0.0023 13880.36 1.0418 5.8E-12 -0.00029 0.000577 -9.64E-07 0.0006 0.0006 10.5036 0.006 16001.4 1.0643 1.9E-13 -9.3E-06 1.85E-05 -1.59E-08 2E-05 2E-05 7.1242 0.0012 16084.83 1.0721 1.3E-13 -6.3E-06 1.25E-05 -1.08E-08 1E-05 1E-05 5.9699 0.0008 14336.7 1.0437 3E-12 -0.00015 0.000295 -2.76E-07 0.0003 0.0003 8.0554 0.0034 14494.44 1.0424 3.1E-12 -0.00015 0.000309 -2.64E-07 0.0003 0.0003 8.1394 0.0034 15685.06 1.0626 1.1E-12 -5.6E-05 0.000113 -1.06E-07 0.0001 0.0001 7.4645 0.002 15877.22 1.0636 3.9E-13 -1.9E-05 3.85E-05 -3.2E-08 4E-05 4E-05 7.3447 0.0013 15856.18 1.0632 4.2E-13 -2.1E-05 4.18E-05 -3.38E-08 4E-05 4E-05 7.3550 0.0014 16161.59 1.0667 2.9E-13 -1.5E-05 2.95E-05 -2.51E-08 3E-05 3E-05 3.3133. 0.0004 17609.81 1.0647 3.1E-14 -1.9E-06 3.79E-06 -2.75E-09 4E-06 4E-06 0.8764 0.0001 17504.03 1.0648 3E-14 -1.8E-06 3.62E-06 -2.56E-09 4E-06 4E-06 1.2712 0.0002 17437.59 1.0651 1.3E-14 -7.6E-07 1.51E-06 -1.16E-09 2E-06 2E-06 1.1331 0.0001 16116.01 1.0667 5.1E-14 -2.5E-06 5.08E-06 -3.85E-09 5E-06 5E-06 3.5465 0.0005 17522.46 1.0648 3.7E-14 -2.2E-06 4.4E-06 -3.08E-09 4E-06 4E-06 1.5340 0.0002
Mean
Conclusions
In conclusion, the sensitivity coefficients of the predicted tractive forces models parameters for disc ploughing at forward speeds of 1.94 m/s, 2.2 m/s and 2.5 m/s showed negligible insignificant changes. Deducing from the insignificant values of sensitivity coefficients, is an indication that the best forward speed for disc
ploughing is 1.94 m/s in loamy sand soil. From the discussion above it is conclusive that the tractive force models developed in this work are reasonably valid to characterise the tillage tractive efficiency of disc ploughing operations under various tractor forward
speeds.
Appendix A
Below is the detailed calculation of sensitivity equation (also called error equation) is developed for a function using
N = f (U1, U2 …. Un) (10)
where
N = dependent variable
U
1,
U
2,...,
U
n
= Independent variable Using Taylor’s TheoremWe differentiate the independent function
U
U
U
U
U
nU
n
f
N
N
1
1,
2
2,
...
(11) Taylor’s theorem says
a
f
a
hf
1(
a
)
f
N
f
U
U
U
n
hf
U
U
U
n
f
,
...
1,
2...
1 2
1
(12) Using function of functions method equation (13) is obtained.
N = n
n
U
u
N
U
u
N
U
u
N
2 2 1 1
,
(13)N =
Ni
n
i
1
Then applying Taylor’s theorem and neglecting squares, products, higher powers and also not considering other variables when discussing one variable causes other variables to be zero, hence,
N = 2
.
2 1
1
U
u
N
U
u
N
(14)
Relative changes or error was defined as follows
N =
N
N
(15)
u =
U
u
(16)
Putting Equation (14) into Equation (15) we obtained equation below.
N
U
U
N
N
U
N
N
U 2 2 1.
.
1
(17)N =
2 2
2 1 1 1
.
.
U
N
U
u
N
U
N
U
u
N
(18) This expresses relative changes of each independent variables Un, with respect to the relative dependentvariable. If the error or change that occurs in only one
variable is considered, all the other terms would be zero i.e. only one variable causes others to become zero.
Therefore, N = 1 1
1
.
U
N
U
u
N
(19)
The bracketed terms become dimensionless coefficient, which expresses the percentage of the relative change of each independent variable, transmitted to the relative dependent variable. This is the sensitivity
coefficient which shows the relative importance of each of the variables to the models solutions.
Appendix B
The developed and the calculated sensitivity equations for the tractive force developed models are shown as:
For ploughing at 1.94 m/s
p p R p
F
s
F
a
CI
Cns
b
Pc
F
F
F
3343
.
2
145007
.
3
00145708
.
0
715
.
4489
2 3
(1)3343
.
2
145007
.
3
00145708
.
0
2 3
s
R
p
CI
a
CnS
Pcb
F
dF
dF
(2)
0
.
00145708
2 3a
CI
CnS
Pcb
F
dF
dF
p R
(3) 3 3
2
00145708
.
0
a
CI
CnS
Pcb
F
F
dCI
dF
R p
(4) 3 200145708
.
0
a
CI
CnS
b
F
F
dP
dF
R p c
(5) 4 23
00145708
.
0
a
CI
CnS
Pcb
F
F
da
dF
R p
(6) 3 200145708
.
0
a
CI
CnS
Pc
F
F
db
dF
R p
(7) 3 200145708
.
0
a
CI
S
Pcb
F
F
dCn
dF
R p
(8) p R pF
a
CI
PcbCn
F
F
ds
dF
145007
.
3
00145708
.
0
2 3
(9)
F
S
d
dF
p145007
.
3
Appendix CFor ploughing at 2.2 m/s
p p R p
F
s
F
a
CI
CnS
b
Pc
F
F
F
309034
.
2
152594
.
1
000543
.
0
1
.
3322
2 3
(1)309034
.
2
152594
.
1
000543
.
0
2 3
S
a
CI
CnS
Pcb
F
dF
dF
R p
(2)
0
.
000543
2 3a
CI
CnS
Pcb
F
dF
dF
p R
(3) 3 3
(9)
F
S
d
dF
p152594
.
1
Appendix DFor ploughing at 2.5 m/s
p p
R
p
F
S
F
a
CI
CnS
Pcb
F
F
F
1151
.
42
0
.
000297
2 3
0
.
841
2
.
434
(1)
434
.
2
841
.
0
000297
.
0
2 3
S
a
CI
CnS
Pcb
F
dF
dF
R p
(2)
0
.
000297
2 3a
CI
CnS
Pcb
F
dF
dF
p R
(3) 3 32
000297
.
0
a
CI
CnS
Pcb
F
F
dCI
dF
R p
(4) 3 2000297
.
0
a
CI
CnS
b
F
F
dP
dF
R p c
(5) 4 23
000297
.
0
a
CI
CnS
Pcb
F
F
da
dF
R p
(6) 3 2000297
.
0
a
CI
CnS
Pc
F
F
db
dF
R p
(7) 3 2000297
.
0
a
CI
S
Pcb
F
F
dCn
dF
R p
(8) p R pF
a
CI
Cn
Pcb
F
F
s
d
dF
841
.
0
000297
.
0
2 3
(9)
F
S
d
dF
p184
.
0
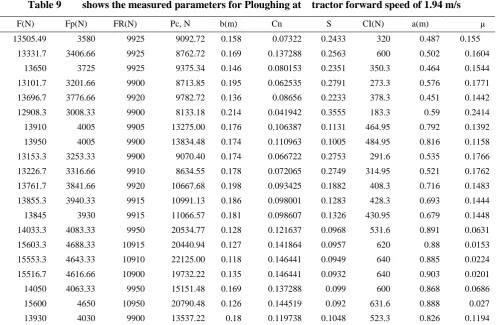
Appendix E
Table 9 shows the measured parameters for Ploughing at tractor forward speed of 1.94 m/s
F(N) Fp(N) FR(N) Pc, N b(m) Cn S CI(N) a(m) μ
13505.49 3580 9925 9092.72 0.158 0.07322 0.2433 320 0.487 0.155
13331.7 3406.66 9925 8762.72 0.169 0.137288 0.2563 600 0.502 0.1604
13650 3725 9925 9375.34 0.146 0.080153 0.2351 350.3 0.464 0.1544
13101.7 3201.66 9900 8713.85 0.195 0.062535 0.2791 273.3 0.576 0.1771 13696.7 3776.66 9920 9782.72 0.136 0.08656 0.2233 378.3 0.451 0.1442 12908.3 3008.33 9900 8133.18 0.214 0.041942 0.3555 183.3 0.59 0.2414 13910 4005 9905 13275.00 0.176 0.106387 0.1131 464.95 0.792 0.1392 13950 4005 9900 13834.48 0.174 0.110963 0.1005 484.95 0.816 0.1158 13153.3 3253.33 9900 9070.40 0.174 0.066722 0.2753 291.6 0.535 0.1766 13226.7 3316.66 9910 8634.55 0.178 0.072065 0.2749 314.95 0.521 0.1762 13761.7 3841.66 9920 10667.68 0.198 0.093425 0.1882 408.3 0.716 0.1483 13855.3 3940.33 9915 10991.13 0.186 0.098001 0.1283 428.3 0.693 0.1444 13845 3930 9915 11066.57 0.181 0.098607 0.1326 430.95 0.679 0.1448 14033.3 4083.33 9950 20534.77 0.128 0.121637 0.0968 531.6 0.891 0.0631 15603.3 4688.33 10915 20440.94 0.127 0.141864 0.0957 620 0.88 0.0153 15553.3 4643.33 10910 22125.00 0.118 0.146441 0.0949 640 0.885 0.0224 15516.7 4616.66 10900 19732.22 0.135 0.146441 0.0932 640 0.903 0.0201
14050 4063.33 9950 15151.48 0.169 0.137288 0.099 600 0.868 0.0686
15600 4650 10950 20790.48 0.126 0.144519 0.092 631.6 0.888 0.027
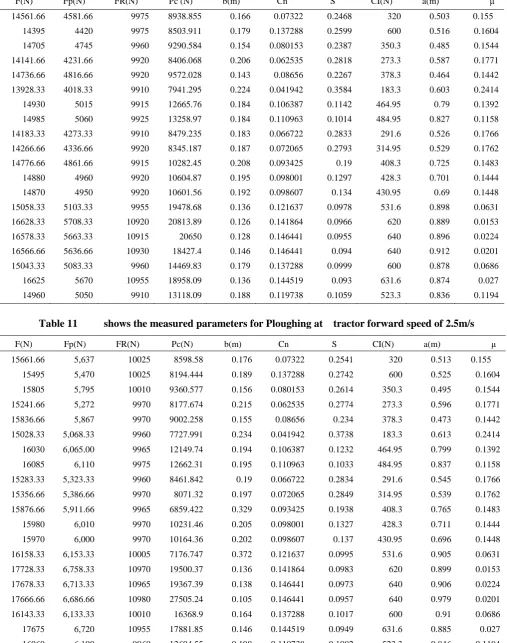
Table 10 shows the measured parameters for Ploughing at tractor forward speed of 2.2m/s
F(N) Fp(N) FR(N) Pc (N) b(m) Cn S CI(N) a(m) μ
14561.66 4581.66 9975 8938.855 0.166 0.07322 0.2468 320 0.503 0.155
14395 4420 9975 8503.911 0.179 0.137288 0.2599 600 0.516 0.1604
14705 4745 9960 9290.584 0.154 0.080153 0.2387 350.3 0.485 0.1544
14141.66 4231.66 9920 8406.068 0.206 0.062535 0.2818 273.3 0.587 0.1771 14736.66 4816.66 9920 9572.028 0.143 0.08656 0.2267 378.3 0.464 0.1442 13928.33 4018.33 9910 7941.295 0.224 0.041942 0.3584 183.3 0.603 0.2414
14930 5015 9915 12665.76 0.184 0.106387 0.1142 464.95 0.79 0.1392
14985 5060 9925 13258.97 0.184 0.110963 0.1014 484.95 0.827 0.1158
14183.33 4273.33 9910 8479.235 0.183 0.066722 0.2833 291.6 0.526 0.1766 14266.66 4336.66 9920 8345.187 0.187 0.072065 0.2793 314.95 0.529 0.1762
14776.66 4861.66 9915 10282.45 0.208 0.093425 0.19 408.3 0.725 0.1483
14880 4960 9920 10604.87 0.195 0.098001 0.1297 428.3 0.701 0.1444
14870 4950 9920 10601.56 0.192 0.098607 0.134 430.95 0.69 0.1448
15058.33 5103.33 9955 19478.68 0.136 0.121637 0.0978 531.6 0.898 0.0631 16628.33 5708.33 10920 20813.89 0.126 0.141864 0.0966 620 0.889 0.0153
16578.33 5663.33 10915 20650 0.128 0.146441 0.0955 640 0.896 0.0224
16566.66 5636.66 10930 18427.4 0.146 0.146441 0.094 640 0.912 0.0201
15043.33 5083.33 9960 14469.83 0.179 0.137288 0.0999 600 0.878 0.0686
16625 5670 10955 18958.09 0.136 0.144519 0.093 631.6 0.874 0.027
14960 5050 9910 13118.09 0.188 0.119738 0.1059 523.3 0.836 0.1194
Table 11 shows the measured parameters for Ploughing at tractor forward speed of 2.5m/s
F(N) Fp(N) FR(N) Pc(N) b(m) Cn S CI(N) a(m) μ
15661.66 5,637 10025 8598.58 0.176 0.07322 0.2541 320 0.513 0.155
15495 5,470 10025 8194.444 0.189 0.137288 0.2742 600 0.525 0.1604
15805 5,795 10010 9360.577 0.156 0.080153 0.2614 350.3 0.495 0.1544
15241.66 5,272 9970 8177.674 0.215 0.062535 0.2774 273.3 0.596 0.1771
15836.66 5,867 9970 9002.258 0.155 0.08656 0.234 378.3 0.473 0.1442
15028.33 5,068.33 9960 7727.991 0.234 0.041942 0.3738 183.3 0.613 0.2414 16030 6,065.00 9965 12149.74 0.194 0.106387 0.1232 464.95 0.799 0.1392
16085 6,110 9975 12662.31 0.195 0.110963 0.1033 484.95 0.837 0.1158
15283.33 5,323.33 9960 8461.842 0.19 0.066722 0.2834 291.6 0.545 0.1766 15356.66 5,386.66 9970 8071.32 0.197 0.072065 0.2849 314.95 0.539 0.1762 15876.66 5,911.66 9965 6859.422 0.329 0.093425 0.1938 408.3 0.765 0.1483
15980 6,010 9970 10231.46 0.205 0.098001 0.1327 428.3 0.711 0.1444
15970 6,000 9970 10164.36 0.202 0.098607 0.137 430.95 0.696 0.1448
16158.33 6,153.33 10005 7176.747 0.372 0.121637 0.0995 531.6 0.905 0.0631 17728.33 6,758.33 10970 19500.37 0.136 0.141864 0.0983 620 0.899 0.0153 17678.33 6,713.33 10965 19367.39 0.138 0.146441 0.0973 640 0.906 0.0224 17666.66 6,686.66 10980 27505.24 0.105 0.146441 0.0957 640 0.979 0.0201
16143.33 6,133.33 10010 16368.9 0.164 0.137288 0.1017 600 0.91 0.0686
17675 6,720 10955 17881.85 0.146 0.144519 0.0949 631.6 0.885 0.027
References
Ahaneku, I.E and O.A.Dada. 2013. Effect of different tillage methods and temporal factor on soil physical properties.
Journal of Agricultural and Engineering Technology, 21(2): 1-10.
Ahaneku, I.E., O.A Oyelade, and T Falaye. 2011. Comparative field evaluation of three models of tractor. In Proceedings of Nigerian Branch of the International soil tillage Research Organization (ISTRO) :( 93). University of Ilorin, Ilorin, Nigeria.
Ajav, E.A and A.O.Adewoyin. 2012. Effect of ploughing depth and speed on tractor fuel consumption in a sandy loam soil of Oyo State Nigeria. Journal of Agricultural Engineering and Technology, 20(2): 1-10.
Ale, M.O., O.C.Ademosun, , S.I.Manuwa, , L.A.S.Agbetoye, , A Adesina, and T Ewetumo,. 2013. Assembly and performance evaluation of the instrumentation system of a soil bin for tillage study. In Proceedings of The International Conference and 34th Annual General Meeting of the Nigerian Institution of Agricultural Engineers Uyo,
21st-24th October, 2013.(34): 84-91.
Al-Janobi, A. A. and S. A Al-Suhaibani. 1998. Draft of Primary tillage implements in Sandy loam soil. Applied Engineering In Agriculture 14:(4) 343 –348.
Al-Suhaibani, S.A and A.E Ghaly,. 2010. Effect of ploughing depth of tillage and forward speed on the performance of a medium size chisel plow operating in a sandy soil.
American Journal of Agricultural and Biological Sciences,
5(3):247-255.
ASAE. 2001. Soil cone penetrometer . ASAE S313.2,847.St.Joseph, .I. ASAE. 310.
Banga,T. R., B.P Makker, and S. C Sharma. 1991. Hydraulics Fluid Mechanics and Hydraulic Machines. Khanna Publishers 2 – B Nath Market, Nai Sarak DELHI – 110006, INDIA.
Barenblat, G. I. 1987. Dimensional Analysis 2nd Ed. New York: Cordon an Breach Science Publishers.
Brixius, W. W. 1987. Traction Prediction Equation for bias ply tires. ASAE Paper No. 87-1622. St. Joseph, Mich, ASAE.
Canarache, A. 1990. Penetr- A Generalized Semi-Empirical model estimating soil resistance to penetration. Soil and Tillage Research. 16:51-70.
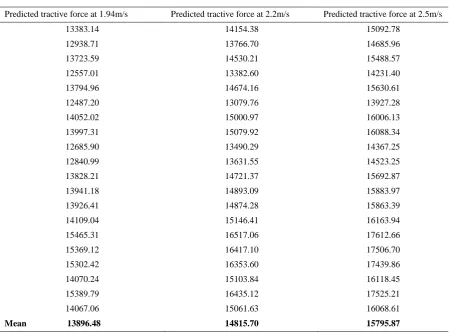
Table 12 shows the predicted tractive forces in ploughing operations at forward speeds of 1.94 m/s, 2.2 m/s, and 2.5 m/s
Predicted tractive force at 1.94m/s Predicted tractive force at 2.2m/s Predicted tractive force at 2.5m/s
13383.14 14154.38 15092.78
12938.71 13766.70 14685.96
13723.59 14530.21 15488.57
12557.01 13382.60 14231.40
13794.96 14674.16 15630.61
12487.20 13079.76 13927.28
14052.02 15000.97 16006.13
13997.31 15079.92 16088.34
12685.90 13490.29 14367.25
12840.99 13631.55 14523.25
13828.21 14721.37 15692.87
13941.18 14893.09 15883.97
13926.41 14874.28 15863.39
14109.04 15146.41 16163.94
15465.31 16517.06 17612.66
15369.12 16417.10 17506.70
15302.42 16353.60 17439.86
14070.24 15103.84 16118.45
15389.79 16435.12 17525.21
14067.06 15061.63 16068.61
Canillas, E and V. M Salokhe,. 2001. Regression analysis of some factors influencing soil compaction. Soil and Tillage Research, 61(4): 167 –178.
Canillas, E. and V. M Salokhe,. 2012. Modeling Soil compaction in agricultural soil. Journal of Terramechanics, 39 (2): 79 – 74.
Eberhard, P and C Bischop,. 1999. Automatic differentiation of numerical integration algorithms. Mathematical computation, 68(226): 717-731.
Fasinmirin, J.T and I.E Olorunfemi. 2013. Soil moisture content variation and mechanical resistance of Nigerian Alfisol under different tillage systems. Journal of Agricultural Engineering and Technology, 21(2): 11-20 Ghosal, M.K and D.K Das,. 2008. Traction and mechanics of
tractor chassis, chapter 21 in Farm Power,(325-347):Kalyani Publishers. Ludhia-New Delhi-NOIDA(U.P)
Goering, C. E., L. S.Marvin, , W. S.David, and K. T Paul,. 2003. Tractions and transport devices. Off-Road Vehicle
Engineering Principles (pp. 351-382).St. Joseph, Mich: ASAE Copyright American Society of Agricultural Engineers. Goering, C. E., I.Stone, , W. S.David, and K. T.Paul. 2006.
Off-Road Vehicle Engineering Principles. Tractions and transport devices chapter 13, pp. 351-382, St. Joseph, Mich. ASAE Copyright American Society of Agricultural Engineers.
Gonzalez, O., M Rodriguez, and J. A. Ladron de Guevara. 2004. Using the Brixius Model to Predict Traction of Heavy Sugarcane Machinery. Proceeding of South African Sugarcane Technological Association. (2004)78.
Kazam,C. and T.Alper. 2012. Prediction of tire tractive performance by using artificial neural networks.
Mathematical and Computational applications,
17(3):182-192
Li, S., L Petzold, and W Zhu,. 2000. Sensitivity analysis of differential – algebraic equations. A comparison of methods on a special problem. Applied Numerical Mathematics, 32(2): 161-174.
McCuen, R. H. 1973. The role of sensitivity analysis in hydrologic modelling. Journal of Hydrology, 18(1):37-53.
Nail, E.L., D.L Young, and W.F.Schillinger. 2007. Government subsidies and crop perusal effects on the economics of conservation cropping system in Eastern Washington. Agricultural Journal. 99(3):614-620. Nkakini, S.O and A.J Akor. 2012. Modeling tractive force
requirements of wheel tractors for disc ploughing in sandy loam soil. International Journal of Engineering and Technology ,2(10):1707-1712..
Nkakini, S.O and I.E Douglas. 2013. Prediction of tractive force model for disc harrowing using sensitivity analysis.
CIGR Journal, 15( 3): 60-66.
Nkakini, S.O. and I.Fubara- Manuel. 2012. Modeling tractive force requirements of wheel tractors for disc ridging in loamy sand soil. International Journal of Engineering and Technology, 2(10): 1657-1665.
Nkakini, S.O. 2014. Performance evaluation of disc ridging tractive force model in loamy sand soil using sensitivity measured parameters. Agricultural Engineering International: CIGR Journal, 16 (2): 15-21
Nkakini, S.O., A.J.Akor, , I.J Fila, and J Chukwumati,. 2008. Investigation of soil physical properties and Okra emergence rate potential in sandy loam soil for three tillage practices. Journal of Agricultural Engineering and Technology,16 (2):34-43.
Nkakini,S.O. and A.J Akor. 2013. Effects of tillage on soil moisture content, Okra (Abelmosehus Esculentus) emergence and yields. Agricultural Mechanisation in Asia, Africa and Latin America, 44 (2): 15-21.
Nwokedi P. M. 1992. Machinery Traffic and tillage effects on yam cultivation. Experimental and system optimization. Unpublished PhD Thesis Department of Agricultural Engineering University of Nigeria, Nsukka. Roberto, B. 2006. Sensitivity analysis of ODEs/DAEs using the
taylor series method. Society for Industrial and applied mathematics. Journal of Science Computation, 27(6) : 1929-1947.
Saarilahti, M. 2002. Soil interaction model. Development of a protocol for coefficient wood harvesting on sensitive sites (ECOWOOD). Project deliverable D2(work package No.1) on soil interaction (pp. 2-87). University of Helsinki: Department of Forest Resource Management
Sale, N.A., O.G.Gwarzo, , O.G.Felix, and S.I Idris. 2013. Performance evaluation of some selected tillage implements. In Proceedings of The International Conference and 34th Annual General Meeting of the Nigerian Institution of Agricultural Engineers Uyo, 21st-24th October, 2013(34): 71-77. NIAE.
Simonyan, K. J. 2006. Mathematical modeling of the grain cleaning process in a stationary. Sorghum thresher. Unpublished PhD Dissertation. Ahmadu Bello University, Zaria.
Thangavadivelu, S. and T. S.Colvin. 1990. Trafficability determination using Fuzzy set Theory.For presentation at the 1990 International Winter Meeting sponsored by ASAE, Hyatt Regency Chicago, Chicago, Ilionis, Dec. 18-21, 1990. ASAE, St. Joseph, M149085 9659, U.S.A
Young, R.N., E.A Father, and N Skiadas. 1984. Development in Agricultural Engineering 3,vehicle traction mechanics: Elsevier,Science Publisher Amsterdam.