The International Journal of Environmental Resources Research
Vol. 1, No. 1, January 2013
GUASNR
A Bayesian Decision Support System Model: Dryland
Salinity Management Application
A. Sadoddin1*, R. Letcher (Kelly)2, T. Jakeman3, B. Croke3, L. Newham3
1
Gorgan University of Agricultural Sciences and Natural Resources 2
isNRM Pty Ltd Consultancy, Trevallyn TAS 7250, Australia 3
The Fenner School of Environment and Society, Australian National University
Received: September 2012 Accepted: December 2012
Abstract
Addressing environmental management problems at catchment scales requires an integrated modelling approach, in which key bio-physical and socio-economic drivers, processes and impacts are all considered. Development of Decision Support Systems (DSSs) for environmental management is rapidly progressing. This paper describes the integration of physical, ecological, and socio-economic components in a Bayesian Decision Network (BDN) and its implementation in the Interactive Component Modelling System (ICMS) software to build a prototype DSS for salinity management in the Little River catchment in the upper Macquarie River basin, NSW Australia. Salinity is a major environmental problem in the country. This integrated model implemented in a DSS has been developed to co-ordinate the various disciplines involved in salinity problems, integrate data and information available, and allow the investigation of the potential outcomes arising from implementing salinity management options at the catchment scale. The analysis of the trade-offs presented in this study shows that there is no single or ultimate solution to salinity management problems for the catchment, but the Little River catchment BDN decision support system, as a decision toolbox, does clarify the impacts of management options. It assists users to reach their own conclusions on the basis of their improved understanding of the system and of the trade-offs among various outcomes arising from implementing salinity management scenarios.
Keywords: Bayesian networks, Decision support system, Salinity management, The Little River catchment
1. Introduction
Nature is complex, comprising multiple components. These interconnected components interact with each other making a complex system with specific characteristics and also with spatial and temporal patterns of elements and factors
(Jakeman et al., 2005). As a result, natural resource management as an attempt to
deal with this multi-dimensional system is also complex. To manage such systems, good management strategy and practices should be able to deal with existing and future conflicts between long-term and short-term benefits to the stakeholder community living in or dependent on the system. The conflict between upstream and downstream interests also needs to be addressed to attain the objectives of
management (Brooks et al., 2003). These facts indicate that it is necessary to seek
and reach a compromise among the various outcomes of management interventions in a management system (catchment) (Sadoddin, 2010). That is, the stakeholder community of the management system should be prepared to ‘trade’ and reach a consensus view-point that in turn, will assist the community to make a final management decision (Sadoddin, 2006).
Additionally, in natural resources management, uncertainty results from the inherent variability in the prediction of alternative states of nature and of natural processes over time. It can be usually characterised by a probability distribution (Mowrer, 2000). Stakeholders’ participation and uncertainty analysis have a key role in successful integrated natural resource management. Therefore, there is a need for tools and methodologies that make it easier to meet these requirements (Castelletti and Soncini-Sessa, 2007). Bayesian Networks (BNs) use probability theory to manage uncertainty by explicitly representing the conditional dependencies between the different knowledge components (Varis and Kuikka, 1999). The BNs explicitly represent uncertainty in a way that can be understood clearly by users (Cain, 2001).
In terms of an approach to a successful management strategy, community acceptance and adoption often require approaches that represent a ‘compromise’ management scenario, reflecting trade-offs among social, economic, ecological, and physical outcomes at the catchment scale. This approach is a stakeholder-centered approach that allows stakeholders to be actively involved in the process of decision-making. This can be undertaken through an investigation of various management scenarios and their potential outcomes and trading off to reach a
learned decision (Jakeman et al., 2005). The use of DSS tools in integrated natural
resource management facilitates this process effectively.
A DSS has been defined in many different ways, but it can be regarded in
general as an interactive, flexible, and adaptable computer-based information system especially developed for supporting the appreciation and solution of a complex, poorly structured or unstructured, strategic management problem for
DSS is built by an interactive process, supports one or more phases of
decision-making, and may include a knowledge component (Matthies et al., 2007).
Bayesian Decision Networks (BDNs) are effective tools for not only communicating decision models among decision analysts and decision makers, but
also for communication between the analyst and the computer (Dorner et al.,
2007).
This capability of BDNs was introduced in this paper to build a Decision Support System (DSS) for dryland salinity management, a major environmental problem in Australia. The BDN developed in this study was implemented in a modelling platform known as the Interactive Component Modelling System (ICMS). The ICMS software is an object-oriented modelling environment incorporating data and models used in catchment management modelling (Letcher and Weidemann, 2004). ICMS has demonstrated its utility in the delivery of
decision support for management to stakeholders (see for example Reed et al.1999;
Letcher, 2004; Newham et al., 2004; Ticehurst et al., 2007). The object-oriented
structure of ICMS and its generic approach to modelling allow for easy upgrades to the model over time and/or extension of models to new catchment situations
(Newham et al., 2004).
In addition, customised user-interfaces can be developed which communicate with the ICMS software to allow easier access to models by non-technical
stakeholders (Cuddy et al., 2002). Thus, stakeholders are able to develop their
understanding of the system components and also run scenarios and explore the possible outcomes of scenarios being tested without having specific modelling skills. This has meant that the BDN model, described briefly in this paper, has been able to be implemented as a fully functioning DSS for dryland salinity management through using ICMS.
2. Experimental protocols
2.1. The Little River catchment description
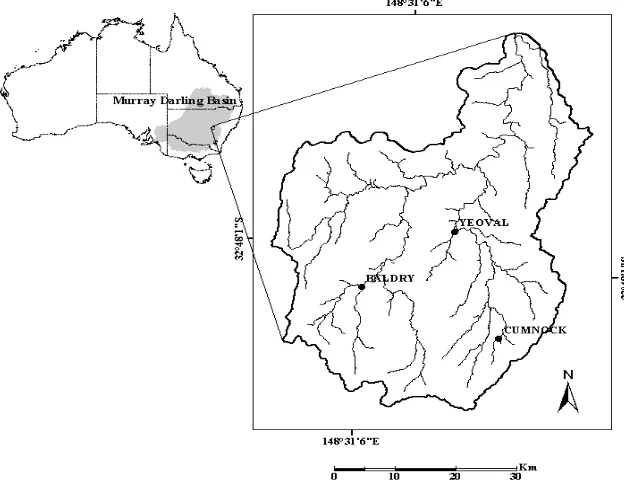
The Little River is a tributary of the Macquarie River lying southwest of Wellington in central western NSW, Australia and is one of the headwaters of the Murray-Darling River system (see Figure 1). The Little River catchment
(approximately 2300 km2) is located upstream of the Macquarie Marshes and joins
one of the factors that influence salinization (Watson et al., 2002). Almost 67% of the catchment has been identified as having soil types which are prone to salinization problems. Therefore, soil-derived salinization is likely to be a serious issue in the Little River catchment.
Since the arrival of Europeans in the 19th century, approximately 80% of native vegetation in the Little River catchment has been cleared for agricultural purposes,
especially on fertile soils (Seddon et al., 2002). Therefore, most of the remaining
native woodlands occur on less fertile soils and steep terrains, or is extremely fragmented.
Figure 1. Location of the Little River catchment
2.2. Overview of the BDN decision support system structure
The BDN decision support system for salinity management in the Little River catchment is a computer-based tool which can be used to trade-off biophysical and socio-economic outcomes resulting from changes in salinity management practices. The biophysical components include hydrologic and ecological impacts. These are linked to an economic component which describes the impacts on establishment costs and farm returns. A link is also made with a social component that assesses the acceptability of the scenarios to the farming community of the Little River
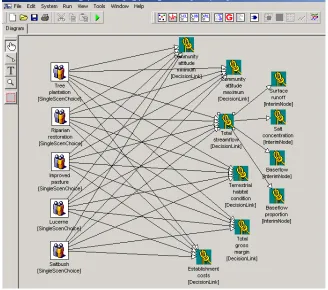
BDN for salinity management in the Little River catchment implemented in ICMS
(Sadoddin et al., 2011). In Figure 2, the nodes represent decision and/or state
variables (see Table 1) and the links show the existence of direct causal influences between the variables. The probability distributions are passed through the network by the links.
Figure 2. ICMS Conceptual View of the BDN decision support system for salinity management in the Little River catchment
A description of the sources of information and the methods used to derive the conditional probability tables for the BDN can be seen in Sadoddin (2006).
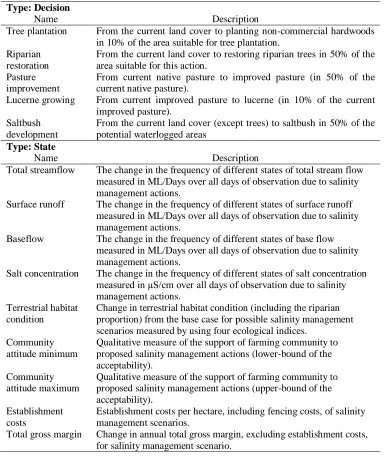
Table 1. Description of the decision and state nodes of the Little River catchment BDN decision support system
Type: Decision
Name Description
Tree plantation From the current land cover to planting non-commercial hardwoods in 10% of the area suitable for tree plantation.
Riparian restoration
From the current land cover to restoring riparian trees in 50% of the area suitable for this action.
Pasture improvement
From current native pasture to improved pasture (in 50% of the current native pasture).
Lucerne growing From current improved pasture to lucerne (in 10% of the current improved pasture).
Saltbush development
From the current land cover (except trees) to saltbush in 50% of the potential waterlogged areas
Type: State
Name Description
Total streamflow The change in the frequency of different states of total stream flow measured in ML/Days over all days of observation due to salinity management actions.
Surface runoff The change in the frequency of different states of surface runoff measured in ML/Days over all days of observation due to salinity management actions.
Baseflow The change in the frequency of different states of base flow measured in ML/Days over all days of observation due to salinity management actions.
Salt concentration The change in the frequency of different states of salt concentration measured in µS/cm over all days of observation due to salinity management actions.
Terrestrial habitat condition
Change in terrestrial habitat condition (including the riparian proportion) from the base case for possible salinity management scenarios measured by using four ecological indices.
Community attitude minimum
Qualitative measure of the support of farming community to proposed salinity management actions (lower-bound of the acceptability).
Community attitude maximum
Qualitative measure of the support of farming community to proposed salinity management actions (upper-bound of the acceptability).
Establishment costs
Establishment costs per hectare, including fencing costs, of salinity management scenarios.
2.3. Modelling platform
The ICMS is free under compliance with the license agreement and can be ordered by potential users.
The model building component, ICMSBuilder, provides a simple C-like internal language for writing models, as well as a drag-and-drop palette for linking objects and their models to describe the flow of processes and/or information through a
catchment system (Cuddy et al., 2002). In this paper, an application which is
completely self-contained in aicm file was developed as an ICMS Project. The project is built within ICMSBuilder using its System View canvas to define classes (in this case Decision and State classes) and then create objects of these classes. Objects are connected by linking the output data from one object to input data of
another (Cuddy et al., 2002).
Decision class objects exist for each of the management decision choices able to be undertaken. These objects connect decision choices to a scenario number, used to access relevant scenario results. There are two types of state nodes: Decision Link nodes which have only decision nodes as parents, and Interim Nodes which have only state nodes (not decision nodes) as parents. As illustrated in Figure 2, all decision nodes are connected to all Decision Link nodes. The state node ‘Total stream flow is the parent node of four Interim Nodes ‘Surface runoff’, ‘Baseflow, ‘Salt concentration’, and ‘Base flow proportion’. Decision Link and Interim Node nodes propagate the impacts of scenarios on outcomes through the network by passing probability distributions for state variables and using conditional probability information. Each model is associated with a class.
Cuddy et al. (2002) stated that separating the interface from models and data
allows the same set of models (captured in an ICMS Project) to be made available to different groups of users through providing different Views into the Project to suit particular audiences. The role of ICMS is to provide for maximum technical access when necessary, while allowing for customisation of an interface when the details of processing do not need to be shown or automatic results of scenario runs
need to be produced (Cuddy et al., 2002). This is achieved through building custom
Views into ICMS that have access to all of the ICMS’ functions and data. The following section describes the user-interface of the BDN decision support system for the Little River catchment.
User-interface of the BDN decision support system for the Little River catchment Recent developments show a continuum between integrated assessment modelling and DSS with different levels of stakeholder participation in both DSS
development and application (Matthies et al., 2007). The delivery of science to
catchment managers and stakeholders in a sensible and informative way is an important component of building successful DSSs for managing catchments in an
integrated way (Cuddy et al., 2002; Alvarez, 2010). In this way, stakeholders'
large DSS which attempts to predict many management questions, there is a focus only on the impacts of dryland salinity management scenarios through using some impact indicators.
The user-interface of the BDN for the Little River catchment facilitates communication with the stakeholders of the catchment and more importantly increases the transparency of modelling for the stakeholders through transferring the science required for salinity management purposes, in an easy and quick manner.
The implementation of a generic user-interface created using the Borland
Delphi 5 software by Ticehurst et al. (2007), was undertaken for the Little River
catchment case study using the following set of information (Sadoddin et al.,
2011):
Several files of html and rtf format to provide potential users with some general
information and background for the application including a brief description of the Little River catchment, sources of information including GIS maps and photographs, a description of the modelling approach, a description of each salinity management action, and a description of each variable.
An initial text files containing a description of key project features required by
the interface code to tailor the interface to the application. This comprises features of the interface, including a list of management actions as well as a list of variables in the Output view page, and a description of states for each variable.
A set of maps illustrating some information on the catchment;
Photographs illustrating management issues and scenarios related to the BDN
application.
The background information compiled and presented in the interface will assist users of the BDN in understanding the system variables and processes in relation to salinity management. Additionally, the quality of the data used to extract the probability distribution tables can be either described in the Input view page of the interface or reported in the output of the BDN modelling support system. This feature also assists users to determine their level of confidence in the outputs and assess where more detailed information is required to improve predictions.
Figure 3. The ‘Scenario’ view page of the user-interface for the BDN modelling support system for salinity management in the Little River catchment which shows the 31 management scenarios developed in this study and their management actions
Table 2. A list of salinity management scenarios for the Little River catchment and their management actions
Scenarios
Action 1 2 3 4 5 6 7 8 9 10 11 12 13 14 15 16 Tree plantation in
terrestrial areas (F) Riparian restoration (R) Saltbush development (B) Pasture improvement (I) Lucerne growing (L) Scenarios
Action 17 18 19 20 21 22 23 24 25 26 27 28 29 30 31 32 Tree plantation in
terrestrial areas (F) Riparian restoration (R) Saltbush development (B) Pasture improvement (I) Lucerne growing (L)
The following section presents an analysis of the bio-physical and socio-economic trade-offs associated with the salinity management scenarios in the Little River catchment.
3. Results
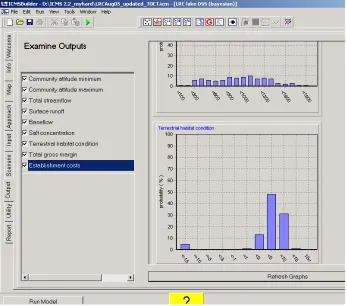
As stated earlier, using the DSS prototyped in this study, a user is able to view and understand various possible management scenarios, explore the likely outcomes of implementing the chosen scenarios, and reach to an understanding of the trade-offs among the outcomes. Figure 4 illustrates a screen grab of the ‘Examine Outputs’ page of the user-interface of the BDN. It shows bar charts of the nine outcome variables of the scenarios being tested for the catchment.
The bio-physical and socio-economic outcomes of the salinity management scenarios have been translated into multivariate data sets. Segment diagram presentation was utilised to represent the outcome variables corresponding to each salinity management scenario. Segment diagrams represent p measurements of a case on equally spaced radii extending from the centre of a circle (du Toit, 1986). The value of a variable is shown by the radius of the segment representing the variable (Dye, 2005). Such a visual technique is useful for comparing various outcomes of management interventions considered as impact indicators for the 32 salinity management scenarios.
Figure 5 shows segment diagrams of the medians of values of nine outcomes, from implementing each management scenario in the Little River catchment. In this figure, the values of variables are scaled independently so that the maximum value (or ‘best’) in each variable is 1 and the minimum (or ‘worst’) is 0. To facilitate comparison among the management scenarios in segment diagrams for those variables with adverse impacts, their inverted values are represented in the diagrams. This is the case for ‘establishment costs’, ‘base flow’, ‘salt concentration’, and ‘base flow proportion’. Hence, the radii of the diagrams show the level of achievement of management objectives considering all impact indicators.
The median of values of impact indicators are used to represent the changes in the impact indicators. This measure of central tendency assists in addressing some questions that cannot be answered through displaying the probability distributions of the impact indicators. For example, describing typical values and the trend in data can be addressed by measures of central tendency (Smithson, 2000). When there are a few extreme values in a distribution (also known as ‘outliers’) the median is much less influenced by them than the mean (Smithson, 2000).
The segment diagrams for the median of the values of the impact indicators show that the 32 management scenarios at first sight can be placed into two distinct sets:
Scenarios 1 to 16 with, in general, larger sizes of segments in the diagram, which show a greater total achievement of management objectives, considering all of the impact indicators but regardless of their significance to a stakeholder community or policy makers; and Scenarios 17 to 32 with, in general, smaller sizes of segments in the diagram (see Table 2 for a list of the management scenarios).
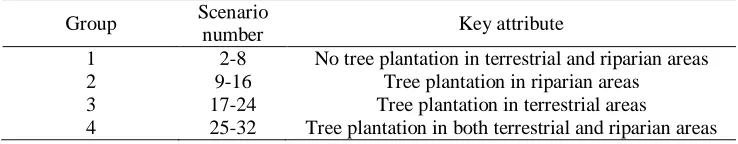
Table 3. Groups of salinity management scenarios for the Little River catchment
Group Scenario
number Key attribute
1 2-8 No tree plantation in terrestrial and riparian areas
2 9-16 Tree plantation in riparian areas
3 17-24 Tree plantation in terrestrial areas
4 25-32 Tree plantation in both terrestrial and riparian areas
4. Discussion
The development of a decision analysis tool using the BDN approach for the
Little River catchment has addressed the need for an integrated approach arising
from the nature of environmental management, in general, and management of
dryland salinity in the catchment, in particular.
The Little River catchment BDN decision support system has been prototyped to develop understanding of the system components and to provide a decision-making tool which can be used to run salinity management scenarios and explore the possible outcomes of the scenarios being tested. This, in turn, develops understanding of the trade-offs among various outcomes of management options, which is necessary for catchment management to be achieved.
The trade-offs represented in Figure 5 show that the contributions to various outcomes of the salinity management options differ among the 32 scenarios. That is, changes in the median values of the impact indicators from one scenario to another are not identical. Between the two sets of scenarios (scenarios 1 to 16 and scenarios 17-32) the changes are very different, indicating the large impacts of tree plantations in the Little River catchment on outcomes. A range of outcomes can be achieved in future by implementing different salinity management scenarios now.
Figure 5 also demonstrates that a limited envelope of outcomes from vegetation-based salinity management options will be feasible in the catchment and each set of outcomes from implementing one specific scenario is associated with costs in attaining the outcomes. The analysis provides a context for valuing vegetative salinity management options where multi-disciplinary outcomes are at issue.
The analysis of trade-offs also shows that there is no single or final solution to salinity management problems. This result is in agreement with that found by
Nordblom et al. (2005) that due to the diversity in the factors influencing the
outcomes. The BDN decision support system developed in this study meant to facilitate this process.
Multiple-course scenarios for management purposes in the catchment provide more choices to the farming community in the catchment. This type of scenario (see Table 2), with a wider range of activities and possible outcomes, would not only meet some of the salinity management requirements, but would also be likely to satisfy selectively some other social, economic, and ecological requirements and/or constraints.
Dryland salinity management is a field in which the number of variables and their interactions require management tools to integrate information and support decision-making. The BDN decision support system developed here has also addressed the problems encountered due to sparse and scattered bio-physical and socio-economic data. Finally, the BDN approach implemented in this study has served as a valuable tool to communicate uncertainty of the parameters in the BDN decision support system of the Little River catchment.
Acknowledgements
The authors gratefully acknowledge the assistance of Mr. Ambrose Andrews in developing the generic user interface of the DSS demonstrated in the paper. The research is funded by the Ministry of Science, Research, and Technology of Iran.
Author Disclosure Statement
No competing financial interests exist.
References
Alvarez, I.N., 2010. A Bayesian model to construct knowledge based spatial decision support system for the Chaguana river basin. Ph.D. Thesis. Department of Fundamental Electricity and Instrumentation. Vrije University, Brussel.
Brooks, K.N., Ffolliott, P.F., Gregersen, H.M., and Debano, L.F., 2003. Hydrology and the management of watersheds. Iowa State Press. 574.
Cain, J., 2001. Planning improvements in natural resources management. Wallingford, Oxon, UK, CEH. 124.
Castelletti, A. Soncini-Sessa, A., 2007. Bayesian networks and participatory modelling in water resource management.Environmental Modelling and Software. 22, 1075-1088. Cuddy, S. M., Letcher, R. A., and Reed, M., 2002. Lean interfaces for integrated catchment
management models rapid development using ICMS. iEMSs Biennial Conference, Lugano Switzerland., 300 p.
Dorner, S., Shi, J., and Swayne, D., 2007. Multi-objective modelling and decision support using a Bayesian network approximation to a non-point source pollution model. Environmental Modelling and Software. 22, 211-222.
Dye, T.S., 2005. R Help Documentation. Available at: http://www.r-project.org.
Jakeman, A.J., Letcher, R. A., Saifuk, K. and Ongsomwang, S., 2005. Integrated water resources assessment and management. Integrating knowledge for river basin management. Jakeman, A.J., Letcher, R.A., Rojanasoonthon, S., and Cuddy, S. Canberra, Australian Centre for International Agricultural Research. 13-29.
Letcher, R.A., 2004. Modelling economic-ecological impacts in NSW coastal catchments - Wallis Lake prototype description. iCAM Client Report, Canberra
Letcher, R. A., Rojanasoonthon, S., and Cuddy, S. Canberra, Australian Centre for International Agricultural Research. 118, 13-28.
Letcher, R. A. and Weidemann, S., 2004. Modelling economic-ecological impacts in NSW coastal catchments - feasibility study. iCAM Client Report, Canberra.34 Pp.
Matthies, M., Giupponi, C., and Ostendorf, B., 2007. Environmental decision support systems: Current issues, methods and tools. Environmental Modelling and Software. 22, 123-127.
Mowrer, H. T., 2000. Uncertainty in natural resource decision support systems: sources, interpretation, and importance. Com. Electron Agri. 27, 139-154.
Newham, L. T. H., Letcher, R. A., Jakeman, A. J., and Kobayashi, T., 2004. A framework for integrated hydrologic, sediment and nutrient export modelling for catchment-scale management. Environmental Modelling and Software. 19, 1029-1038.
Nordblom, T., Hume, I., Bathgate, A., Hean, R., and Reynolds, M., 2005. Towards a market: geophysical-bioeconomic targeting of plant-based land use change for management of stream water yield and salinity. EEN .National Workshop, the Australian National University, Canberra.
Reed, M., Cuddy, S.M., and Rizzoli, A., 1999. A framework for modelling multiple resource management issues: an open modelling approach. Environmental Modelling and Software. 14,503-509
Sadoddin, A., 2006. Bayesian network models for integrated-scale management of salinity. Ph.D. Thesis, Center for Resource and Environmental Studies. Australian National University. Canberra. 252 Pp.
Sadoddin, A., R. A. Letcher., A. J. Jakeman., B. Croke., and L.T.H. Newham., 2009. Bayesian network modelling for assessing the biophysical and socio-economic impacts of dry land salinity management. 18th World IMACS/MODSIM Congress, 13-17 July, Cairns, Australia.
Sadoddin, A., Sheikh, V., Mostafazadeh, R., and Halili, M.Gh., 2010. Analysis of vegetation-based management scenarios using MCDM in the Ramian watershed, Golestan, Iran. IJPP. 4. 51-62.
Sadoddin, A., Kelly (Letcher), R., Jakeman, A.J., Croke, B., and Newham, L., 2011. A Bayesian network decision support system for salinity management. The First Sustainable Watershed Management Conference (SUWAMA), 19-21 September, Istanbul, Turkey.
Seddon, J., Briggs, S., and Doyle, S., 2002. Little River catchment biodiversity assessment CSIRO Report. Canberra. 90 Pp.
Ticehurst, J.L., Newham, L.T.H., Rissik, D., Letcher, R.A., and Jakeman, A.J., 2007. A Bayesian network approach for assessing the sustainability of coastal lakes. Environmental Modelling and Software. 22, 1129-1139.
Varis, O., and Kuikka, S., 1999. Learning Bayesian decision analysis by doing: lessons from environmental and natural resources management. Ecol Model. 119, 177-195. Watson, W., Evans, R. and Powell, J., 2002. Sustainability profile for the Little River