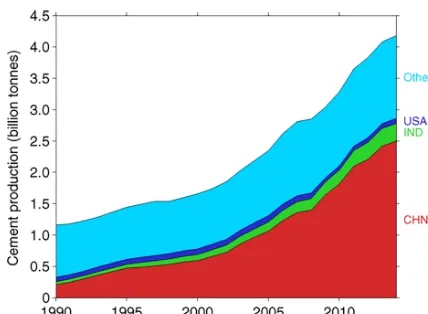
Global CO 2emissions from cement production
Full text
Figure


Related documents
Third, Hawaii workers who match with part-time jobs without employer-sponsored health insurance obtain publicly provided health insurance or military coverage with higher probability
2 7 None- theless, if the spouses are not legally separated under a decree of divorce or separate maintenance, payments that the payee spouse receives pursuant to
This potential for abuse is com- pounded by the provision that a debtor's property vests in the debtor upon confirmation of the plan and not upon consummation
Although much of the publicly available online data has potential utility for development purposes, private sector corporations hold a great deal more data that is valuable
Finally, as Zarei and Usefli (2015) claim in a rather new research, several studies have been done on various aspects of assessment as well as the effect of assessment type on
They use data from an Enterprise Survey of China to regress different firm performance indicators (TFP, investment rate, sales growth, employment growth) on a number of controls 50
In particular, for each station and decade, we calculated the threshold distance at which the common variance between target ( i ) and neighbour series is higher than 50 % ( r 2 =
The reason for this might be, that market participants are able to anticipate the approximate amount of in-feed from renewables for the following date and therefore the


