Printed in The Islamic Republic of Iran, 2016 © Shiraz University
Finite Element Analysis of Elastic-Plastic Solids under
Vickers Indentation: Surface Deformation
Ali Nayebi
*Department of Mechanical Engineering, Shiraz University, Shiraz, Iran Shiraz University
Abstract: Finite element modeling has been used to study the development of surface deformation during indentation with a Vickers indenter. A wide range of materials with different elastic modulus and yield stresses are examined. Results show that in a pyramidal indentation process, for a perfectly plastic material, sinking-in during loading can be changed to pile-up in unloading. This phenomenon depends on the elastic modulus to yield stress ratio. Results also indicate that the amount of pile-up cannot be related solely to the strain-hardening exponent, as often assumed. Rather, after initially sinking-in at small depths of penetration, the pile-up for many materials evolves and increases gradually as the indenter is driven into the material. It is shown that the ratio of the plastic volume radius to the indentation depth is nearly constant during loading and it is a function of the yield stress and the Young modulus. Experimental verification in loading and unloading is carried out with the results of Alcala et al. (Acta Materialia, 2000, pp. 3451).
Keywords: Indentation, Vickers hardness, FEM, Isotropic hardening, Pile-up, Sink-in 1. Introduction
A distinctive feature of indentation experiments is that the material around the contact area tends to deform upwards or downwards along the axis, z, where load is applied (Fig. 1). This behavior results in piling-up or sinking-in of material at the contact boundary [1, 2]. Such surface deformation modes influence hardness measurements as the true contact area between the indenter and the specimen increases in the case when piling-up predominates, and decreases when sinking-in occurs. The development of surface deformation around the indent is also relevant to the analysis of instrumented indentation experiments, where load and depth of penetration are measured continuously during the test.
Fig. 1. Vickers indentation geometry.
Instrumented indentation enables an assessment of mechanical properties such as Young's modulus, hardening exponent and yield strength, from key parameters such as the contact area [3-5]. In this technique, an evaluation of the contact area from measurements of depth of penetration is desirable as it
facilitates the automation of the indentation methodology (thus obviating the need for optical measurements of the imprint size). Such an evaluation requires a precise knowledge of the surface deformation modes, as errors of up to 30% can be introduced in the computation of contact area if the development of piling-up and sinking-in is not taken into account.
In the study of sharp indentation of plastic solids, finite element computation focuses on aspects such as the stress fields underneath the indenter, hardness values, the unloading response of the material, and contact deformation modes [6-12]. The investigations by Marx and Balke [8], and Bolshakov and Pharr [9] are noteworthy for their presentation of the results of the deformation modes around conical indenters, where the amount of piling-up and sinking-in was computed for a wide range of plastic responses. Marx and Balke showed that piling-up should predominate for soft materials with a low value of both hardness to Young's modulus ratio (H/E), and strain hardening exponent to Young's modulus ratio (n/E). Bolshakov and Pharr correlated the amount of piling-up and sinking-in with relevant variables from instrumented indentation, such as the normalized indentation depth, for materials with distinctly different strain hardening responses. Alcala et al. [13] performed some experiments with different materials (20 ≤y≤ 675
MPa and 0.05 ≤ n ≤0.52) and found a relationship between piling-up/sinking-in parameter (PS parameter) and the hardening exponent, n. Antunes et al. [14] did the three-dimensional numerical simulations of the hardness tests with Vickers indenter without taking into account the friction between the indenter and the indented material. They also simulated Vickers hardness tests with the Vickers indenter including the offset imperfection of the indenter tip and took into account the friction between the indenter and the sample. They studied the influence of the friction on the developed stress in the indented materials [15].
3D finite element modeling of Vickers indentation is a much time consuming computation and it requires a complicated modeling. The purpose of this work is to present a detailed numerical study on the features of the surface deformation modes around Vickers indents in function of material properties using a 3D finite element modeling. The systematic evaluation of the mechanical response of materials for which the Young's modulus to the yield stress ratio varies gradually allows to gaining some insight on the transition from sinking-in in loading to piling up in unloading around pyramidal indentations. As the development of elastic recovery upon unloading from the maximum indentation load may be anticipated to affect surface profiles, calculations are carried out to estimate the amount of piling-up and sinking-in which is actually present under the applied indentation load.
This paper is organized as follows. The used materials and numerical procedures are described in Section 2. A quantification of surface deformation around Vickers and spherical indents is provided in Section 3. The influence of the elastic deformation by the ratio of elastic modulus to yield stress, E/y,
taking place upon unloading on the development of piling-up is considered in Section 3.A. Maximum penetration depth effect on the development of piling-up or sinking in upon unloading for a known E/y is
discussed in Section 3.B. The changes in the surface deformation in loading and unloading are presented in section 3.C. The evolution of the plastic volume radius to the penetration depth ratio in different directions is discussed in section 3.D. Finally, a summary of the results is presented in Section 4.
2. FINITE ELEMENT SIMULATIONS
IJMF, Iranian Journal of Materials Forming, Volume 3, Number 1 April 2016 approximated the semi-infinite body. The mesh proposed by Giannakopoulos et al [10] was used. It is shown in Fig. 3a which is bounded by 5 surfaces. Roller boundary conditions were applied at the bottom surface by enforcing no displacements in the z direction and free movement in the x and y directions. Symmetry boundary conditions were applied along the centerline, and a free surface was modeled at the outside of the specimen and on the top surface outside the region of contact. The nodes of the surfaces Sr
and Sl can deform only in their own planes. The mesh independency of the results was tested. The mesh
shown in Fig. 3 was constructed for the Vickers analysis with the following characteristics: 7620 eight-nodded isoparametric block elements and 8741 nodes. In the elastoplastic analysis the contact area covered at least 10 elements.
Fig. 2. Schematic of the Vickers test geometry: a) top view; b) side view.
The resulting mechanical problem concerns a homogeneous and isotropic half-space indented in the normal direction to the surface by a Vickers indenter as shown in Fig. 1. It is assumed that the resulting deformation takes place under quasi-static and isothermal conditions. Furthermore, only frictionless contact between the indenter and the half-space is considered. The latter assumption is acceptable in the present situation as mainly global properties are at stake and frictional effects on such variables are known; cf. e.g. Carlsson et al. [17]. It was also shown by Giannakopoulos [18] that the friction has a minor influence on the Vickers indentation test. The calculations were performed under finite strain assumptions for both loading and unloading conditions.
Figure 4 illustrates the assumed elastic–plastic constitutive law. Linear elastic behavior with Young’s modulus E and Poisson’s ratio 0.3 was assumed up to the yield stress y. Thereafter, the behavior was
modeled as elastic–plastic with power-law hardening of the normal form =Kn. To assure continuity at the yield point, the strength coefficient, K, was related to the other material parameters through K=Eny
(n-1)
(Fig. 3). A strain rate independent model based on Mises flow theory with isotropic hardening was used in all computations.
x1 x2
45°
(a) (b)
(c)
Fig. 3. Finite element mesh used in elastoplastic analysis of the Vickers indentation: a) general view; b) detail of the mesh at the contact region; c) top view.
Sr
Sl Z
IJMF, Iranian Journal of Materials Forming, Volume 3, Number 1 April 2016 Fig. 4. schematic representation of the elastic–plastic constitutive law used in the finite element simulations.
The piling-up/sinking-in behavior was systematically characterized in the way it depends on the depth of penetration, , the ratio of the modulus to the yield strength, E/y and the strain hardening
exponent, n. To cover a wide variety of elastic–plastic materials, values of E/y were varied over the range
20≤E/y≤1000, which covers most metals, ceramics, and glasses. An ideal elastic material (E/y → 0) and
a rigid-plastic material (E/y → ∞) were also examined to establish important limits. Simulations were
also performed for elastic–perfectly-plastic materials (n = 0). Throughout the work, both loaded and unloaded configurations were examined to establish how the piling-up or sinking-in geometry changes when the indenter is withdrawn. The computed parameters of interest included the contact distances, ax1
and ax2 (x1 axis is in the direction of the diagonal and x2 axis is perpendicular to the contact surface.), the
contact depth, hc, the piling-up/sinking-in height, s, the load, P, and the contact profile geometry (see Fig.
1).
3. RESULTS AND DISCUSSION
3.1. Elastic modulus to yield stress ratio influence on piling-up/sinking down
How the surface deformation (piling-up or sinking-in) develops during the course of Vickers indentation is strongly dependent on the relative amounts of elastic and plastic deformation as characterized by the ratio of the elastic modulus to the yield stress, E/y, Johnson [19-20] noted that this parameter physically
represents the inverse of the elastic strain at yielding and can therefore be used as a measure of the amount of deformation that is accommodated elastically during indentation. In the limit E/y= 0 contact is strictly
elastic and dominated by sinking-in. At the other extreme, the limit E/y = ∞corresponds to rigid-plastic
deformation, for which there is extensive piling-up of the material around the indentation impression. The intervening elastic–plastic behavior was examined by finite element simulation. Figure 5 shows finite element predictions of indentation problems in x1 direction (Fig. 4) under loading for several different
materials deformed to the same penetration depth h = 10 µm. z direction is depicted in Fig. 3. When the z is positive, it means that the pile-up occurs and when it is negative, the sinking down is happened. Five different materials were considered: a purely elastic solid and four elastic/plastic solids with E/y = 20, 56,
elastic/plastic material with E/y = 20 and 56. The material with E/y = 100 exhibits a small amount of
pile-up, while pile-up is extensive for the material with E/y = 1000. After unloading, the contact
geometry changes due to elastic recovery, as shown in Fig. 6. In order to make this figure directly comparable to Fig. 5, the values of hmax at full load were used to normalize the unloaded problems. As
expected, the purely elastic material recovers completely. Recovery is also large for the material with E/y
= 20, but there is little recovery for the material with E/y = 1000 due to the fact that deformation at these
strains is dominated by plasticity.
Fig. 5. Loaded indentation profiles for h=10 µm and in x1 direction, showing the influence of E/y on the pile-up/sinking-in behavior.
Fig. 6. Unloaded indentation profiles for h=10 µm and in x1 direction, showing the influence of E/y on the pile-up/sinking-in behavior.
-1.00 -0.80 -0.60 -0.40 -0.20 0.00 0.20 0.40
0.00 0.01 0.02 0.03 0.04 0.05 0.06 0.07 0.08
r (mm)
z/
h
m
ax
E/y = 1000
= 100
= 56
20
= ∞
x1 (mm)
-1.00 -0.80 -0.60 -0.40 -0.20 0.00 0.20 0.40
0.00 0.01 0.02 0.03 0.04 0.05 0.06 0.07 0.08
r (mm)
z/
h
m
ax
E/y = 1000
= 100
= 56
=20
IJMF, Iranian Journal of Materials Forming, Volume 3, Number 1 April 2016 Figure 7 displays how the normalized PS parameter s/h in x2 direction varies with E/y. At full load
in purely elastic materials (E/y = 0), the PS parameter is -0.2. With increasing E/y, the value rises to s/h
= 0 at E/y = 80. The surface deformation parameter becomes positive for materials with higher E/y, and
reaches a nearly constant value when E/y = 1000, s/h = 0.2 which is in relatively good agreement with
the predictions of Alcala et al. [13]. After unloading, s/h = 0 for elastic materials (E/y = 0) but it is higher
for higher E/y values. In the limit of rigid-plastic behavior (E/y = 1000), there is no elastic recovery and
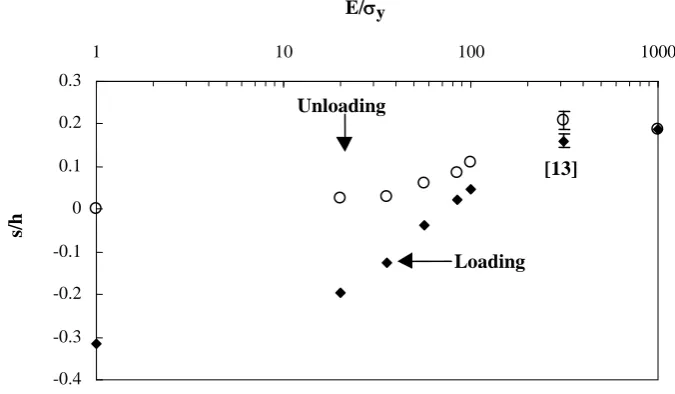
s/h remains unchanged at 0.2. Figure 8 shows the variation of the normalized surface deformation parameter, s/h, in x1 direction. At full load in purely elastic materials (E/y = 0), the PS parameter is -0.31,
which is in good agreement with experimental result of Alcala et al. [13] and numerical computations of Giannakopoulos and Larsson [12].
E/y
Fig. 7. Dependence of the surface deformation PS parameter in x2 direction, s/h, on E/y . Data for loaded and unloaded indentations are included.
E/y
Fig. 8. Dependence of the surface deformation PS parameter in x1 direction, s/h, on E/y . Data for loaded and unloaded indentations are included.
In summary, these observations demonstrate that:
(1) the piling-up/sinking-in geometry depends on the relative amounts of elastic and plastic deformation determined by the value of E/y, and
(2) due to elastic recovery, the geometry of loaded and unloaded contact impressions may be very different, especially for smaller values of E/y.
Su
rf
a
ce
Def
o
rma
tio
n P
a
ra
m
et
er
s/h
-0.2 -0.1 0 0.1 0.2
1 10 100 1000
Unloading
Loading Elastic
Su
rf
a
ce
Def
o
rma
tio
n P
a
ra
m
et
er
s/h
-0.4 -0.3 -0.2 -0.1 0 0.1 0.2 0.3
1 10 100 1000
Unloading
3.2. Dependence of pile-up on penetration depth
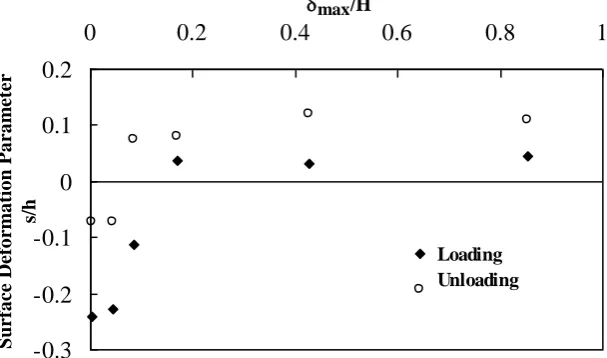
Figure 9 shows how the piling-up and sinking-in behavior depends on the normalized penetration depth h/H (H, height of Vickers indenter) for elastic/perfectly-plastic materials. To capture measurable amounts of both sinking-in and pile-up, the simulations were performed for a material with E/y = 200. At small
depths, the material deforms only elastically, and the indentation problem corresponds to s/h = 0.31. As the load on the indenter is increased, the plastic zone grows and spreads upward, and the sinking-in diminishes. At h/H of about 0.14, material starts to pile-up, and with further penetration, the pile-up becomes larger. As expected, full elastic recovery is observed when the material is in elastic domain. For greater depths, the extent of the recovery diminishes with increasing h/H, and the residual contact impression always exhibits some pile-up.
max/H
Fig. 9. Dependence of the surface deformation parameter in x1 direction, s/h, on the normalized penetration depth, h/H, for E/y = 200. Data for loaded and unloaded indentations are included.
Figure 9 also demonstrates the depth dependence of the PS parameter s/h in both the loaded and unloaded conditions. Although the two curves converge at large depths, it is clear that the loaded and unloaded stages can be very different due to elastic recovery, especially when h/H < 0.4. It should be noticed that in addition to dependence of surface deformation parameter, s/h, to E/y, the pile-up height is
a strong function of the penetration depth.
3.3. Changing material’s behavior from sinking-in to pile-up from loading to unloading
It is known that if the piling-up/sinking-in effect is not taken into account, an error in the hardness value can be as high as 30%. Figures 7 and 8 show that the behavior of materials changes from sinking-in to piling-up for materials having E/y parameter lower than about 100. It means that the hardness value
which depends strongly on the contact surface diminishes dramatically in unloading because of the increase of residual surface due to pile-up effect. So the error between the hardness value in loading and in unloading is much more pronounced.
Hardness is also strongly dependent on the penetration depth and the contact surface is completely different in loading and unloading. Its value is reliable when the material is in fully plastic regime [19].
3.4. Evolution of the plastic volume’s radius
Plastic volume, as it was proved experimentally by Abu-Alrub [21], is similar to a sphere but its center is below of the first point of contact. Its radius was measured in three directions x1, x2 and z. the three radius
were nearly equals when the E/y ratio is upper than 100 and when it is less than 100, the radius of plastic
volume in z direction is bigger than it in x1 direction and the plastic radius in x1 direction is bigger than it
in x2 direction. Figure 10 shows the section of plastic volume in plane x1-z plane and x2-z plane for two
-0.3 -0.2 -0.1 0 0.1 0.2
0 0.2 0.4 0.6 0.8 1
S/delta Loading
S/d Unloading Loading Unloading
Su
rf
a
ce
Def
o
rma
tio
n P
a
ra
m
et
er
IJMF, Iranian Journal of Materials Forming, Volume 3, Number 1 April 2016 Rp/ in x2
R
p
/
in
z
Rp/ in x1
E /y =1000 E /y =20
0 2 4 6 8 10 12
10 100 1000
E/y
R
p
/
different E/y ratios. When E/y is equal to 20 the radius in x1, x2 and z are equal 3.23 times the
displacement of the indenter. For the E/y equals 1000 this value is 9.29 times the displacement of the
indenter. For the first case the three radius are equivalent but in the second case, Rz>Rx1>Rx2.
Fig. 10. Normalized plastic radius in x1, x2 and z direction for two different E/y ratio at full load.
During the loading, for all of the studied cases, the ratio of the mean plastic radius to the corresponding indenter’s displacement, Rp/ stays, with good approximation (differences less than 5%),
constant. Figure 11 shows the evolution of this ratio with respect to the E/y ratio. Rp/ value increases
with the increase of the E/y ratio and follows a power law type curve.
4. CONCLUSION
Finite element simulations have shown that piling-up and sinking-in during Vickers indentation of elastic – perfectly plastic materials depend strongly on the relative amount of elastic and plastic deformation as characterized by the non-dimensional material parameter E/y and the non-dimensional depth of
penetration, h/H. It can be concluded that:
1. In the elastic regime, sinking-in is observed in a manner consistent with the experimental results of Alcala et al. [13] and numerical computations of Giannakopoulos and Larsson [12].
2. During the elastic–plastic transition, the pile-up grows such that it depends on the penetration depth and E/y parameter. The PS parameter s/h becomes constant and the pile-up is fully developed only when E/y
> 1000. Thus, in many materials, the pile-up geometry can be expected to change continuously during the course of a Vickers indentation experiment, and it is not appropriate to use the obtained result from the fully plastic analyses to model it.
3. Due to elastic recovery, the amount of piling-up depends on whether it is measured with the indenter loaded or unloaded. Elastic recovery is especially important at small depths of penetration and in materials with small E/y. Thus, when recovery is large, descriptions of pile-up based on measurements of residual
hardness impressions may not be appropriate for analyzing load and depth sensing indentation data since load and depth sensing measurements usually apply to the fully loaded state.
In summary, the observations show that the development of pile-up and sinking-in during Vickers indentation is a complex phenomenon that is not amenable to simple analytical descriptions.
5. References
[1] O'Neil, H., Hardness measurements of metals and alloys. New Jersey: Chapman Hall, (1951).
[2] Tabor, D., The hardness of metals. Oxford: Clarendon Press,(1951).
[3] E. Söederlund and D.J. Rowcliffe, J Hard Mater., 5 (1994) 149.
[4] G. Pintaúde, M. G. di, V. Cuppari, C. G. Schön, A. Sinatora, and R. M. Souza, Zeitschrift für Metallkunde, 96
(2005) 1252.
[5] J. Alcala, A.E. Giannakopoulos and S. Suresh, J. Mater. Res 13 (1998) 1390.
[6] A.K. Bhattacharya and W.D. Nix, Int. J. Solids Structures, 27 (1991) 1047.
[7] T.A. Laursen and J.C. Simo, J. Mater. Res., 7 (1992) 618.
[8] V. Marx and H. Balke, Acta mater, 45 (1997) 3791.
[9] A. Bolshakov and G.M. Pharr, J. Mater. Res., 13 (1998) 1049.
[10] A.E. Giannakopoulos, P.L. Larsson and Vestergaard, R., Int. J. Solids Structures, 31 (1994) 2679.
[11]P.L. Larsson, A.E. Giannakopoulos, E. Söerlund, D.J. Rowcliffe, and R. Vestergaard, Int. J. Solids Structures,
33 (1996).
[12]A.E. Giannakopoulos and P.L. Larsson, Mech. Mater., 25 (1997) 1.
[13]J. Alcala, A.C. Barone, A.C. and M. Anglada, M., Acta mater., 48 (2000) 3451.
[14]J.M. Antunes, L.F., Menezes, and J.V. Fernandes, Key Eng. Mat., 230 (2002) 525.
[15]J.M. Antunes, L.F., Menezes and J.V. Fernandes, Int. J. of Solids & Struct., Vol. 43 (2006) 781.
[16]A. Millard, Castem 2000, Rapport D.E.M.T./92 300, C.E.A, (1992).
[17] S. Carlsson, S. Biwa and P.L. Larsson, Int. J. Mech. Sci., 42 (2000) 107.
[18]A.E. Giannakopoulos, P.L. Larsson, R. Vestegaard, Int. J. Solids Struct., 31 (1994) 2670.
[19]K.L. Johnson, J. of the Mech. and Phys. of Solids, 18 (1970) 115.
[20]K.L. Johnson, Contact mechanics, Cambridge University Press, Cambridge, UK (1985).